. 2019 Mar 22:10:241.
doi: 10.3389/fgene.2019.00241. eCollection 2019.

Population Pharmacogenomics for Precision Public Health in Colombia

Affiliations

Population Pharmacogenomics for Precision Public Health in Colombia

Shashwat Deepali Nagar et al. Front Genet. .

Abstract

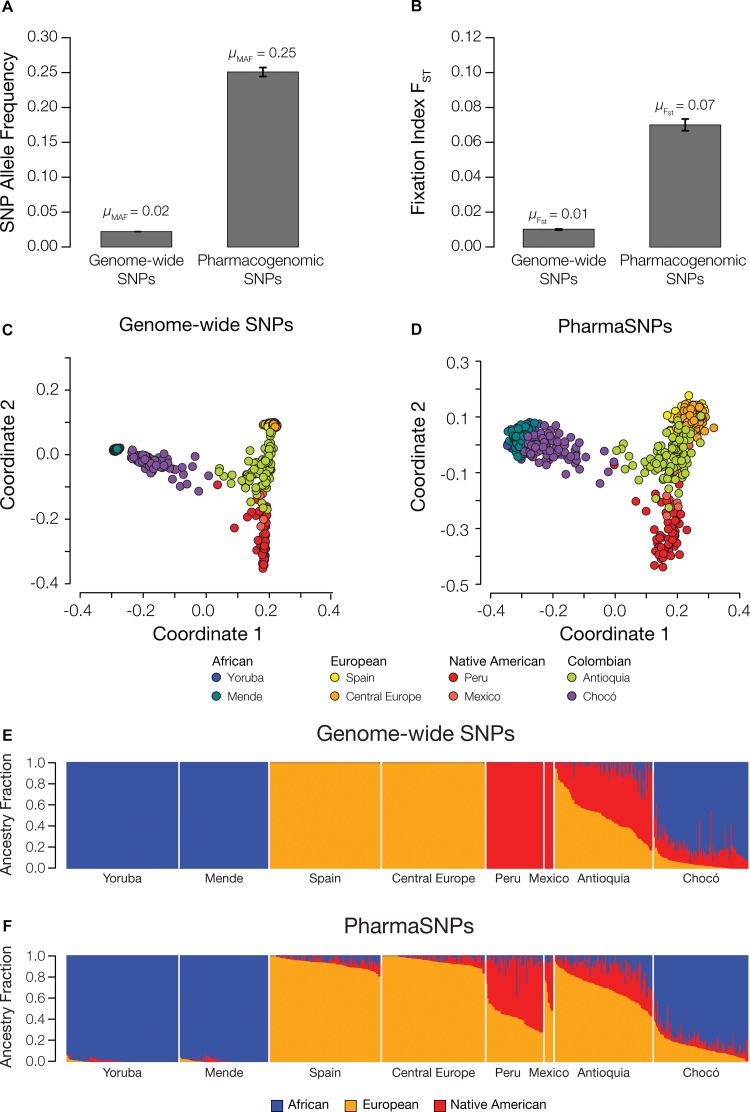
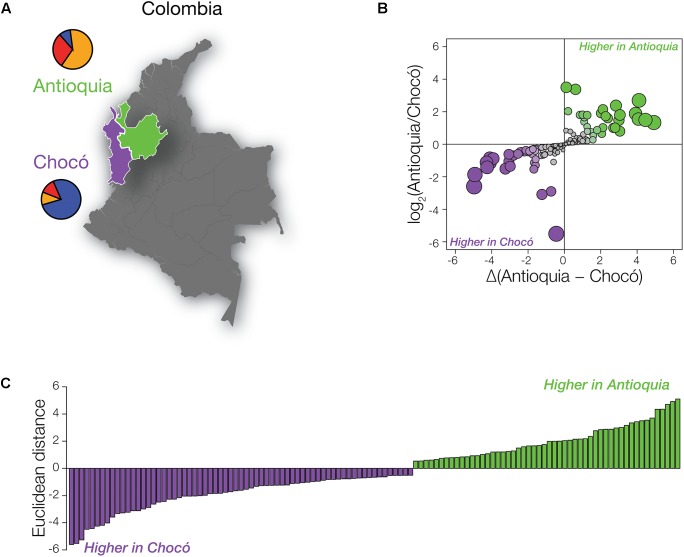
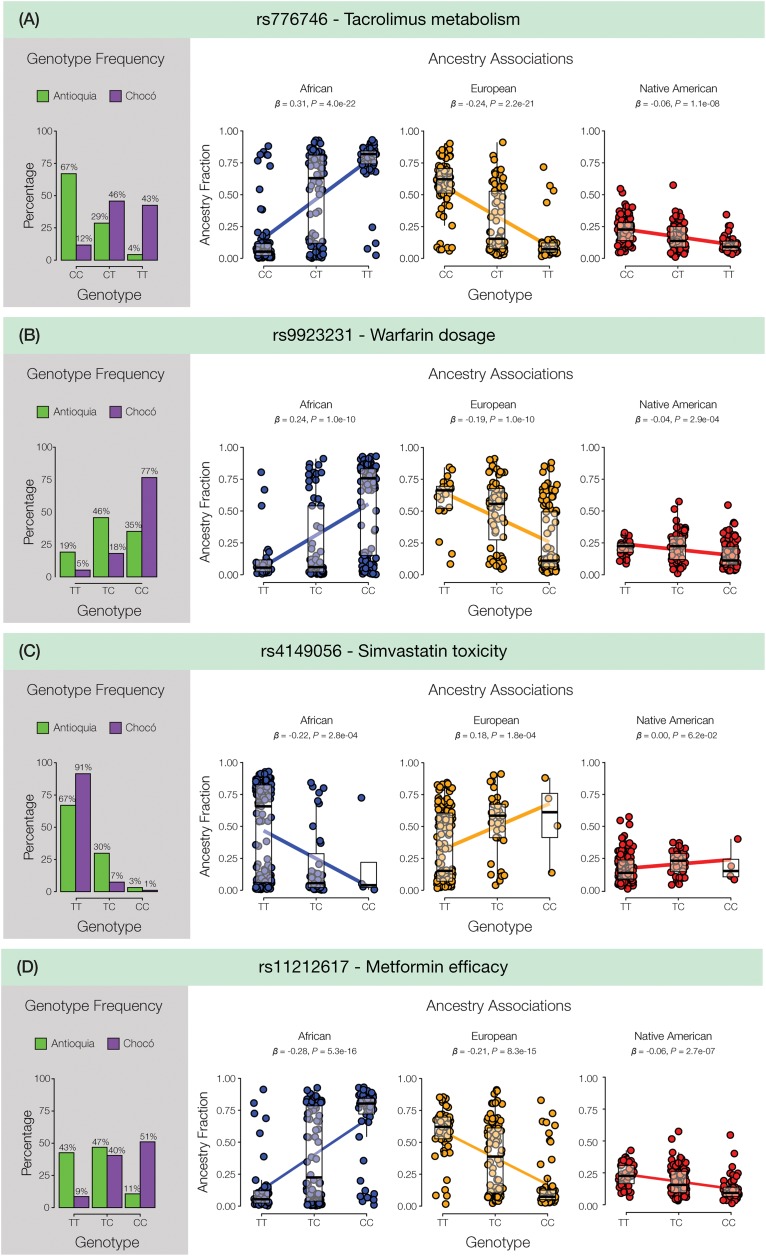
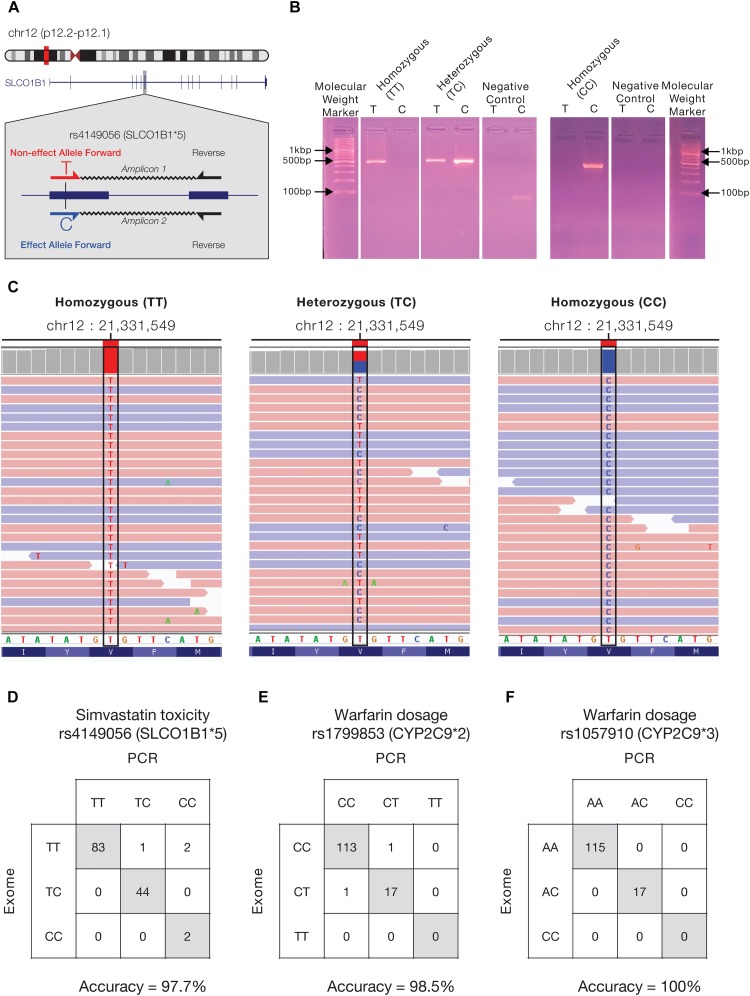
While genomic approaches to precision medicine hold great promise, they remain prohibitively expensive for developing countries. The precision public health paradigm, whereby healthcare decisions are made at the level of populations as opposed to individuals, provides one way for the genomics revolution to directly impact health outcomes in the developing world. Genomic approaches to precision public health require a deep understanding of local population genomics, which is still missing for many developing countries. We are investigating the population genomics of genetic variants that mediate drug response in an effort to inform healthcare decisions in Colombia. Our work focuses on two neighboring populations with distinct ancestry profiles: Antioquia and Chocó. Antioquia has primarily European genetic ancestry followed by Native American and African components, whereas Chocó shows mainly African ancestry with lower levels of Native American and European admixture. We performed a survey of the global distribution of pharmacogenomic variants followed by a more focused study of pharmacogenomic allele frequency differences between the two Colombian populations. Worldwide, we found pharmacogenomic variants to have both unusually high minor allele frequencies and high levels of population differentiation. A number of these pharmacogenomic variants also show anomalous effect allele frequencies within and between the two Colombian populations, and these differences were found to be associated with their distinct genetic ancestry profiles. For example, the C allele of the single nucleotide polymorphism (SNP) rs4149056 [Solute Carrier Organic Anion Transporter Family Member 1B1 (SLCO1B1)5], which is associated with an increased risk of toxicity to a commonly prescribed statin, is found at relatively high frequency in Antioquia and is associated with European ancestry. In addition to pharmacogenomic alleles related to increased toxicity risk, we also have evidence that alleles related to dosage and metabolism have large frequency differences between the two populations, which are associated with their specific ancestries. Using these findings, we have developed and validated an inexpensive allele-specific PCR assay to test for the presence of such population-enriched pharmacogenomic SNPs in Colombia. These results serve as an example of how population-centered approaches to pharmacogenomics can help to realize the promise of precision medicine in resource-limited settings.

Keywords: Antioquia; Chocó; Colombia; admixture; genetic ancestry; pharmacogenetics; pharmacogenomics; precision medicine.


Figures

FIGURE 1
FIGURE 1
Patterns of variation for pharmacogenomic SNPs (pharmaSNPs) worldwide. Average (A) minor allele frequency (MAF) and (B) fixation index (FST) values for all genome-wide SNPs (n = 28,137,656) and all pharmaSNPs (n = 1995) across the 26 1KGP populations studied here. Multi-dimensional scaling (MDS) plots showing the inter-individual genetic distances of admixed Colombian individuals (Antioquia and Chocó) in relation to global reference populations from Africa, Europe, and the Americas for (C) genome-wide SNPs and (D) pharmaSNPs. ADMIXTURE plots showing the genome-wide continental ancestry fractions using (E) all genome-wide SNPs and (F) only pharmaSNPs for admixed Colombian populations (Antioquia and Chocó) and reference African (blue), European (orange), and Native American (red) populations.
FIGURE 2
FIGURE 2
PharmaSNPs with population-specific effect allele frequency differences in Colombia. (A) Map of Colombia, highlighting Antioquia in green and Chocó in purple. Population-specific mean ancestry fractions are shown as pie charts: African (blue), European (orange), and Native American (red). (B) Comparison of the ratio of pharmaSNP effect allele frequency differences between Antioquia and Choco (y-axis) to the magnitude of the frequency differences (x-axis). Circles are scaled according to their Euclidean distance (distance from the origin) and are colored to indicate the direction of their difference (green – higher effect allele frequency in Antioquia; purple – higher effect allele frequency in Chocó). (C) Distribution of pharmaSNPs with Euclidean distance > 0.5. Green indicates that the pharmaSNP effect allele is more frequent in Antioquia, while purple indicates that the effect allele is more frequent in Chocó.
FIGURE 3
FIGURE 3
Ancestry associations for pharmaSNPs in Colombia. For each panel in the figure, pharmaSNP genotype frequencies are shown for Antioquia (green) and Chocó (purple) followed by the ancestry association plots. For each genetic ancestry component – African (blue), European (orange), and Native American (red) – individuals’ ancestry fractions (y-axis) are regressed against their pharmaSNP genotypes (x-axis). Ancestry associations are quantified by the slope of the regression (β) and its significance level (P). Results are shown for (A) the tacrolimus metabolism-associated SNP rs776746 (CYP3A53), (B) the warfarin dosage-associated SNP rs9923231 (VKORC12), (C) the simvastatin toxicity-associated SNP rs4149056 (SLCO1B15), and (D) the metformin efficacy-associated SNP rs11212617.
FIGURE 4
FIGURE 4
Allele-specific PCR assay for pharmaSNPs. (A) Schema depicting the design of the allele-specific PCR assay for the pharmaSNP rs4149056 (SLCO1B15) on chromosome 12. Two allele-specific forward primers are designed for the pharmaSNP of interest and paired with a single reverse primer, yielding allele-specific amplicons. (B) Allele-specific PCR results for four individuals are shown. PCR gel lanes are labeled with the allele used for the forward primer – T or C. (C) Results of exome sequence analysis used to confirm the results of the allele-specific PCR assays. Sequence reads (red – forward, blue – reverse) mapped to the genomic position for the SNP rs4149056, coverage levels (gray boxes above), and the identity of the called nucleotide variants at that same position are shown along with the reference nucleotide and amino acid sequences for the corresponding region of the SLCO1B1 gene (protein). Images were taken from the Integrative Genomics Viewer (IGV). Confusion matrices showing comparisons between the pharmaSNP variant calls made via exome sequence analysis and the allele-specific PCR assays are shown for (D) the simvastatin toxicity SNP rs4149056 (SLCO1B15), and the warfarin dosage SNPs (E) rs1799853 (CYP2C92) and (F) rs1057910 (CYP2C93). Identical variant calls are shown along the diagonal, whereas off-diagonal calls show discrepancies between the exome and PCR variant calls; accuracy levels for each test are shown.

References

    1. Alexander D. H., Novembre J., Lange K. (2009). Fast model-based estimation of ancestry in unrelated individuals. Genome Res. 19 1655–1664. 10.1101/gr.094052.109 - DOI - PMC - PubMed
    1. Andrews S. (2010). FastQC: A Quality Control Tool for High Throughput Sequence Data. Available: https://www.bioinformatics.babraham.ac.uk/projects/fastqc/ [accessed September 2017].
    1. Appelbaum N. P. (2016). Mapping the Country of Regions: The Chorographic Commission of Nineteenth-Century Colombia. Chapel Hill, NC: University of North Carollina Press.
    1. Bachtiar M., Lee C. G. (2013). Genetics of population differences in drug response. Curr. Genet. Med. Rep. 1 162–170.
    1. Bhatia G., Patterson N., Sankararaman S., Price A. L. (2013). Estimating and interpreting FST: the impact of rare variants. Genome Res. 23 1514–1521. 10.1101/gr.154831.113 - DOI - PMC - PubMed

LinkOut - more resources