. 2019 Mar 22:7:42.
doi: 10.3389/fcell.2019.00042. eCollection 2019.

Fatty Acid Oxidation Promotes Cardiomyocyte Proliferation Rate but Does Not Change Cardiomyocyte Number in Infant Mice

Affiliations

Fatty Acid Oxidation Promotes Cardiomyocyte Proliferation Rate but Does Not Change Cardiomyocyte Number in Infant Mice

Tongtong Cao et al. Front Cell Dev Biol. .

Abstract

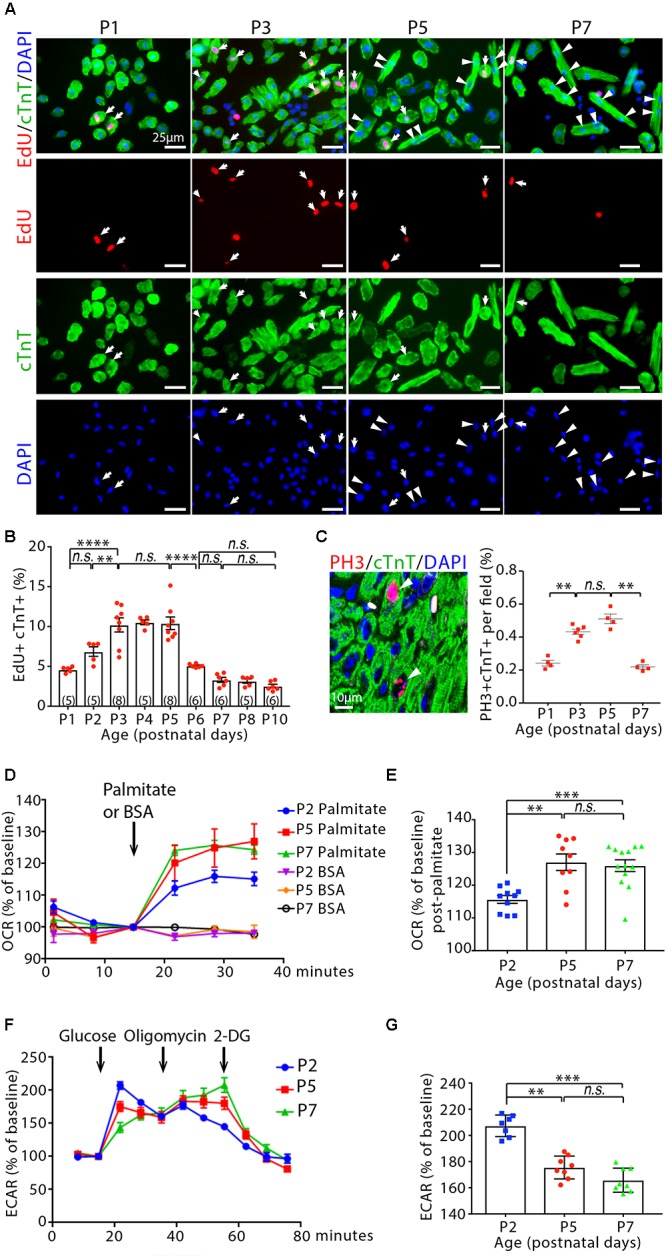
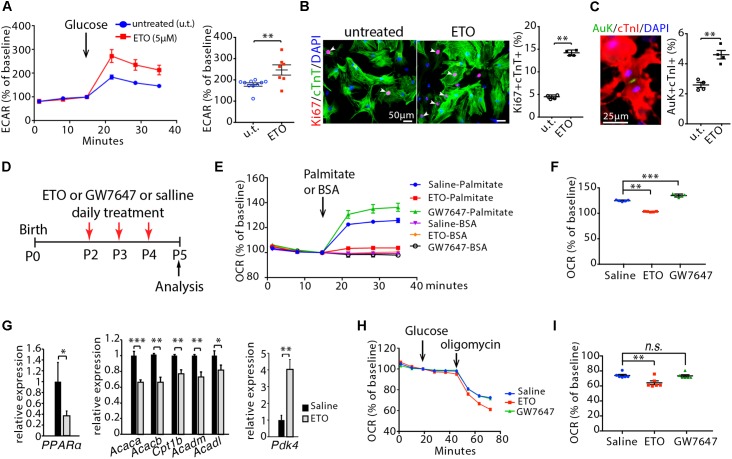
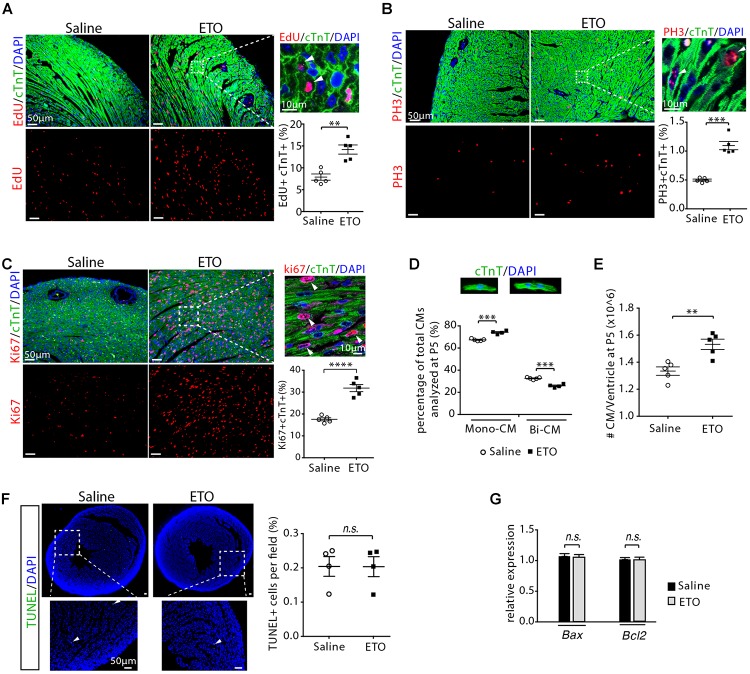
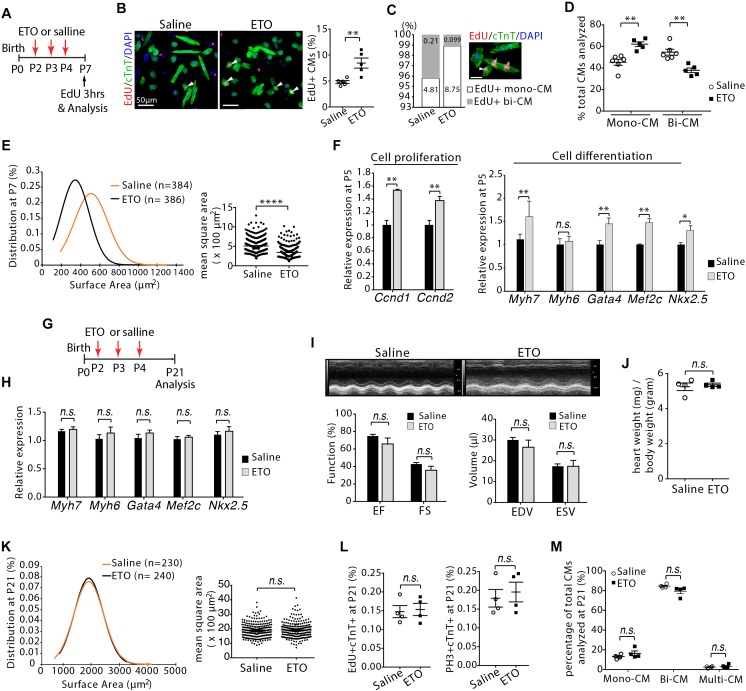
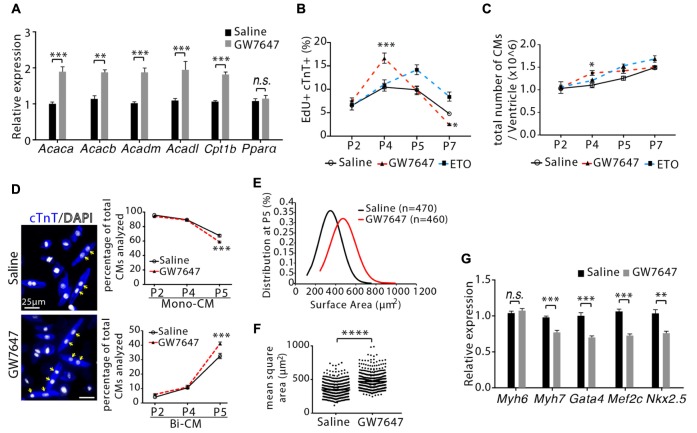
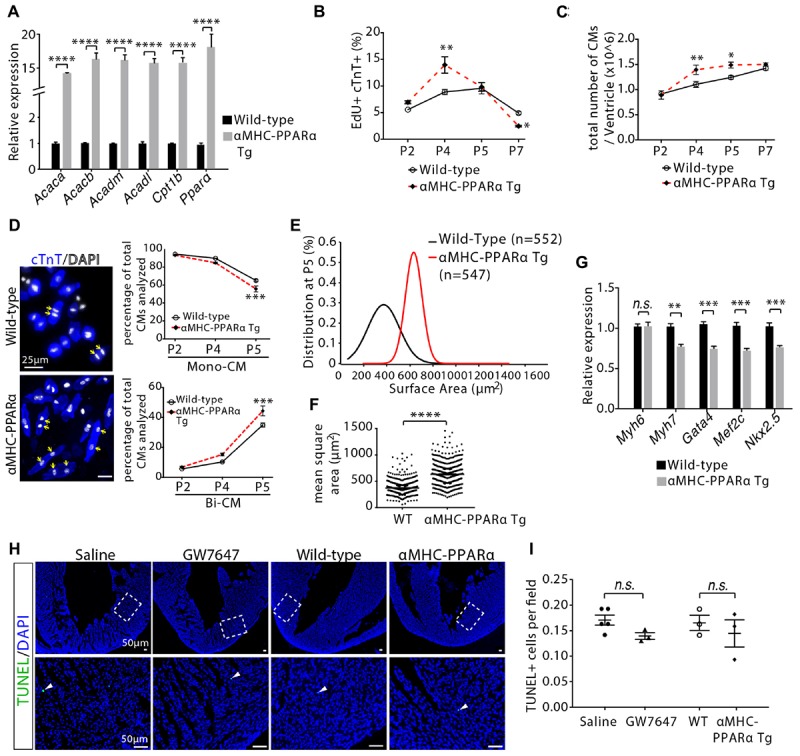
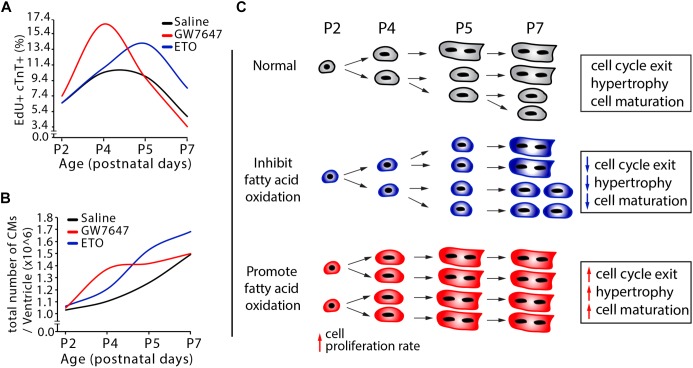
Cardiomyocyte proliferation accounts for the increase of cardiac muscle during fetal mammalian heart development. Shortly after birth, cardiomyocyte transits from hyperplasia to hypertrophic growth. Here, we have investigated the role of fatty acid β-oxidation in cardiomyocyte proliferation and hypertrophic growth during early postnatal life in mice. A transient wave of increased cell cycle activity of cardiomyocyte was observed between postnatal day 3 and 5, that proceeded as cardiomyocyte hypertrophic growth and maturation. Assessment of cardiomyocyte metabolism in neonatal mouse heart revealed a myocardial metabolic shift from glycolysis to fatty acid β-oxidation that coincided with the burst of cardiomyocyte cell cycle reactivation and hypertrophic growth. Inhibition of fatty acid β-oxidation metabolism in infant mouse heart delayed cardiomyocyte cell cycle exit, hypertrophic growth and maturation. By contrast, pharmacologic and genetic activation of PPARα, a major regulator of cardiac fatty acid metabolism, induced fatty acid β-oxidation and initially promoted cardiomyocyte proliferation rate in infant mice. As the cell cycle proceeded, activation of PPARα-mediated fatty acid β-oxidation promoted cardiomyocytes hypertrophic growth and maturation, which led to cell cycle exit. As a consequence, activation of PPARα-mediated fatty acid β-oxidation did not alter the total number of cardiomyocytes in infant mice. These findings indicate a unique role of fatty acid β-oxidation in regulating cardiomyocyte proliferation and hypertrophic growth in infant mice.

Keywords: cardiomyocyte; fatty acid oxidation; hypertrophic growth; infant mice; proliferation.


Figures

Figure 1
Figure 1
Cardiomyocyte cycling and metabolic profiling in infant mouse cardiomyocytes. (A) Isolated cardiomyocytes in DNA synthesis-phase were visualized by immunofluorescent microscopy using Click-iT EdU Alexa Fluor (red) and co-immunostaining with antibody against cardiac troponin T (cTnT, green). Arrows point to EdU+cTnT+ cells. Arrowheads point to binuclear cTnT+ cells. (B) Quantification of EdU+cTnT+ cells as percentage of total cTnT+ cells (∼1200 cTnT+ cells per sample). (C) Confocal images cardiomyocytes in mitotic phase as detected by co-immunostainings for phosphorylated histone H3 (PH3, red) and cTnT (green) on tissue sections, and quantification of PH3+cTnT+ cells as percentage of total cTnT+ cells analyzed per field. Arrows point to PH3+cTnT+ cells. (D–G) Isolated mouse cardiomyocytes from postnatal day 2 (P2), P5 and P7 heart ventricles were assessed with the Seahorse XF Analyzer. (D) Measurement and (E) quantification of mitochondrial oxygen consumption rate (OCR) with fatty acid stress test using palmitate versus BSA control. (F) Measurement and (G) quantification of extracellular acidification rate (ECAR) in the glycolysis stress assay. 2-DG (2-deoxyglucose) is a hexokinase inhibitor, which inhibits glycolytic pathway. P value was calculated using one-way ANOVA.
Figure 2
Figure 2
Effects of etomoxir (ETO) and GW7647 treatment on cardiomyocyte metabolism. (A) Isolated neonatal mouse cardiomyocytes (P1) were cultured with medium containing ETO (5 μM) for 48 h. ECAR was measured in cardiomyocytes using the Seahorse XF Analyzer. (B) Cardiomyocyte proliferation were visualized by co-immunostaining for Ki67 (red) and cTnT (green) on cultured cardiomyocytes, and quantification of Ki67+cTnT+ as percentage of total cTnT+ cells analyzed. Arrows point to Ki67+cTnT+ cells. (C) Cardiomyocytes in cytokinesis were visualized by co-immunostaining for Aurora B kinase (Auk, green) and cTnI (red) on cultured cardiomyocytes, and quantification of Auk+cTnI+ as percentage of total cTnI+ cells analyzed. (D) Schematic of experimental design for experiments performed in panels (E–I). Infant mice were treated either with ETO or GW7647 or saline at P2, P3, and P4. Cardiomyocytes were isolated at P5 and processed for Seahorse analysis or gene expression analysis. (E,F) OCR was measured (E) and quantified in response to palmitate or BSA challenge (F). (G) Expression of indicated genes by qRT-PCR analysis of the mRNA of isolated heart ventricles at P5 (n = 4–6 per group). (H,I) OCR was measured in isolated cardiomyocytes at P5 (H) and quantified in response to glucose challenge (I). P value was calculated using Student’s t-test (A–C, G) and one-way ANOVA (F, I).
Figure 3
Figure 3
Cardiomyocyte proliferation with etomoxir (ETO) treatment. (A) Cardiomyocytes in DNA synthesis-phase were detected by using Click-iT EdU Alexa Fluor (red) and co-immunostaining with antibody against cTnT (green) on tissue cross sections. Quantification of EdU+cTnT+ cells as percentage of total cTnT+ cells analyzed per field. Arrows point to EdU+cTnT+ cells. (B) Cardiomyocytes in mitotic phase were detected and quantified by immunostaining for PH3 (red) and cTnT (green) on tissue longitudinal sections. Arrows point to PH3+cTnT+ cells. (C) Cardiomyocyte proliferation were visualized by co-immunostaining of heart sections (P5) for Ki67 (red) and cTnT (green). Graph on the right showing quantification of Ki67+cTnT+ as percentage of total cTnT+ cells analyzed per field. Arrows point to Ki67+cTnT+ cells. (D) Percentage of mononuclear (Mono-CM) and binuclear (Bi-CM) cardiomyocytes in the heart ventricles of infant mice at P5. (E) Total number of cardiomyocytes in heart ventricles in infant mice at P5. (F) Immunostaining and quantification of TUNEL (green) and DAPI (blue) in P5 heart sections. Arrows point to TUNEL+ nuclei. (G) Expression of Bax and Bcl2 by qRT-PCR analysis of the mRNA of isolated heart ventricles at P5 (n = 4 per group). P value was calculated using Student’s t-test (A–C, E–G) and two-way ANOVA (D).
Figure 4
Figure 4
Cardiomyocyte size growth and maturation with etomoxir (ETO) treatment. (A) Schematic of experimental design for experiments performed in panels (B–E). (B) Isolated cardiomyocytes in DNA synthesis-phase were visualized by immunofluorescent microscopy using Click-iT EdU Alexa Fluor (red) and co-immunostaining with antibody against cTnT (green). Arrowheads point to EdU+cTnT+ cells. Quantification of EdU+cTnT+ cells as percentage of total cTnT+ cells (∼940 cTnT+ cells per sample). Scale bars: 50 μm. (C) The percentage of mononucleated EdU+ cardiomyocytes (Mono-CM) and binucleated EdU+ cardiomyocytes (Bi-CM) at P7. Arrowheads point to mononuclear EdU+cTnT+ cells. Arrows point to binuclear EdU+cTnT+ cells. Scale bar: 25 μm. (D) Percentage of mononuclear (Mono-CM) and binuclear (Bi-CM) cardiomyocytes in the heart ventricles of infant mice at P7. (E) The frequency distribution and mean square areas of the surface area of cardiomyocytes isolated from P7 mouse heart ventricles. (F) Expression of indicated genes by qRT-PCR analysis of the mRNA of isolated heart ventricles at P5 (n = 5 per group). (G) Schematic of experimental design for experiments performed in panels (H–M). (H) Quantification of gene expression by qRT-PCR analysis of the mRNA of isolated heart ventricles at P21 (n = 4 per group). (I) Cardiac function in mice evaluated by echocardiography at P21 (n = 4 per group). EF, ejection fraction; FS, fractional shortening; EDV, end-diastolic volume; ESV, end-systolic volume. (J) Heart weight-to-body weight ratios at P21. (K) The frequency distribution and mean square areas of isolated ventricular cardiomyocytes at P21. (L) Quantification of EdU+cTnT+ and PH3+cTnT+ as percentage of total cTnT+ cells analyzed on heart sections at P21. (M) Percentage of mononuclear (Mono-CM), binuclear (Bi-CM) and multinuclear (Multi-CM) cardiomyocytes in the heart ventricles of adult mice at P21. P value was calculated using Student’s t-test.
Figure 5
Figure 5
Cardiomyocyte proliferation and hypertrophic growth in GW7647-treated infant mouse hearts. (A) Infant mice were treated either with GW7647 or saline at P2, P3 and P4. Quantification of genes associated with fatty acid metabolism by qRT-PCR analysis of the mRNA of isolated heart ventricles at P5 (n = 4 per group). (B) Quantification of EdU+cTnT+ cells as percentage of total cTnT+ cells isolated from heart ventricles at indicated time points (n = 6 per group, ∼1000 cTnT+ cells per sample). (C) Quantification of total number of cardiomyocyte isolated from heart ventricles at indicated time points (n = 4–8 per group). (D) Representative images of isolated cardiomyocytes from P5 heart ventricles and quantification of the percentage of mononucleated (Mono-CM) and binucleated (Bi-CM) cardiomyocytes (n = 4–6 per group, ∼1000 cTnT+ cells per sample). Arrows point to Bi-CM. cTnT (blue). DAPI (gray). (E,F) Ventricular cardiomyocytes were isolated at P5 and measured for surface area. Quantitative analyses represent frequency distribution (E) and mean square areas (F) of the surface area of cardiomyocytes. (G) Quantification of genes associated with cardiomyocyte maturation by qRT-PCR analysis of the mRNA of isolated heart ventricles at P5 (n = 4–5 per group). P value was calculated using Student’s t-test (A, F,G), one-way ANOVA (D) and two-way ANOVA (B,C).
Figure 6
Figure 6
Cardiomyocyte proliferation and hypertrophic growth in αMHC-PPARα transgenic (Tg) hearts. (A) Quantification of genes associated with fatty acid metabolism by qRT-PCR analysis of the mRNA of isolated heart ventricles at P5 (n = 4 per group). (B) Quantification of EdU+cTnT+ cells as percentage of total cTnT+ cells isolated from heart ventricles at indicated time points (n = 6 per group, ∼1000 cTnT+ cells per sample). (C) Quantification of total number of cardiomyocyte isolated from heart ventricles at indicated time points (n = 4–9 per group). (D) Representative images of isolated cardiomyocytes from P5 heart ventricles and quantification of the percentage of mononucleated (Mono-CM) and binucleated (Bi-CM) cardiomyocytes (n = 4–6 per group, ∼1000 cTnT+ cells per sample). Arrows point to Bi-CM. cTnT (blue). DAPI (gray). (E,F) The frequency distribution (E) and mean square areas (F) of the surface area of cardiomyocytes isolated from αMHC-PPARα transgenic and wild-type (WT) heart ventricles at P5. (G) Quantification of genes associated with cardiomyocyte maturation by qRT-PCR analysis of the mRNA of isolated heart ventricles at P5 (n = 4–5 per group). (H,I) Immunostaining (H) and quantification (I) of TUNEL (green) and DAPI (blue) in P5 heart sections. The images in the second row are the enlargement of the bracketed regions shown in the top row. P value was calculated using Student’s t-test (A,F,G,I) and one-way ANOVA (B–D).
Figure 7
Figure 7
Effects of fatty acid oxidation on cardiomyocyte proliferation in infant mice. (A,B) Quantification of postnatal cardiomyocyte DNA synthesis and cell number expansion in mice with either GW7647, ETO or saline treatment. (C) The graphs depict the changes in cardiomyocyte proliferation, hypertrophic growth and maturation based on data obtained by DNA synthesis and cell counting analysis (Figure 3D–E, 5B–G).

References

    1. Ahuja P., Sdek P., Maclellan W. R. (2007). Cardiac myocyte cell cycle control in development, disease, and regeneration. Physiol. Rev. 87 521–544. 10.1152/physrev.00032.2006 - DOI - PMC - PubMed
    1. Assmann N., Finlay D. K. (2016). Metabolic regulation of immune responses: therapeutic opportunities. J. Clin. Invest. 126 2031–2039. 10.1172/JCI83005 - DOI - PMC - PubMed
    1. Buchakjian M. R., Kornbluth S. (2010). The engine driving the ship?: metabolic steering of cell proliferation and death. Nat. Rev. Mol. Cell Biol. 11 715–727. 10.1038/nrm2972 - DOI - PubMed
    1. Cai L., Sutter B. M., Li B., Tu B. P. (2011). Acetyl-CoA induces cell growth and proliferation by promoting the acetylation of histones at growth genes. Mol. Cell 42 426–437. 10.1016/j.molcel.2011.05.004 - DOI - PMC - PubMed
    1. Chen X., Wilson R. M., Kubo H., Berretta R. M., Harris D. M., Zhang X., et al. (2007). Adolescent feline heart contains a population of small proliferative ventricular myocytes with immature physiological properties. Circ. Res. 100 536–544. 10.1161/01.RES.0000259560.39234.99 - DOI - PubMed