. 2019 Sep 1;36(9):2040-2052.
doi: 10.1093/molbev/msz081.

Robust Estimation of Recent Effective Population Size from Number of Independent Origins in Soft Sweeps

Affiliations

Robust Estimation of Recent Effective Population Size from Number of Independent Origins in Soft Sweeps

Bhavin S Khatri et al. Mol Biol Evol. .

Abstract

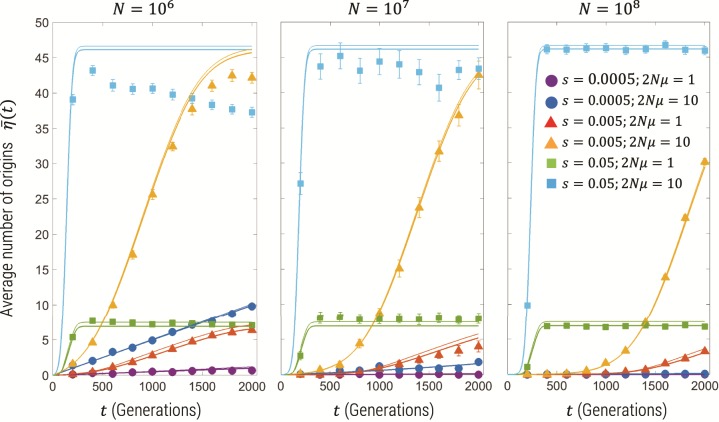
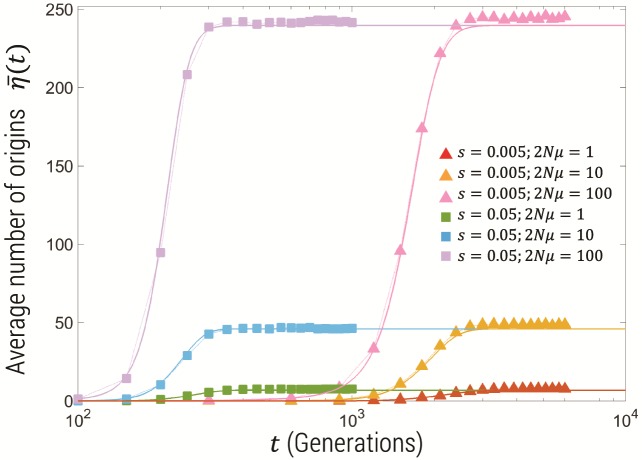
Estimating recent effective population size is of great importance in characterizing and predicting the evolution of natural populations. Methods based on nucleotide diversity may underestimate current day effective population sizes due to historical bottlenecks, whereas methods that reconstruct demographic history typically only detect long-term variations. However, soft selective sweeps, which leave a fingerprint of mutational history by recurrent mutations on independent haplotype backgrounds, holds promise of an estimate more representative of recent population history. Here, we present a simple and robust method of estimation based only on knowledge of the number of independent recurrent origins and the current frequency of the beneficial allele in a population sample, independent of the strength of selection and age of the mutation. Using a forward-time theoretical framework, we show the mean number of origins is a function of θ=2Nμ and current allele frequency, through a simple equation, and the distribution is approximately Poisson. This estimate is robust to whether mutants preexisted before selection arose and is equally accurate for diploid populations with incomplete dominance. For fast (e.g., seasonal) demographic changes compared with time scale for fixation of the mutant allele, and for moderate peak-to-trough ratios, we show our constant population size estimate can be used to bound the maximum and minimum population size. Applied to the Vgsc gene of Anopheles gambiae, we estimate an effective population size of roughly 6×10⁷, and including seasonal demographic oscillations, a minimum effective population size >3×10⁷, and a maximum <6×10⁹, suggesting a mean ∼109.

Keywords: Anopheles; demographic oscillations; effective population size; recurrent mutation; soft sweeps.


Figures

<sc>Fig</sc>. 1.
Fig. 1.
Time series of the frequency of each independent origin of the same recurrent mutant (range of different colors). (A) N=106,2Nμ=1, and s =0.05, (B) same as (A), but with 2Nμ=10. Solid black line is the sum of all mutant frequencies (x(t)=kxk(t)), dashed black line the frequency of the wild type (1x(t)), and the solid red line is the deterministic time-course given by equation (3).
<sc>Fig</sc>. 2.
Fig. 2.
Average number of origins for population sizes of N=106,N=107, and N=108. The filled symbols show the simulation results and standard error bars for the parameter combinations shown in the legend; for N=106 and N=107, the simulations used multinomial sampling of the Wright–Fisher drift process with 50 and 10 replicates, respectively, for each parameter combination, whereas for N=108, the multinomial sampling is replaced by the multivariate Gaussian distribution approximation of the drift process (see the Methods section above), where 100 replicates are used in this plot. The solid thick lines are the predictions for the same parameter combination of the semideterministic theory described in this article (Methods), whereas the thin lines represent the prediction of Pennings and Hermisson (2006a), based on Ewens’ sampling theory (Ewens 2010).
<sc>Fig</sc>. 3.
Fig. 3.
Average number of origins for population size of N=108 on linear-log scale, for 2Nμ={1,10,100} and s={0.05,0.005} showing that plateau number of origins is independent of s. The filled symbols show the simulation results and standard error bars for the parameter combinations shown in the legend. The solid thick lines are the predictions for the same parameter combination of the semideterministic theory described in this article (Methods).
<sc>Fig</sc>. 4.
Fig. 4.
Distribution of the number of origins for simulations with various mutation rates for N=108 and s =0.05 (open circles) compared with theory in this article equation (12) and (7) (solid lines) and Ewens’ sampling formula (dotted lines), both with ns = 1,000. For the mutation rates 2Nμ={0.1,1,10}, the corresponding typical fixation time (eq. 5) is t*{370,320,280} generations.
<sc>Fig</sc>. 5.
Fig. 5.
log10-error in estimating the true effective population size, for (A) haploid populations with N=108, (B) diploid populations with N=5×10⁷, for various selection coefficients, mutation rates, and dominance coefficients (diploid only) from Wright–Fisher simulations (100 replicates for each parameter combination). (A) We use equations (12) and (7) to determine the maximum likelihood estimate. (B) For the diploid population, we use the same Poisson likelihood function, but with mean given by equations (13) and (14) in the Supplementary Information, where we assume perfect knowledge of T (squares) and also compare to the case where we have a systematic error in our knowledge of T, where the true time is T/2 instead T (circles), and we see the estimates are unchanged. In addition, for the diploid population we use the haploid likelihood function (eqs. 13 and 7) with θ=4Nμ to estimate N (plus signs) and find again excellent agreement.
<sc>Fig</sc>. 6.
Fig. 6.
Mean number of origins for haploid simulations with preexisting mutations (A), where the black hexagram symbols represent simulations without preexisting simulations, and (B) log10-error in maximum likelihood estimate of the true effective population size N=108 from Wright–Fisher simulations with various values of the deleterious selection coefficient sd (100 replicates for each parameter combination).
<sc>Fig</sc>. 7.
Fig. 7.
Likelihood (normalized) of the number of origins as function of effective population size given an observed number η  =  10 and samples size ns = 1,530 chromosomes, corresponding to that found for the Ag1000 project (Anopheles gambiae 1000 Genomes Consortium 2017) for the Vgsc resistance locus. As shown in the legend, the semideterministic theory in this article, assuming a current day frequency of x =0.78 (as observed) is compared with assuming x =1 and the Ewens’ sampling theory equation (14), which only has applicability for x =1. The 95% confidence intervals (gray dotted lines) and maximum likelihood effective population size (red dotted line) are shown for the semideterministic likelihood function with x =0.78.
<sc>Fig</sc>. 8.
Fig. 8.
The mean number of origins from Wright–Fisher simulations (1,000 replicates) for oscillating population size with period ΔT=12 generations, selection coefficient s =0.05, 2Nμ=1, and with the geometric mean (green) and harmonic mean (purple) of Nmax and Nmin constrained to NmaxNmin=2(1/Nmax+1/Nmin)1=N=108, for different peak-to-trough ratios. Black squares represent constant population size simulations.

References

    1. Anderson TJ, Nair S, McDew-White M, Cheeseman IH, Nkhoma S, Bilgic F, McGready R, Ashley E, Phyo AP, White NJ, et al. 2017. Population parameters underlying an ongoing soft sweep in Southeast Asian malaria parasites. Mol Biol Evol. 341:131–144. - PMC - PubMed
    1. Anopheles gambiae 1000 Genomes Consortium. 2017. Genetic diversity of the African malaria vector Anopheles gambiae. Nature 5527683:96.. - PMC - PubMed
    1. Athrey G, Hodges TK, Reddy MR, Overgaard HJ, Matias A, Ridl FC, Kleinschmidt I, Caccone A, Slotman MA.. 2012. The effective population size of malaria mosquitoes: large impact of vector control. PLoS Genet. 812:e1003097.. - PMC - PubMed
    1. Bollback JP, York TL, Nielsen R.. 2008. Estimation of 2nes from temporal allele frequency data. Genetics 1791:497–502. - PMC - PubMed
    1. Bomblies A, Duchemin J-B, Eltahir EA.. 2009. A mechanistic approach for accurate simulation of village scale malaria transmission. Malaria J. 81:223. - PMC - PubMed

Publication types