. 2019 Oct;56(10):7003-7021.
doi: 10.1007/s12035-019-1577-3. Epub 2019 Apr 9.

Alterations in Striatal microRNA-mRNA Networks Contribute to Neuroinflammation in Multiple System Atrophy

Affiliations

Alterations in Striatal microRNA-mRNA Networks Contribute to Neuroinflammation in Multiple System Atrophy

Taeyeon Kim et al. Mol Neurobiol. 2019 Oct.

Abstract

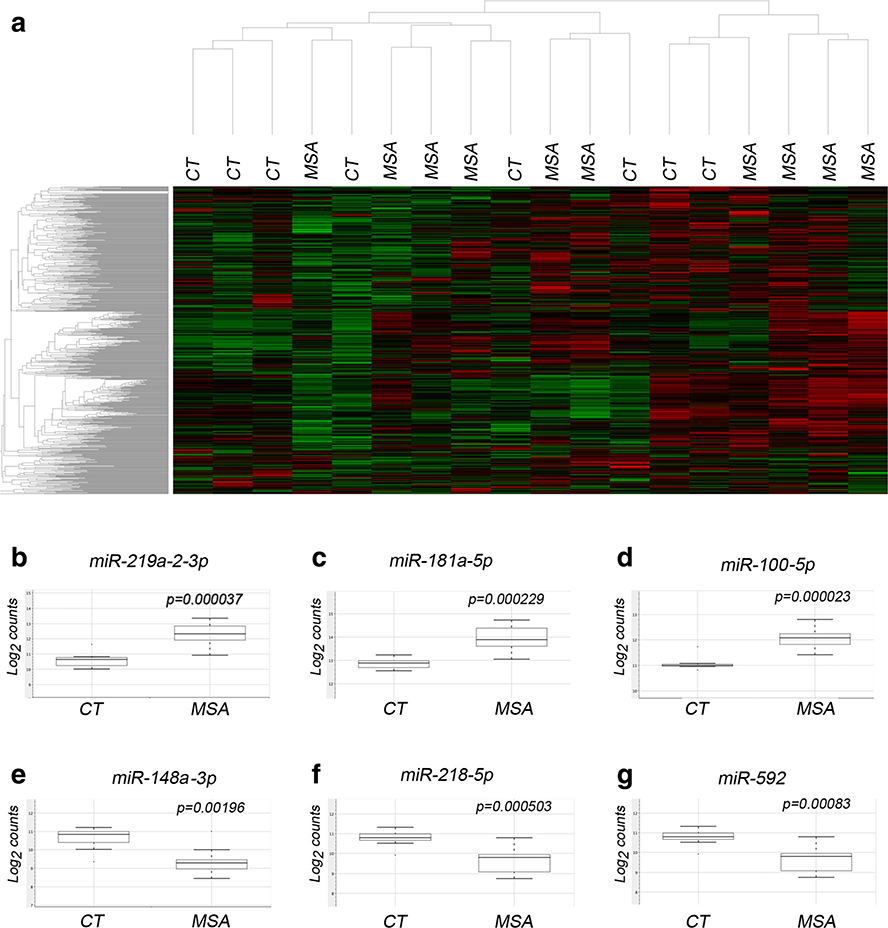
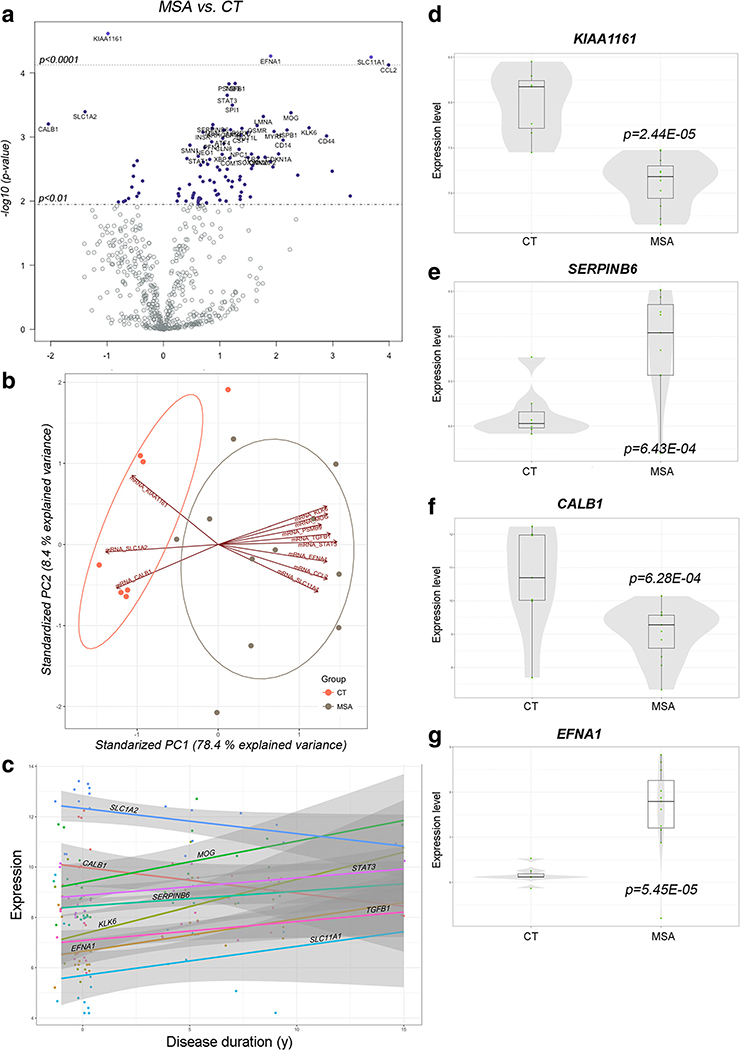
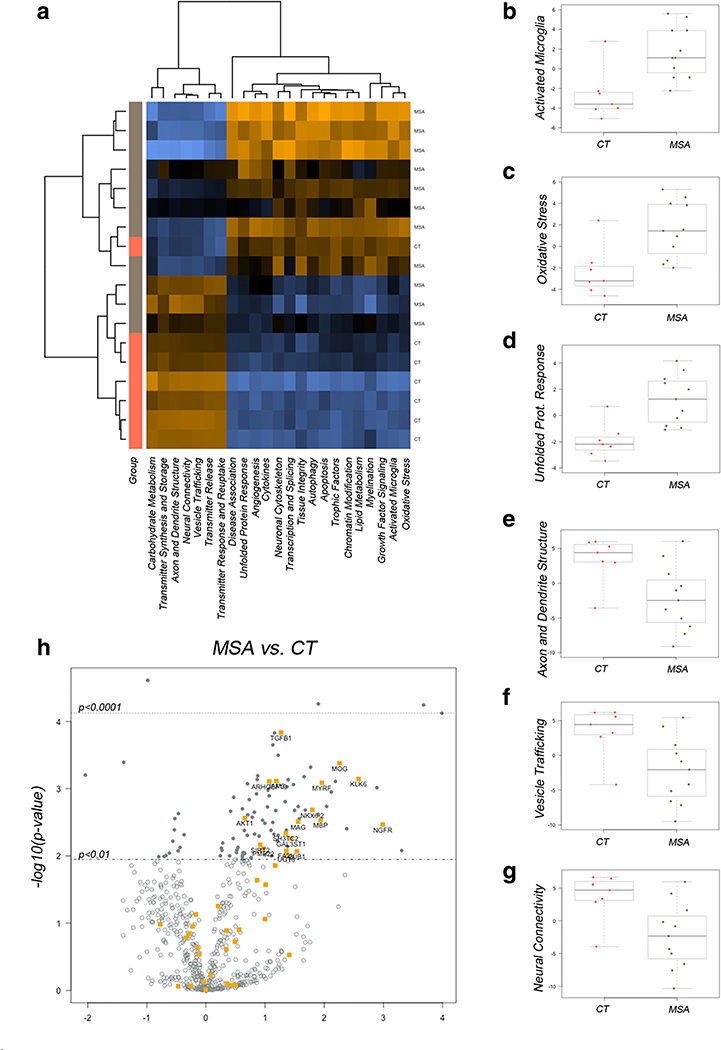
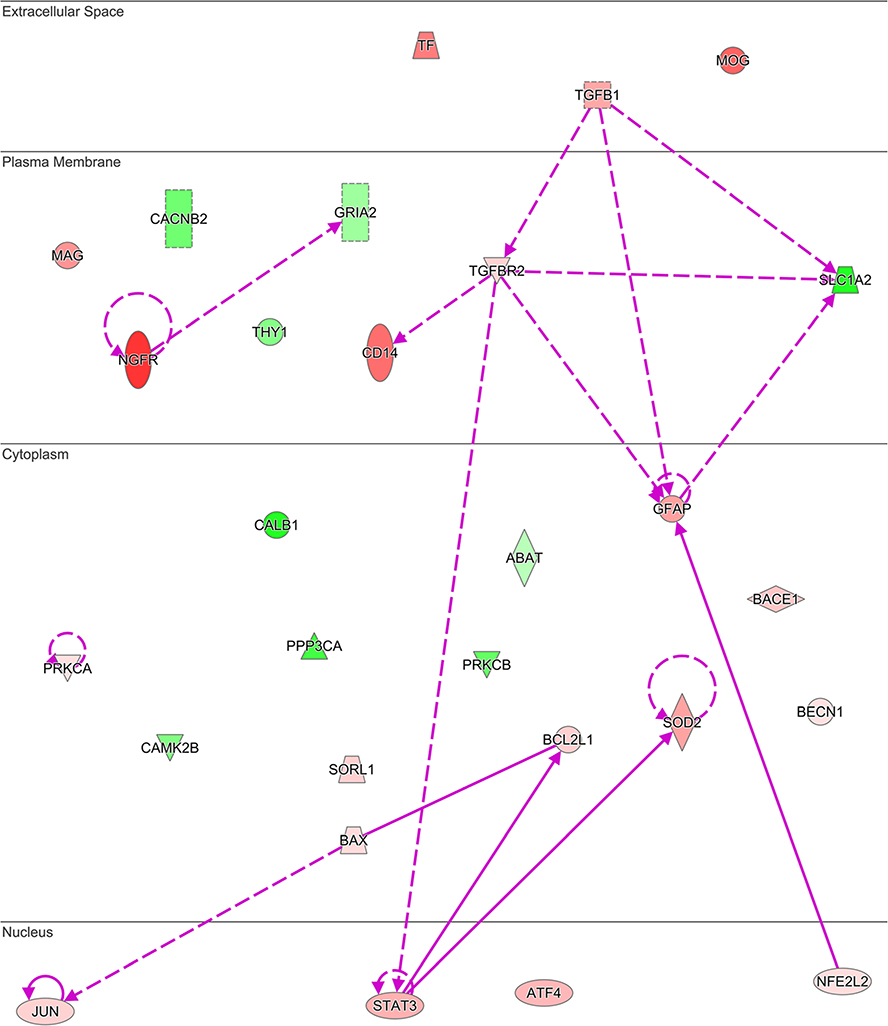
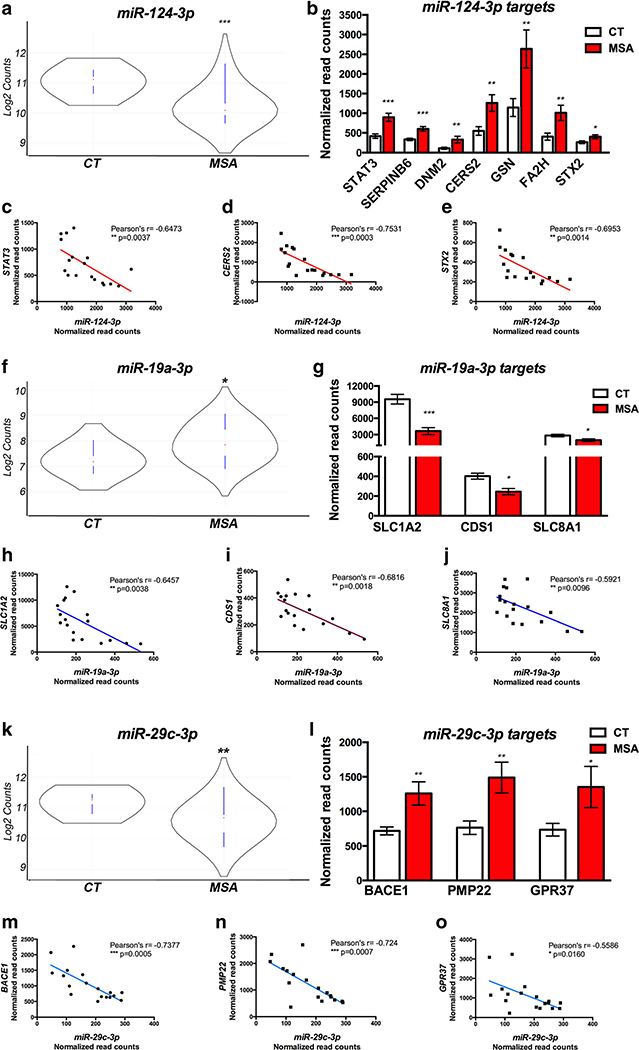
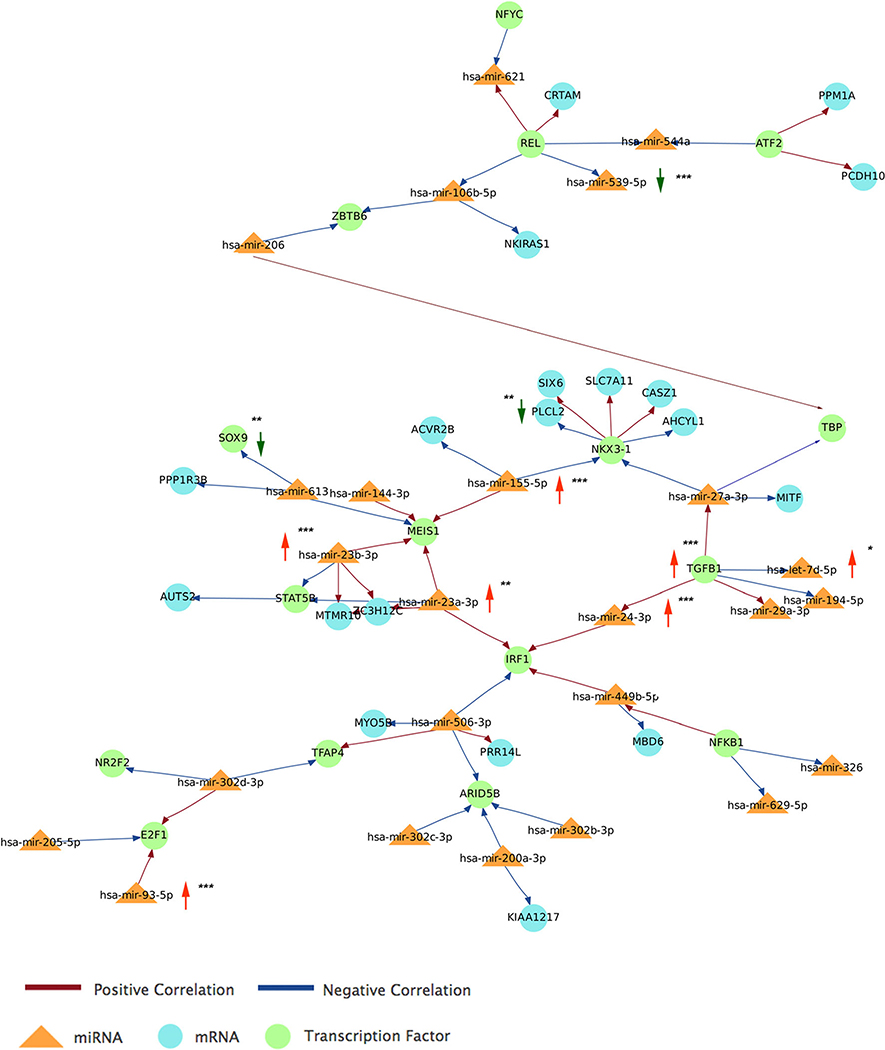
Multiple systems atrophy (MSA) is a rare neurodegenerative disorder characterized by the accumulation of α-synuclein in glial cells and neurodegeneration in the striatum, substantia nigra, and cerebellum. Aberrant miRNA regulation has been associated with neurodegeneration, including alterations of specific miRNAs in brain tissue, serum, and cerebrospinal fluid from MSA patients. Still, a causal link between deregulation of miRNA networks and pathological changes in the transcriptome remains elusive. We profiled ~ 800 miRNAs in the striatum of MSA patients in comparison to healthy individuals to identify specific miRNAs altered in MSA. In addition, we performed a parallel screening of 700 transcripts associated with neurodegeneration to determine the impact of miRNA deregulation on the transcriptome. We identified 60 miRNAs with abnormal levels in MSA brains that are involved in extracellular matrix receptor interactions, prion disease, inflammation, ubiquitin-mediated proteolysis, and addiction pathways. Using the correlation between miRNA expression and the abundance of their known targets, miR-124-3p, miR-19a-3p, miR-27b-3p, and miR-29c-3p were identified as key regulators altered in MSA, mainly contributing to neuroinflammation. Finally, our study also uncovered a potential link between Alzheimer's disease (AD) and MSA pathologies that involves miRNAs and deregulation of BACE1. Our results provide a comprehensive appraisal of miRNA alterations in MSA and their effect on the striatal transcriptome, supporting that aberrant miRNA expression is highly correlated with changes in gene transcription associated with MSA neuropathology, in particular those driving inflammation, disrupting myelination, and potentially impacting α-synuclein accumulation via deregulation of autophagy and prion mechanisms.

Keywords: Alpha-synuclein; Inflammation; Multiple systems atrophy; Neurodegeneration; Transcription; microRNA.


Figures

Fig. 1
Fig. 1
Alterations in miRNA expression in the striatum of MSA cases. a Heat map representing the agglomerative clustering of raw miRNA abundance data plotting average Euclidean distance. Representative box plots of top upregulated (b-d) or downregulated (e-g) miRNAs in MSA showing non-parametric analysis of normalized data displaying data range and quartiles, P value as per t test
Fig. 2
Fig. 2
Differential expression of genes involved in neurodegeneration in the MSA striatum. a Volcano plot displaying genes differentially transcribed in MSA with high statistical significance. Labels for the 40 top genes are indicated in the plot. b Principal component analysis biplot including the 15 most significant differentially expressed genes. Projections in opposite directions in PC1 indicate high-degree contribution of the indicated genes in clustering. c Trend plot for visualization of changes in expression as a function of disease progression. Color lines indicate trajectory. Transcription showing higher degree of change is labeled in the graph. d-g Univariate plots showing expression of select genes. Box plots depict median and second quartile of expression. Overlying violin plots (gray) show log2 expression quartiles and the estimated distribution of expression levels. P values indicated as per Student t test
Fig. 3
Fig. 3
Gene set analysis identifies MSA-associated pathways in the striatum. a Heat map showing distribution of scores summarizing the data from all pathways’ genes into a single score and clustering across disease groups. Orange indicates high and blue indicates low scores respectively. Box plots showing median scores with quartile ranges in MSA and CT samples for selected pathways associated with inflammation and cell death (b-d) and neuronal physiology (e-g). h Volcano plot displaying genes differentially transcribed in MSA with high statistical significance and involved in myelination. Labels for the top genes are indicated in the plot
Fig. 4
Fig. 4
Genes with altered expression in MSA striatum overlap networks associated with Alzheimer’s disease neuropathology. Network built using 29 genes showing differential transcription in MSA that were associated to AD in the disease enrichment analysis module of IPA. Red shades indicate increased and green shades indicate decreased expression in the data with intensity of shading representing fold change magnitude. Solid lines denote direct and dash lines indicate indirect interactions between gene products. Arrowheads denote reaction direction
Fig. 5
Fig. 5
Correlation between altered miRNAs and gene targets in MSA ► striatum. a, f, k Violin plots showing abundance of selected miRNAs in CT and MSA brains. Red dot indicates median count and black curve indicates frequency of counts based on log2; blue lines indicate lower and upper values and extend over first and third quartiles. b, g, l Bar graphs showing transcript abundance for gene targets of miRNAs depicted in (a-f-k) that showed significant correlation in the paired analysis. c-e, h-j, m-o Plots showing top correlated miR-gene target pairs as per Pearson’s analysis. *P<0.05, **P<0.01, and ***P<0.001 as per t test in the group comparisons (MSA vs. CT) or per Pearson’s in the correlation miR-gene target expression
Fig. 6
Fig. 6
Generation of expanded networks linking miRNAs altered in MSA, transcription factors, and additional regulatory molecules. Main network obtained by integrative analysis of paired miRNAs and gene targets affected in MSA and expanded by Pearson’s correlation and TargetScan prediction tools in Magic2. Vertical arrows indicate miRNAs and transcripts altered in MSA brains (red = increased, green = decreased abundance). *P <0.05, **P < 0.01, and ***P <0.001 as per t test in the group comparisons (MSA vs. CT)

References

    1. Spillantini MG, Crowther RA, Jakes R, Cairns NJ, Lantos PL, Goedert M (1998) Filamentous alpha-synuclein inclusions link multiple system atrophy with Parkinson’s disease and dementia with Lewy bodies. Neurosci Lett 251(3):205–208 - PubMed
    1. Wakabayashi K, Hayashi S, Kakita A, Yamada M, Toyoshima Y, Yoshimoto M, Takahashi H (1998) Accumulation of alpha-synu- clein/NACP is a cytopathological feature common to Lewy body disease and multiple system atrophy. Acta Neuropathol 96(5):445–452 - PubMed
    1. Wakabayashi K, Yoshimoto M, Tsuji S, Takahashi H (1998) Alpha- synuclein immunoreactivity in glial cytoplasmic inclusions in multiple system atrophy. Neurosci Lett 249(2–3):180–182 - PubMed
    1. Gilman S, Wenning GK, Low PA, Brooks DJ, Mathias CJ, Trojanowski JQ, Wood NW, Colosimo C et al. (2008) Second consensus statement on the diagnosis of multiple system atrophy. Neurology 71(9):670–676 - PMC - PubMed
    1. Miki Y, Tanji K, Mori F, Utsumi J, Sasaki H, Kakita A, Takahashi H, Wakabayashi K (2016) Alteration of upstream autophagy- related proteins (ULK1, ULK2, Beclin1, VPS34 and AMBRA1) in Lewy body disease. Brain Pathol 26(3):359–370 - PMC - PubMed

LinkOut - more resources