

The influence of birth cohort and calendar period on global trends in ovarian cancer incidence
- PMID: 30968402
- PMCID: PMC6786921
- DOI: 10.1002/ijc.32322
The influence of birth cohort and calendar period on global trends in ovarian cancer incidence
Abstract
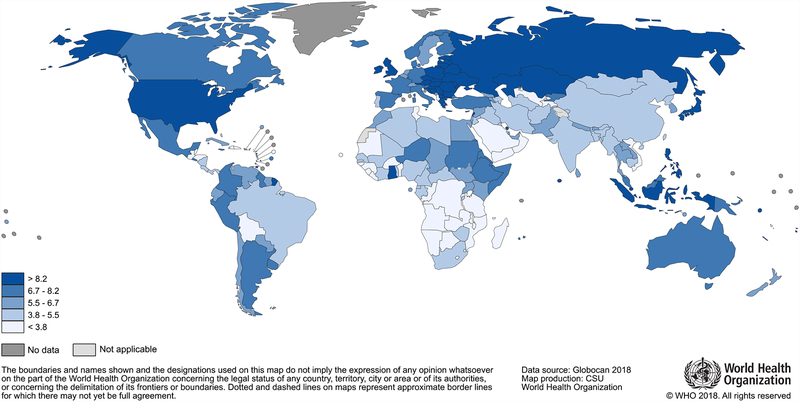
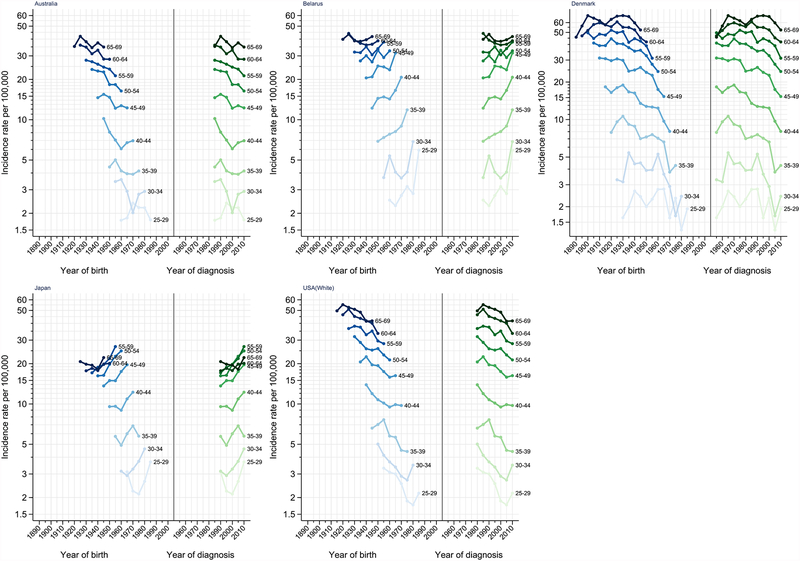
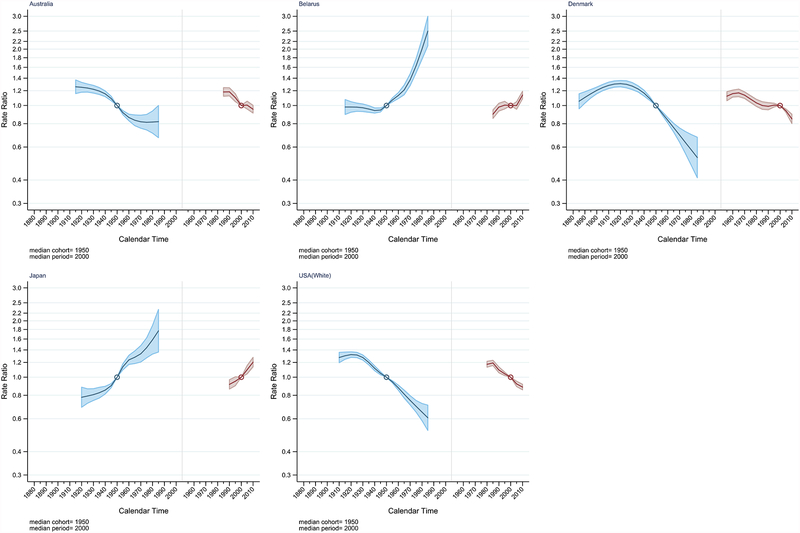
Ovarian cancer is the eighth most common cancer in women worldwide and incidence rates vary markedly by world region. Our study provides a comprehensive overview of ovarian cancer incidence trends globally, examining the influence of birth cohort and period of diagnosis on changing risk. We presented current patterns and trends of ovarian cancer incidence until 2012 using data from successive volumes of Cancer Incidence in Five Contents. The incidence of ovarian cancer is highest in northern and eastern European countries and in northern America. Declining trends were observed in most countries with the exception of a few central and eastern Asian countries. Marked declines were seen in Europe and North America for women aged 50-74 where rates have declined up to 2.4% (95% CI: -3.9, -0.9) annually in Denmark (DNK) over the last decade. Additionally, declines in the incidence rate ratio (IRR) were observed for generations born after the 1930s, with an additional strong period effect seen around 2000 in United States and DNK. In contrast, IRRs increased among younger generations born after the 1950s in Japan and Belarus. Overall, the favorable trends in ovarian cancer incidence is likely due to the increase use of oral contraceptive pills, and changes in the prevalence of other reproductive risk and protective factors for ovarian cancer over the years studied. Changes in disease classifications and cancer registry practices may also partially contribute to the variation in ovarian cancer incidence rates. Thus, continuous cancer surveillance is essential to detect the shifting patterns of ovarian cancer.
Keywords: age-period-cohort; global incidence trends; ovarian cancer.
© 2019 International Agency for Research on Cancer (IARC/WHO); licensed by UICC.
Conflict of interest statement
Figures


References
-
- Cancer Today, vol. 2018: International Agency for Research on Cancer.
-
- Ferlay J, Soerjomataram I, Dikshit R, Eser S, Mathers C, Rebelo M, Parkin DM, Forman D, Bray F. Cancer incidence and mortality worldwide: sources, methods and major patterns in GLOBOCAN 2012. Int J Cancer 2015;136: E359–86. - PubMed
-
- Webb PM, Green AC, Jordan SJ. Trends in hormone use and ovarian cancer incidence in US white and Australian women: implications for the future. Cancer Causes Control 2017;28: 365–70. - PubMed
Publication types
MeSH terms
Substances
Grants and funding
LinkOut - more resources
Full Text Sources
Medical
