. 2019 Sep;67(2):e12580.
doi: 10.1111/jpi.12580. Epub 2019 Apr 29.

Removing melatonin receptor type 1 signaling leads to selective leptin resistance in the arcuate nucleus

Affiliations

Removing melatonin receptor type 1 signaling leads to selective leptin resistance in the arcuate nucleus

Daniella Buonfiglio et al. J Pineal Res. 2019 Sep.

Abstract

Recent studies have highlighted the involvement of melatonin in the regulation of energy homeostasis. In this study, we report that mice lacking melatonin receptor 1 (MT1 KO) gained more weight, had a higher cumulative food intake, and were more hyperphagic after fasting compared to controls (WT). In response to a leptin injection, MT1 KO mice showed a diminished reduction in body weight and food intake. To evaluate hypothalamic leptin signaling, we tested leptin-induced phosphorylation of the signal transducer and activator of transcription 3 (STAT3). Leptin failed to induce STAT3 phosphorylation in MT1 KO mice beyond levels observed in mice injected with phosphate-buffered saline (PBS). Furthermore, STAT3 phosphorylation within the arcuate nucleus (ARH) was decreased in MT1 KO mice. Leptin receptor mRNA levels in the hypothalamus of MT1 KO were significantly reduced (about 50%) compared to WT. This study shows that: (a) MT1 deficiency causes weight gain and increased food intake; (b) a lack of MT1 signaling induces leptin resistance; (c) leptin resistance is ARH region-specific; and (d) leptin resistance is likely due to down-regulation of the leptin receptor. Our data demonstrate that MT1 signaling is an important modulator of leptin signaling.

Keywords: leptin receptor; leptin resistance; melatonin; melatonin receptor 1; metabolism; obesity.


Figures

Figure 1.
Figure 1.. MT1KO gain more body weight gain and have higher cumulative food intake.
(A) Body weight gain over the course of 5 weeks of monitoring (mice were 12 weeks old at the start of the experiment). Two-way ANOVA followed by the Sidak post-hoc test. (B) Final body weight after 5 weeks of monitoring. Unpaired t-test. (C) Daily food intake. One-way ANOVA followed by the Sidak post-hoc test. (D) Cumulative food intake over the course of 20 days of monitoring. Two-way ANOVA followed by the Sidak post-hoc test. Data are shown as mean ± SEM; n = 8.
Figure 2.
Figure 2.. No differences in adiposity and leptin levels in WT and MT1KO mice.
(A) Percentage of Adipose Tissue Pad: subcutaneous (SC), retroperitoneal (RP) and periepydidimal (PE). Fat mass was normalized to body weight. Two-way ANOVA followed by the Sidak post-hoc test. (B) Leptin serum level. Unpaired t-test. Data are shown as mean ± SEM; n = 8.
Figure 3.
Figure 3.. Removal of MT1 increases hyperphagia induced by fasting.
(A) Percentage of body weight loss over the course of a 12-h fasting test. (B) Food intake during the re-feeding period. Two-way repeated measures ANOVA followed by the Sidak post-hoc test. Data are shown as mean ± SEM; n = 8.
Figure 4.
Figure 4.. Removal of MT1 signaling influences acute leptin responsiveness test.
(A) Percentage of body weight gain 24 h after PBS or recombinant leptin injection (1.5 μg/g). (B) Food intake 24 h after PBS or recombinant leptin injection (1.5 μg/g). (C) Percentage of body weight gain 24 h after PBS or recombinant leptin injection (3 μg/g). (D) Food intake 24 h after PBS or recombinant leptin injection (3 μg/g). Two-way repeated measures ANOVA followed by the Sidak post-hoc test. n = 8. (E) Hypothalamic phosphorylation of STAT3 90 minutes after injection with PBS or leptin (1.5 μg/g), measured by Western Blot. Data were normalized by STAT3 and GAPDH amount. (F) Representative immunoblotting of pSTAT3, STAT3 and GAPDH protein content. Two-way ANOVA followed by the Sidak post-hoc test, n = 4. Data are shown as mean ± SEM.
Figure 5.
Figure 5.. Site-specific difference in leptin-induced phosphorylation of STAT3 in the hypothalamus of WT and MT1KO mice.
(A) Number of pSTAT3-immunoreactive cells in the ARH, DMH, VMH and PMv; *ARH WT vs. MT1KO group p < 0.05. (B–I) Photomicrographs of coronal sections illustrating leptin-induced pSTAT3-immunoreactivity (pSTAT3-ir) in WT (B, D, F and H) and MT1KO (C, E, G and I) mice in the ARH (B, C), DMH (D, E), VMH (F, G) and PMv (H, I). Scale bar = 100 μm. Abbreviations: 3v, third ventricle. Unpaired t-test. Data are shown as mean ± SEM; n =3.
Figure 6.
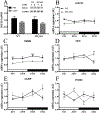
Figure 6.. Removal of MT1 signaling affects the transcription in the hypothalamus of genes controlling feeding behavior.
(A) Hypothalamic SOCS3 90 minutes after injection with PBS or leptin (1.5 μg/g), measured by Western Blot. Data were normalized by GAPDH amount. The upper insert shows representative immunoblotting of SOCS3 and GAPDH protein content. (B) mRNA levels of Socs3, Interaction, ZT and group factors p > 0.05; (C) mRNA levels of ObRb, Interaction p > 0.05, ZT factor p < 0.05 and group factor p < 0.001; (D) mRNA levels of Npy, Interaction p < 0.05, ZT and group factors p > 0.05; (E) mRNA levels of Agrp, Interaction p < 0.05, ZT and group factors p > 0.05 and (F) mRNA levels of Pomc, Interaction p < 0.05, ZT and group factors p > 0.05 in WT and MT1KO mice over 24 h. Data were normalized by the geometric mean of Rpl and Ppia. Two-way ANOVA followed by the Sidak post-hoc test. Data are shown as mean ± SEM; n = 4.

References

    1. CIPOLLA-NETO J, AMARAL FG, AFECHE SC et al. Melatonin, energy metabolism, and obesity: a review. Journal of pineal research 2014; 56:371–81. - PubMed
    1. JOCKERS R, DELAGRANGE P, DUBOCOVICH ML et al. Update on melatonin receptors: IUPHAR Review 20. British journal of pharmacology 2016; 173:2702–25. - PMC - PubMed
    1. REPPERT SM Melatonin receptors: molecular biology of a new family of G protein-coupled receptors. Journal of biological rhythms 1997; 12:528–31. - PubMed
    1. BONNEFOND A, CLEMENT N, FAWCETT K et al. Rare MTNR1B variants impairing melatonin receptor 1B function contribute to type 2 diabetes. Nature genetics 2012; 44:297–301. - PMC - PubMed
    1. LYSSENKO V, NAGORNY CL, ERDOS MR et al. Common variant in MTNR1B associated with increased risk of type 2 diabetes and impaired early insulin secretion. Nature genetics 2009; 41:82–8. - PMC - PubMed

Associated data