. 2019 Jun;31(23):e1807359.
doi: 10.1002/adma.201807359. Epub 2019 Apr 10.

Engineering an Artificial T-Cell Stimulating Matrix for Immunotherapy

Affiliations

Engineering an Artificial T-Cell Stimulating Matrix for Immunotherapy

John W Hickey et al. Adv Mater. 2019 Jun.

Abstract

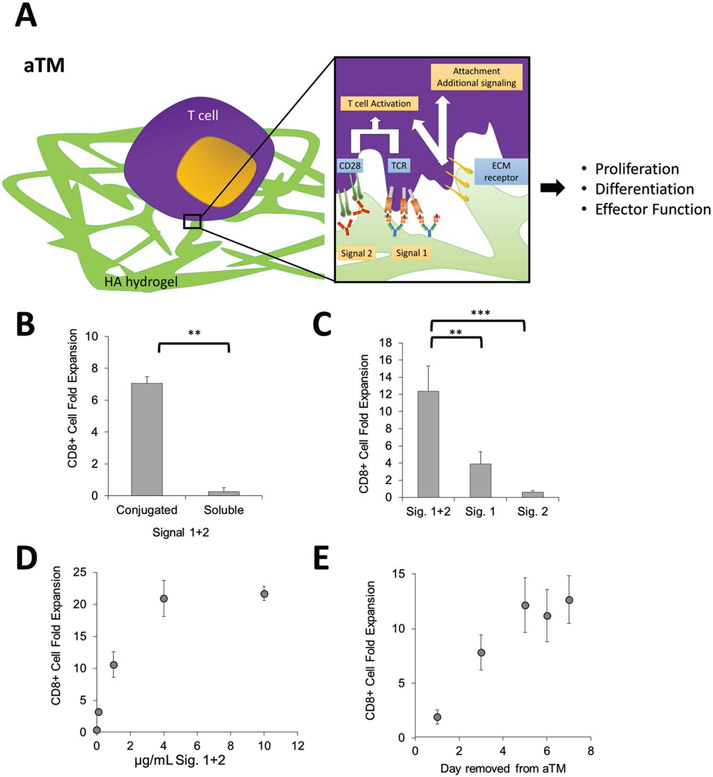
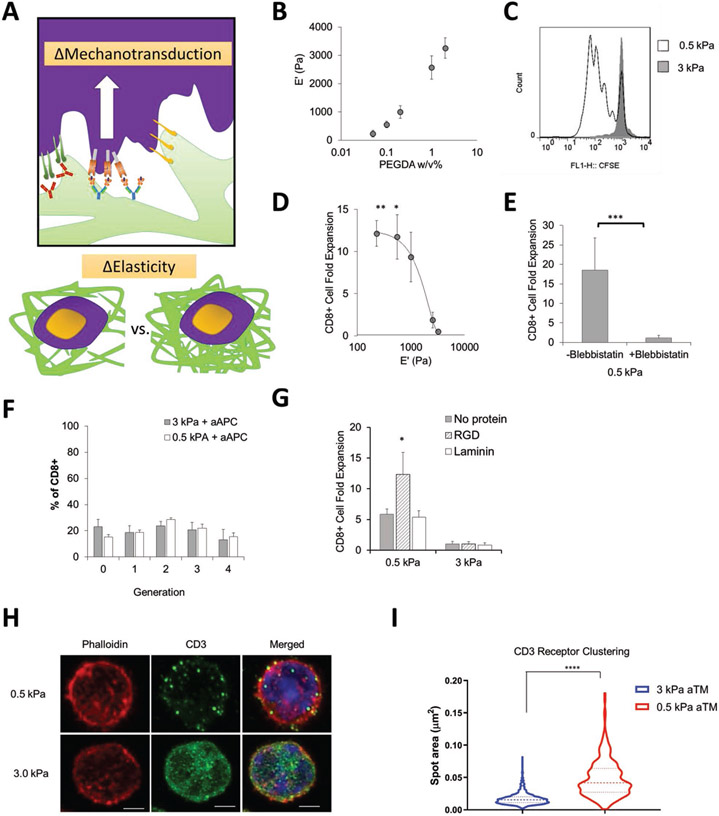
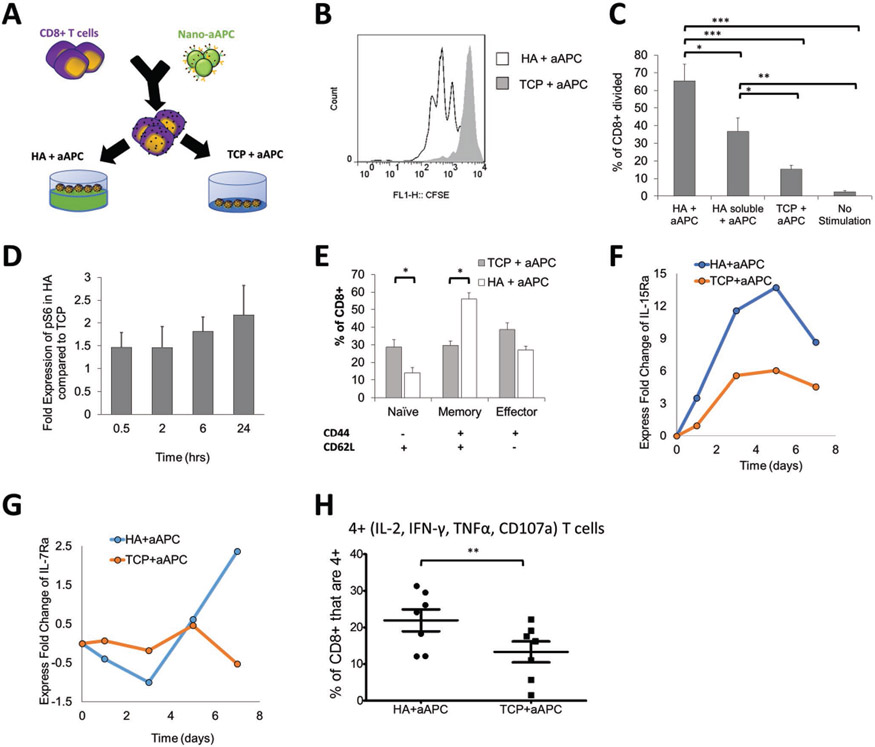
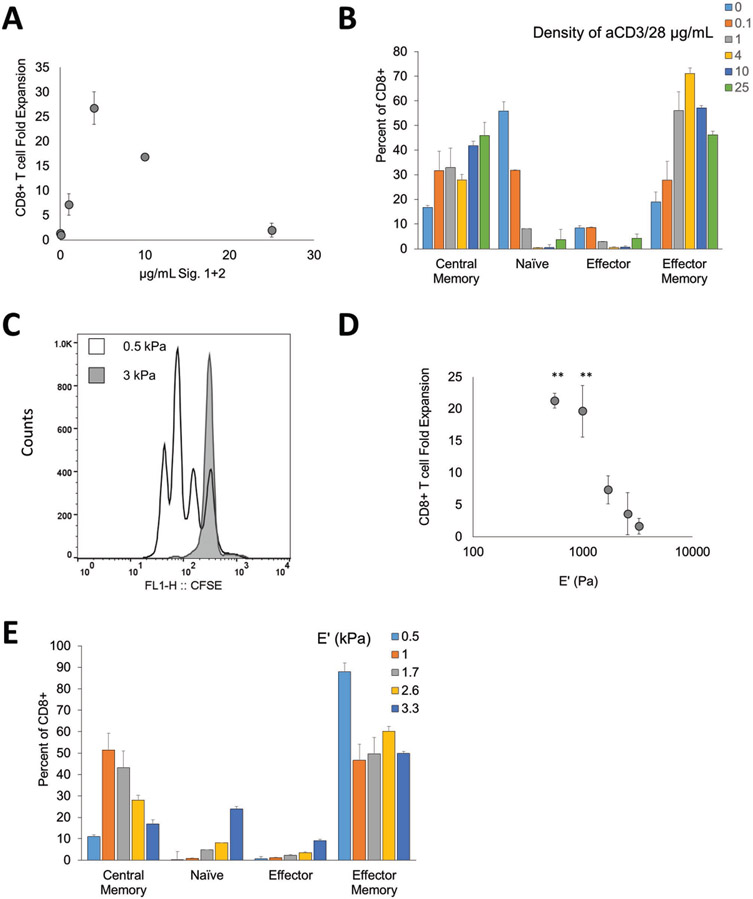
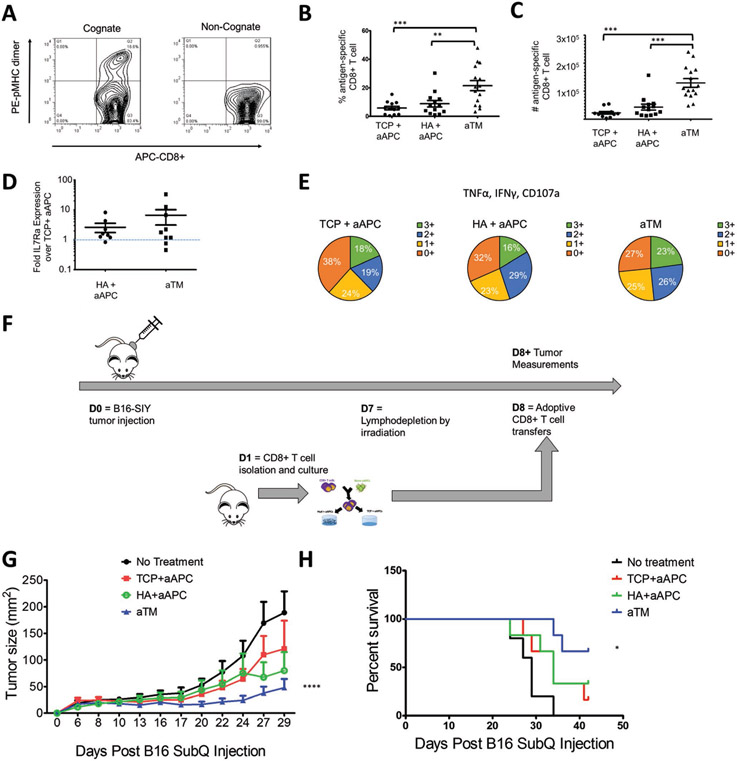
T cell therapies require the removal and culture of T cells ex vivo to expand several thousand-fold. However, these cells often lose the phenotype and cytotoxic functionality for mediating effective therapeutic responses. The extracellular matrix (ECM) has been used to preserve and augment cell phenotype; however, it has not been applied to cellular immunotherapies. Here, a hyaluronic acid (HA)-based hydrogel is engineered to present the two stimulatory signals required for T-cell activation-termed an artificial T-cell stimulating matrix (aTM). It is found that biophysical properties of the aTM-stimulatory ligand density, stiffness, and ECM proteins-potentiate T cell signaling and skew phenotype of both murine and human T cells. Importantly, the combination of the ECM environment and mechanically sensitive TCR signaling from the aTM results in a rapid and robust expansion of rare, antigen-specific CD8+ T cells. Adoptive transfer of these tumor-specific cells significantly suppresses tumor growth and improves animal survival compared with T cells stimulated by traditional methods. Beyond immediate immunotherapeutic applications, demonstrating the environment influences the cellular therapeutic product delineates the importance of the ECM and provides a case study of how to engineer ECM-mimetic materials for therapeutic immune stimulation in the future.

Keywords: T cell stimulation; adoptive T cell therapy; artificial matrix; extracellular matrix; hydrogel; immunotherapy; mechanotransduction.


Conflict of interest statement

Conflict of Interest

The authors declare no conflict of interest.

Figures

Figure 1.
Figure 1.
An artificial T cell stimulating matrix (aTM) is engineered by conjugating T cell stimulating signals to a hydrogel. A) Schematic of aTM made from conjugating Signals 1 and 2 to a hyaluronic acid hydrogel. Attachments of Signal 1 and 2 enable effective T cell stimulation that leads to T cell proliferation, differentiation, and effector function. Receptors bind to ECM hydrogel and also contribute to attachment and T cell signaling. B–D) B6 CD8+ T cell fold expansion measured after 7 d of stimulation of the antigen-specific T cells on the hydrogels with Signals 1 + 2 conjugated or soluble (error bars show s.e.m.; **p < 0.005, n = 4, Student’s t-test, two-tailed) (B), conjugated together or alone (error bars show standard error of the mean (s.e.m.); **p < 0.005, ***p < 0.0005, n = 5–7, one-way ANOVA with Tukey’s post-test) (C), and at varying amounts of Signals 1 + 2, n = 5 (D). E) Day 7 CD8+ T cell fold expansion measured after 7 d of stimulation of the antigen-specific T cells on the aTM. T cells were removed from aTM on the day noted and cultured on TCP until day 7.
Figure 2.
Figure 2.
Tuning the stiffness of the aTM impacts T cell stimulation. A) Schematic illustrating hypothesis that tuning stiffness of aTM may change the ability for cell mechanotransduction. B) Elastic modulus measured by rheometry with varying PEGDA cross-linker weight percent (error bars show s.e.m., n = 3). C) CFSE proliferation dye dilution measured after 3 d of stimulation of T cells comparing a stiff (3 kPa) and soft 0.5 kPa) aTM. D) CD8+ T cell fold expansion measured after 7 d of stimulation of the T cells on aTMs with varying stiffness (error bars show s.e.m.; *p < 0.05, **p < 0.005, n = 4–12, one-way ANOVA with Tukey’s post-test). E) CD8+ T cell fold expansion measured for T cells stimulated on soft aTMs (0.5 kPa) with or without blebbistatin (error bars show s.e.m.; ***p < 0.0005, n = 4, Student’s t-test, two-tailed). F) Quantitation of percentage of T cells in each divisional generation based on CFSE proliferation dye dilution with T cells stimulated on HA hydrogels of different stiffness with aAPC (error bars show s.e.m, n = 4–8). G) CD8+ T cell fold expansion measured after 7 d of stimulation of T cells on the aTMs with either laminin and RGD attached (error bars show s.e.m.; *p < 0.05, n = 3–6, one-way ANOVA with Tukey’s post-test). H) Airyscan super-resolution imaging of phalloidin and CD3 of CD8+ T cells cultured on either soft or stiff aTM (scale bar = 2 μm.), I) where a total of 515 spots were analyzed from 16 cells in the 0.5 kPa condition and 1580 spots were analyzed from 13 cells in the 3 kPa condition. (Error bars show s.e.m.; ****p < 0.0001, Student’s t-test, two-tailed).
Figure 3.
Figure 3.
Stimulated T cells are influenced by additional signaling from the HA hydrogel. A) Schematic showing experimental setup testing the difference between activating antigen-specific CD8+ T cells with nanoparticle artificial antigens presenting cells (aAPC) on HA hydrogel versus a tissue culture plate (TCP). B) CFSE proliferation dye dilution measured after 3 d of stimulation of antigen-specific T cells stimulated by the same dose of aAPC on either TCP or on HA hydrogel surface. C) Percent of CD8+ T cells that have divided by day 3 as measured by CFSE proliferation dye dilution (error bars show s.e.m., *p < 0.05, **p < 0.005, ***p < 0.0005 n = 7, one-way ANOVA with Tukey’s post-test). D) Time course experiment using p-S6 (S240/S244) as the read out for mTORC1 activation. This relative fold-change pattern represents three independent experiments using phospho-flow cytometry. E) Phenotypic markers (CD62L, CD44) measured by flow cytometry after 7 d of stimulation with aAPC on different surfaces (error bars show s.e.m.; *p < 0.05, n = 7, Student’s t-test, two-tailed). F,G) Time course experiment detecting fold change of F) IL15Ra (CD215) and G) IL7Ra (CD127). Geometric means of each data point are compared first with their isotype controls followed by the baseline control. Data represents two independent experiments. H) T cells positive for all four cytokine and functional molecules (IL-2, IFN-γ, TNFα, CD107a) were measured by flow cytometry after 7 d of stimulation (error bars show s.e.m.; *p < 0.05, n = 7, Paired t-test, two-tailed).
Figure 4.
Figure 4.
Artificial T cell stimulating matrix hydrogels provide effective stimulation to human CD8+ T cells. A) CD8+ T cell fold expansion measured after 7 d of stimulation by aTM with Signals 1 + 2 (anti-CD3 and anti-CD28) conjugated at varying amounts, n = 3 independent donors. B) Phenotype of CD8+ T cells after culture on aTM surfaces of varying Signals 1 + 2 amounts defined by CD45RA and CD62L (error bars show s.e.m). C) CFSE proliferation dye dilution measured after 3 d of stimulation of CD8+ T cells comparing a stiff (3 kPa) and soft (0.5 kPa) aTM, n = 3 independent donors. D) CD8+ T cell fold expansion measured after 7 d of stimulation on aTMs with varying stiffness (error bars show s.e.m.; **p < 0.01, n = 3 independent donors, one-way ANOVA with Dunnett’s post-test comparing to 3 kPa condition). E) Phenotype of CD8+ T cells after culture on aTM surfaces of varying stiffness defined by CD45RA and CD62L (error bars show s.e.m; n = 3 independent donors).
Figure 5.
Figure 5.
aTM stimulates a greater number and percent of functional antigen-specific CD8+ T cells that provide more effective tumor treatment. A,B) Percentage of antigen-specific T cells after 7 d of stimulation is determined by staining with cognate and noncognate antigen-loaded peptide major histocompatibility complex (pMHC) and anti-CD8a. B,C) Percentages (B) and numbers (C) of antigen-specific CD8+ T cells stimulated by aTM, or by aAPC on either TCP or HA hydrogel surface (error bars show s.e.m.; **p < 0.01, ***p < 0.001, n = 12–15, one-way ANOVA with Tukey’s post-test). D) Fold IL7Ra expression on antigen-specific CD8+ T cells from HA+ aAPC and aTM compared to IL7Ra expression on antigen-specific CD8+ T cells from TCP + aAPC (error bars show s.e.m., n = 8–9). E) T cell functionality was measured by the number of functional molecules co-expressed by each antigen-specific cell (IFN-γ, TNFα, CD107a) after 7 d of stimulation (n = 5–7). F) Murine melanoma therapeutic in vivo model for adoptively transferred cells. G) Tumor size measurements indicate that adoptive T cells from aTM stimulation significantly delayed tumor growth. Significance measured by two-way ANOVA with Bonferroni post-test (p < 0.0001) and H) significantly extended survival. Significance measured by log-rank test (p = 0.05, n = 5–6).

References

    1. Hickey JW, Kosmides AK, Schneck JP, Int. Rev. Cell Mol. Biol 2018, 341, 277. - PubMed
    1. Rosenberg SA, Restifo NP, Yang JC, Morgan RA, Dudley ME, Nat. Rev Cancer 2008, 8, 299. - PMC - PubMed
    1. Ahmadzadeh M, Johnson LA, Heemskerk B, Wunderlich JR, Dudley ME, White DE, Rosenberg SA, Blood 2009, 114, 1537. - PMC - PubMed
    1. Pollack SM, Jones RL, Farrar EA, Lai IP, Lee SM, Cao J,Pillarisetty VG, Hoch BL, Gullett A, Bleakley M, J. Immunother. Cancer 2014, 2, 36. - PMC - PubMed
    1. Wherry EJ, Nat. Immunol 2011, 12, 492. - PubMed

MeSH terms