. 2019 Nov;97(7):e998-e1005.
doi: 10.1111/aos.14110. Epub 2019 Apr 9.

Progression characteristics of ellipsoid zone loss in macular telangiectasia type 2

Collaborators, Affiliations

Progression characteristics of ellipsoid zone loss in macular telangiectasia type 2

Daniel Pauleikhoff et al. Acta Ophthalmol. 2019 Nov.

Abstract

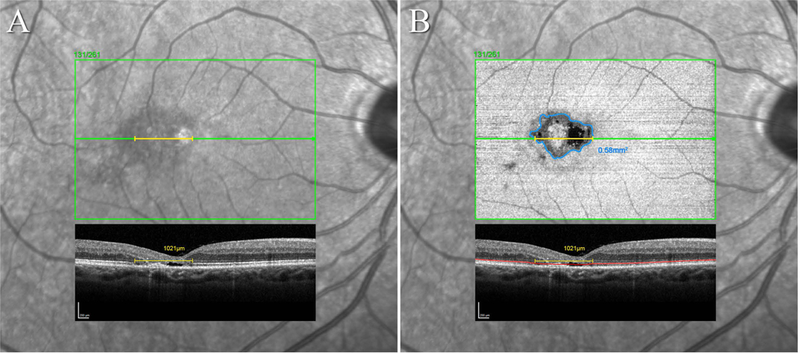
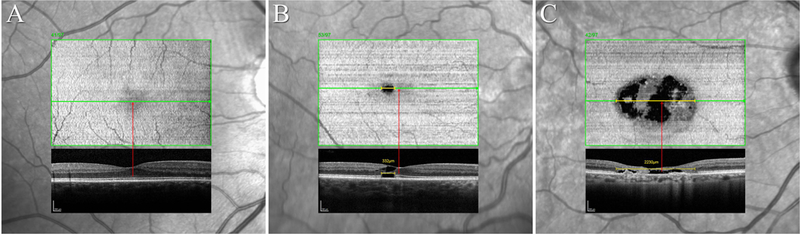
Purpose: To investigate the progression characteristics of ellipsoid zone (EZ) loss in eyes with macular telangiectasia type 2 (MacTel) as reflected by area and linear measurements, and their relevance for visual acuity.

Methods: Participants were selected from the MacTel Study cohort. Linear and area measurements of EZ loss were performed in Spectral-Domain Optical Coherence Tomograph (SD-OCT) volume scans. Progression characteristics and correlations between linear and area measurements were analysed using linear mixed effects models.

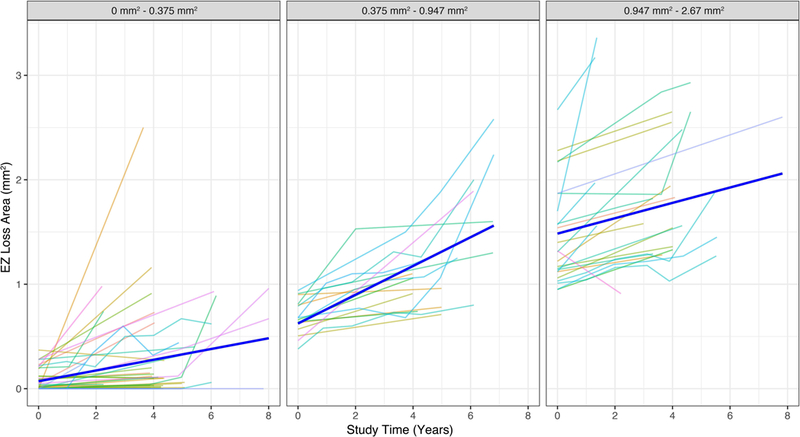
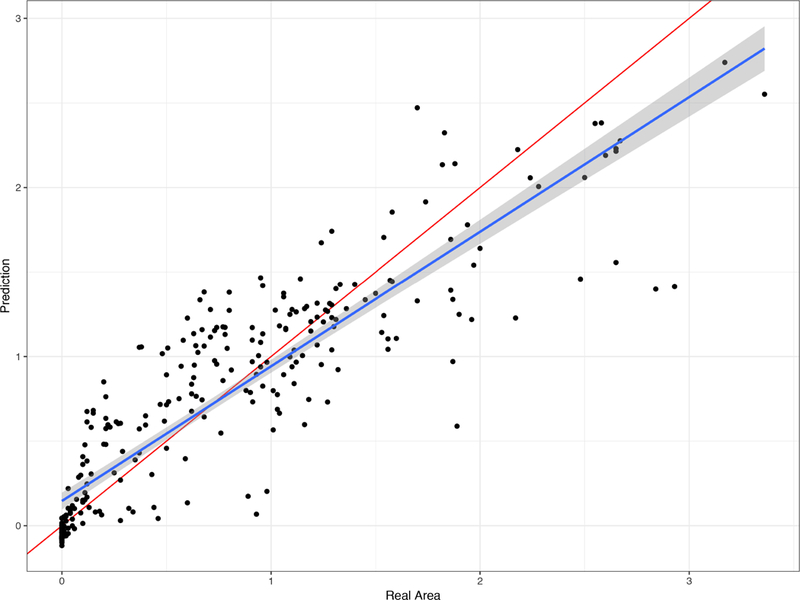
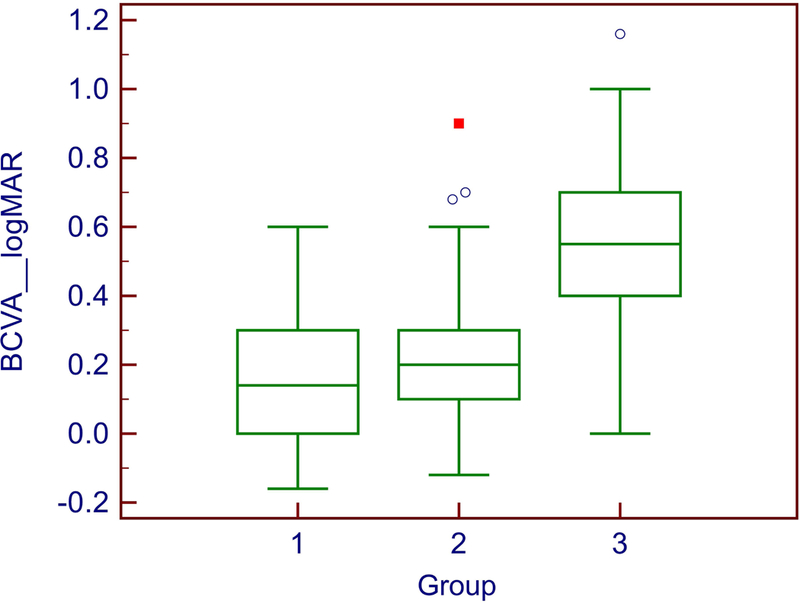
Results: A total of 134 eyes of 70 patients were included (85 eyes with follow-up, mean 4.7 years, range: 1.4-8 years). Ellipsoid zone (EZ) loss significantly progressed at a mean annual increment of 0.057 mm2 (p = 0.005). The progression rate was non-linear and interacted significantly with initial EZ lesion size indicating an exponential growth before reaching a plateau. There was a strong heterogeneity in area sizes between fellow eyes. EZ break length had a significant linear effect on EZ break area (b = 1.06, p < 0.001) and could predict it. The location of the EZ break had a significant impact on visual acuity.

Conclusion: Ellipsoid zone (EZ) loss in MacTel has a non-linear progression characteristic, and its rate depends on area size at baseline, which must be taken into account at sample selection in clinical trials. Our results show a good correlation of linear and area measures of EZ loss and a segregation of best-corrected visual acuity by EZ location, which may help routine clinical practice.

Keywords: OCT; MacTel; ellipsoid zone; en face image; macular telangiectasia type 2.


Figures

Figure 1.
Figure 1.. Linear and area measurements of the EZ break in SD-OCT volume scans.
A: Infrared SLO image with the position marker of the OCT volume scan and B-scan #131/261 traversing the foveal center superimposed. The caliper tool (yellow) was used to measure the lateral linear extent of the EZ break in this B-scan. B: The EZ en face image superimposed over the IR image in A. The EZ segmentation line is marked within the B-scan in red, the boundary of the break within the en face image of the EZ in blue. In this case, the EZ break also affects the foveal center. Only areas where the EZ was no longer apparent in the B-scan were accepted as a clear break. Mere attenuations of a signal still present were not accepted as a full EZ break (e.g. smaller dark areas infero-temporal to the main lesion in the en face image in B. These may however be early signals of a developing break).
Figure 2.
Figure 2.. Topographic location of the EZ break relative to the foveal center.
The diagnosis in MacTel may be established based on any satisfactory combination of the characteristic signs of the disease: a redistribution of luteal pigment, the concomitant pattern of hyper-reflectivity to short-wavelength light, OCT low reflective spaces in the inner/outer retina without retinal thickening, OCT focal outer retinal atrophy, mostly with overall retinal thinning; vascular abnormalities (telangiectatic and/or dilated capillaries in the deep plexus, dilated, blunted or right angle veins), or perivascular pigment plaques predominantly in the mid-retina, all in the absence of extensive retinal thickening or cystoid macular edema. Given an established diagnosis, the incidence of an EZ break and when it reaches the foveal center are landmark events in MacTel. Based on these two events, as reflected by OCT volume imaging, viewed either in B-scans or in transverse images of the Ellipsoid Zone, cases may be grouped: [A] Established MacTel disease, but no detectable EZ break. Contrast sensitivity, scotopic retinal sensitivity and reading speeds may be affected, BCVA and mesopic retinal sensitivity are preserved. [B] An EZ break is present but the nearest edge does not reach the foveal center. In these cases, mesopic microperimetry will demonstrate a scotoma co-locating with the area of the EZ break. BCVA is likely to be unaffected. [C] An EZ break is present and it also affects the foveal center. BCVA is likely to be affected. Subretinal neovascular proliferation (SRNV) or post-SRNV scarring is a secondary complication of MacTel, and may occur at any point in its natural history. SRNV may threaten central vision directly and responds to anti-vEGF therapy, whereas the basic disease process does not. At least a quick cursory en face glance is recommended in all eyes to exclude extreme cases e.g. with vertically oblong EZ breaks or major EZ breaks located largely outside the transfoveal scan. The functional relevance of the location of the EZ break is shown in Figure 5.
Figure 3.
Figure 3.. Observed and predicted growth curves at different initial break areas.
These line plots show the observed progression patterns of the EZ break area (thin colored lines) and the average predicted patterns form the model (bold blue lines) at different initial break area sizes. Note how the predicted progression pattern estimated by the model changes in each initial break area group (0–0.375mm2, 0.375–0.947mm2, and 0.947–2.67mm2). This effect is indicating a non-linear progression of EZ break area that increases exponentially over time before reaching a plateau.
Figure 4:
Figure 4:. Relationship between real break areas and break areas predicted based on break length.
This figure demonstrates the relationship of predicted beak area values (based on break length) and the real observed break area. Each dot represents one such data pair, predicted size on the Y axis, measured size value on the X axis (both axes in mm2). This figure also includes the estimated relationship between the predicted and the true areas (blue line) as well as the identity line (red line). Note how the relationship between linear and predicted areas overlaps with the identity line, indicating a strong predicting power.
Figure 5:
Figure 5:. Distribution of BCVA values by location of the EZ break.
The differences in BCVA between groups 1 (no EZ break, n=24) and 2 (EZ break present but not involving the foveal center, n=93) were not statistically significant. In group 3 (n=43), two eyes had full vision. One explanation of good visual acuity despite the lesion reaching the foveal center in these outliers may be that fixation and the point of best acuity may not correspond exactly with the anatomical center of the fovea in all eyes.(Zeffren et al. 1990; Wilk et al. 2017; Putnam et al. 2005) Another possibility is that the absence of the EZ line may not indicate absence of structures that give rise to the line, but indicate distortion of alignment of these structures.

References

    1. Charbel Issa P, Berendschot TT, Staurenghi G, Holz FG & Scholl HP(2008): Confocal blue reflectance imaging in type 2 idiopathic macular telangiectasia. Invest Ophthalmol Vis Sci 49: 1172–1177. - PubMed
    1. Charbel Issa P, Gillies MC, Chew EY, Bird AC, Heeren TF, Peto T, Holz FG& Scholl HP(2013): Macular telangiectasia type 2. Prog Retin Eye Res 34: 49–77. - PMC - PubMed
    1. Chew EY, Clemons TE, Peto T, Sallo FB, Ingerman A, Tao W, Singerman, Schwartz SD, Peachey NS& Bird AC(2015): Ciliary neurotrophic factor for macular telangiectasia type 2: results from a phase 1 safety trial. Am J Ophthalmol 159: 659–666 e651. - PMC - PubMed
    1. Clemons TE, Gillies MC, Chew EY, Bird AC, Peto T, Figueroa MJ& Harrington MW(2010): Baseline characteristics of participants in the natural history study of macular telangiectasia (MacTel) MacTel Project Report No. 2. Ophthalmic Epidemiol 17: 66–73. - PMC - PubMed
    1. Clemons TE, Gillies MC, Chew EY, Bird AC, Peto T, Wang JJ, Mitchell P, Ramdas WD& Vingerling JR(2013): Medical characteristics of patients with macular telangiectasia type 2 (MacTel Type 2) MacTel project report no. 3. Ophthalmic Epidemiol 20: 109–113. - PubMed