. 2019 Apr 10:8:e45343.
doi: 10.7554/eLife.45343.

Enterococcus faecium secreted antigen A generates muropeptides to enhance host immunity and limit bacterial pathogenesis

Affiliations

Enterococcus faecium secreted antigen A generates muropeptides to enhance host immunity and limit bacterial pathogenesis

Byungchul Kim et al. Elife. .

Abstract

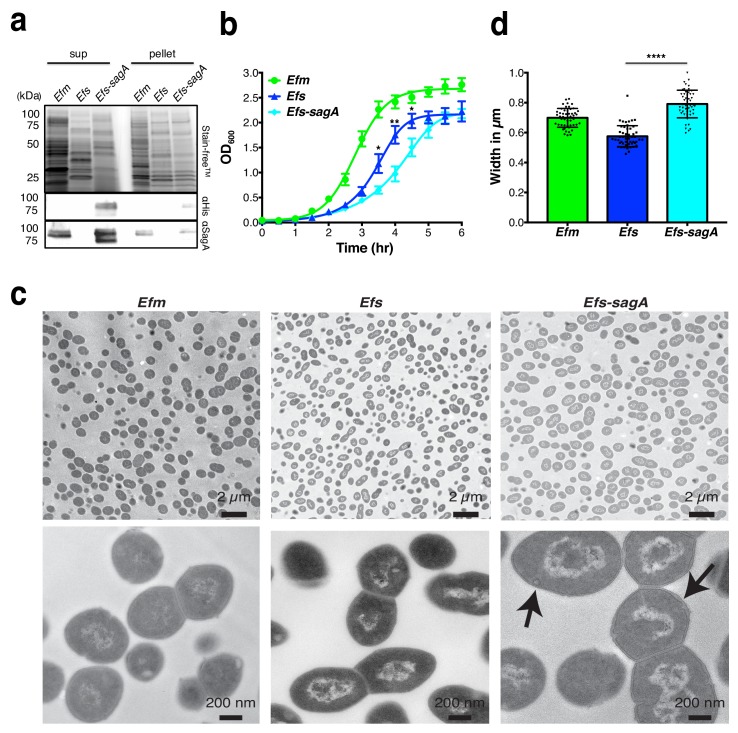
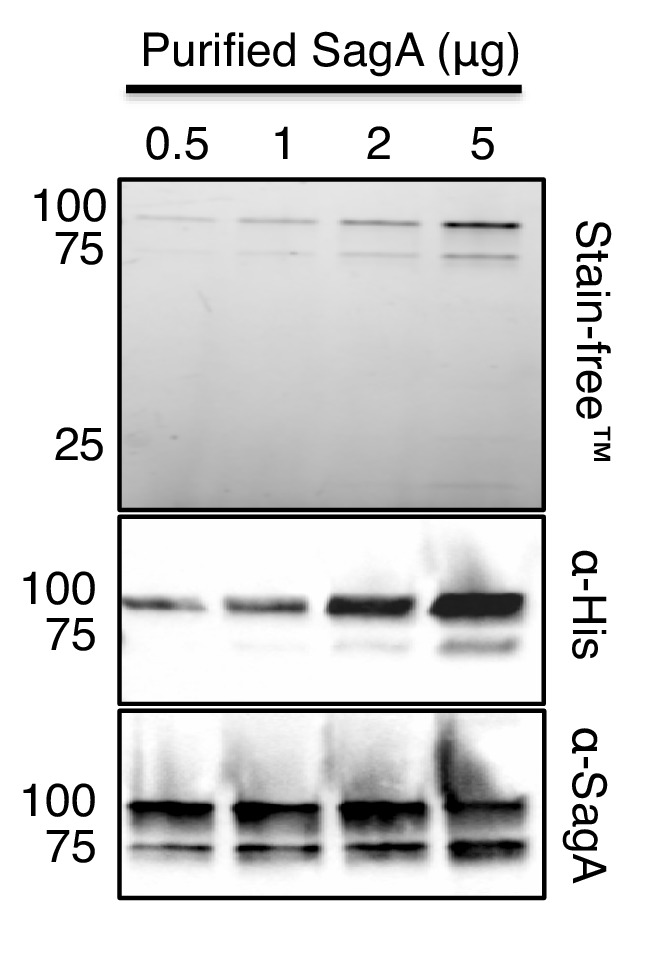
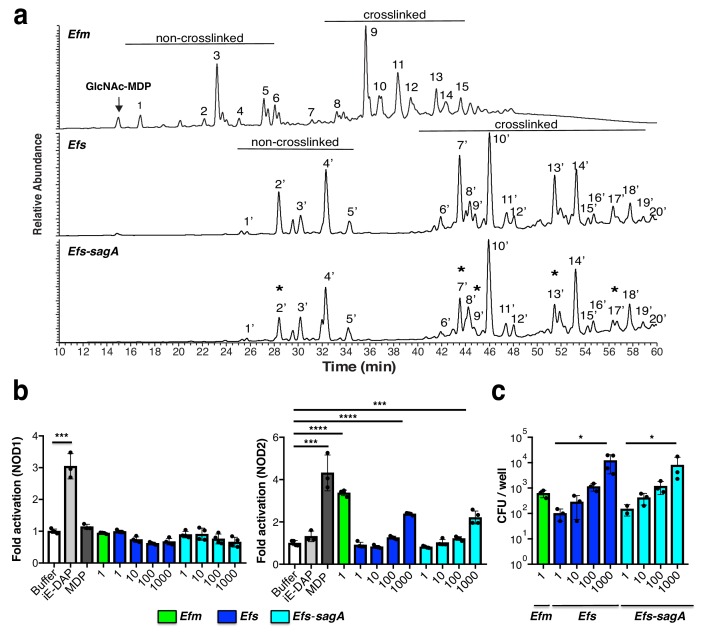
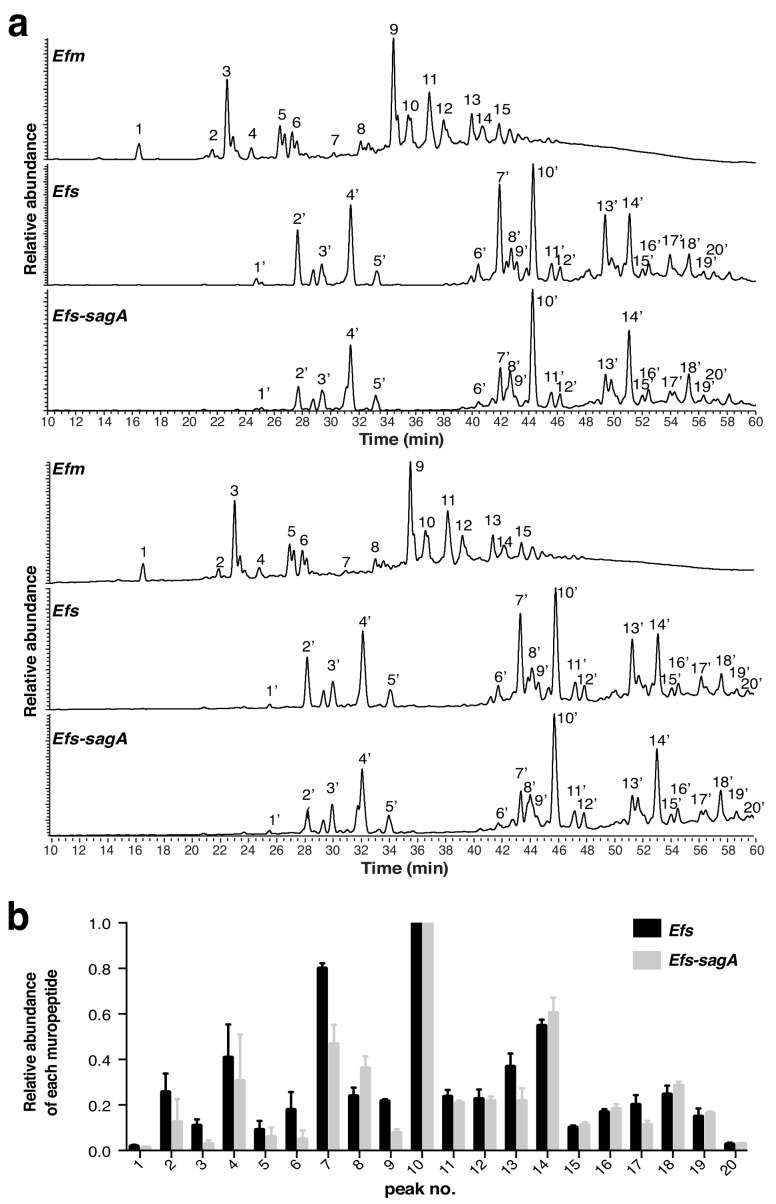
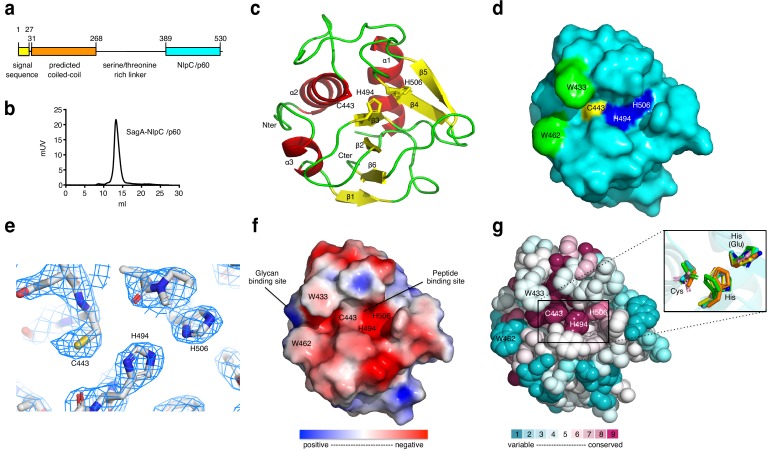
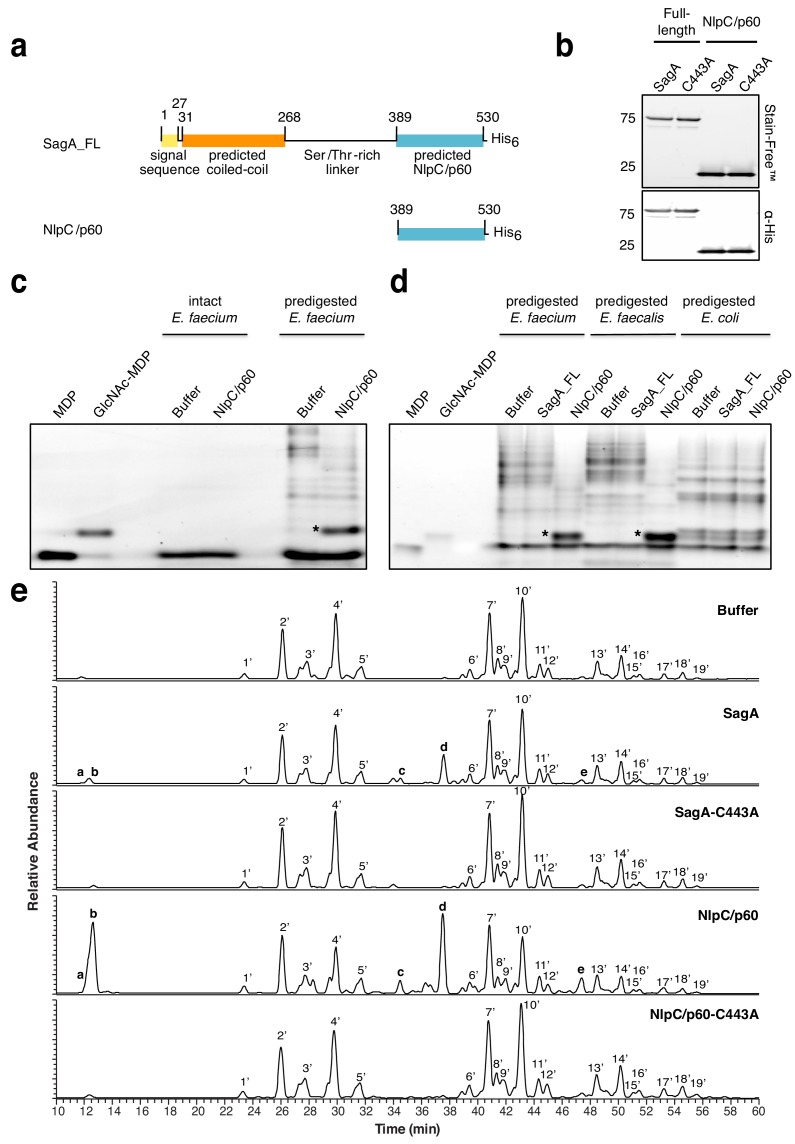
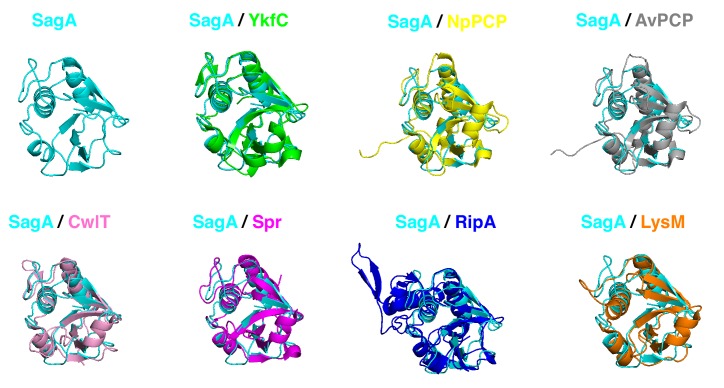
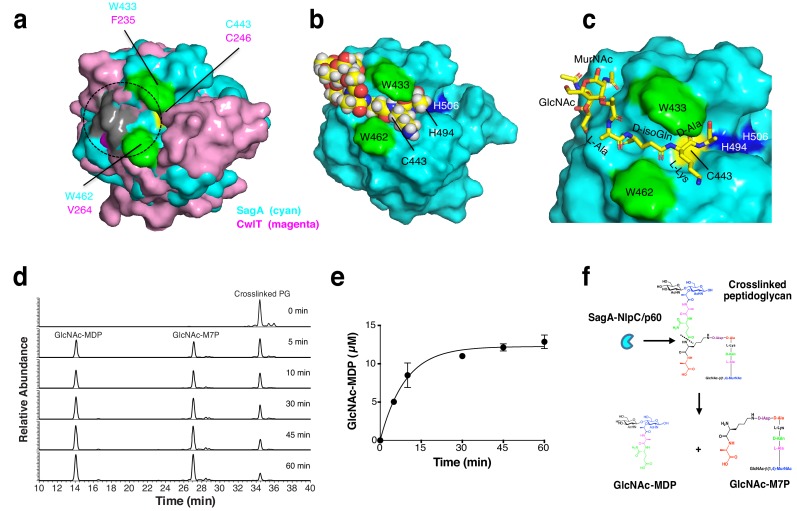
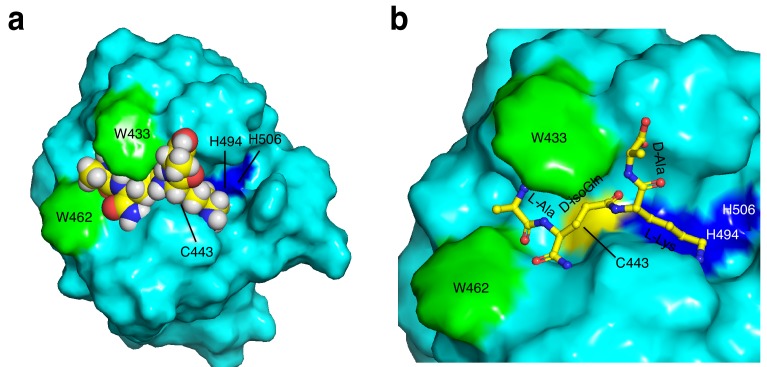
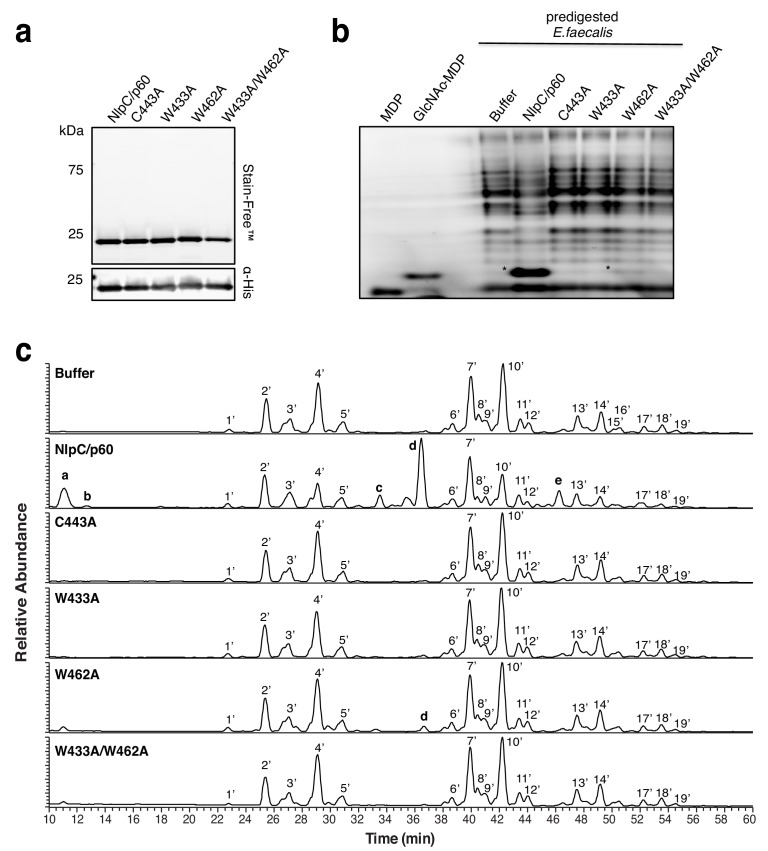
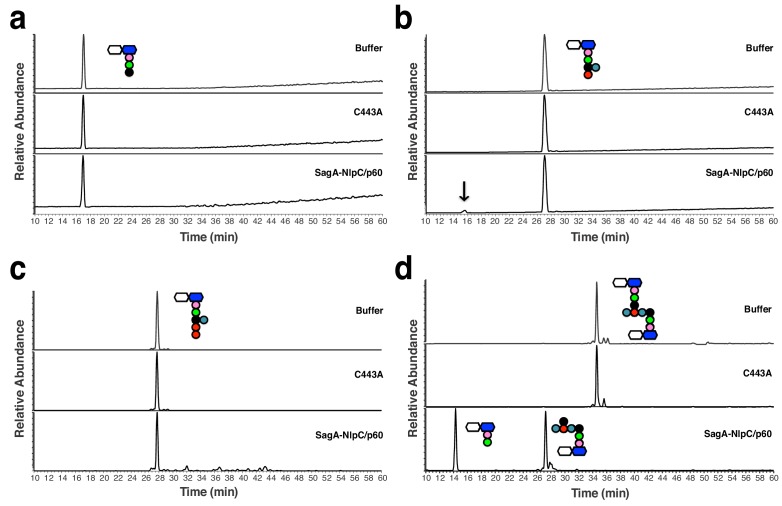
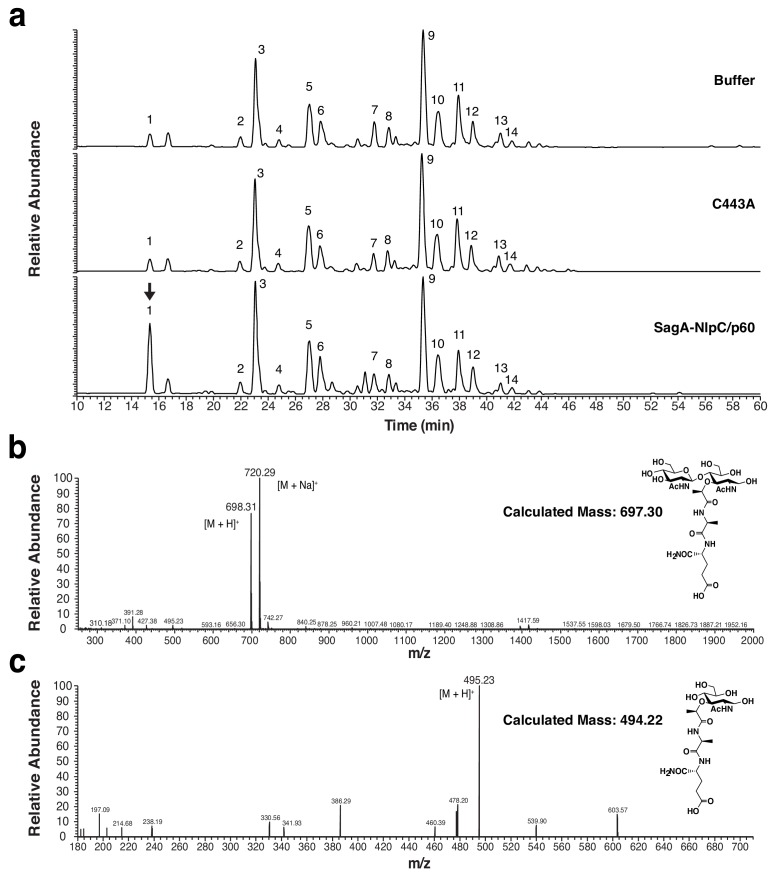
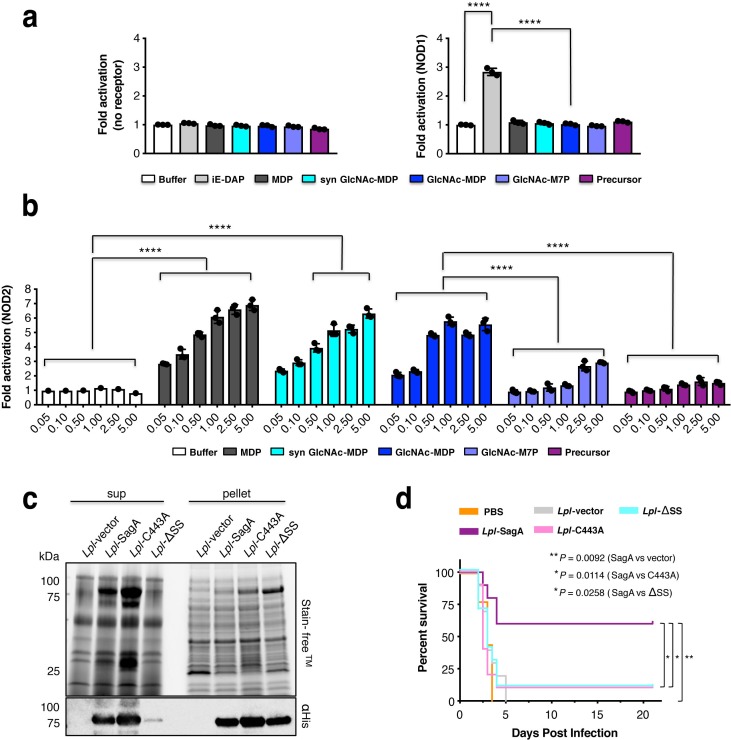
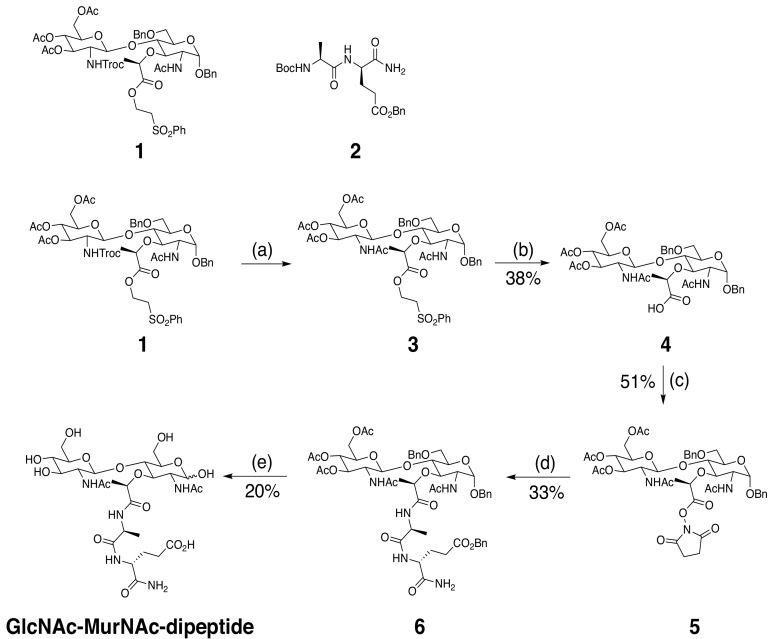
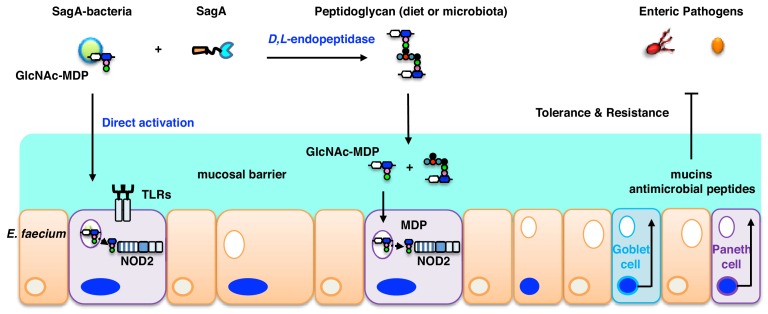
We discovered that Enterococcus faecium (E. faecium), a ubiquitous commensal bacterium, and its secreted peptidoglycan hydrolase (SagA) were sufficient to enhance intestinal barrier function and pathogen tolerance, but the precise biochemical mechanism was unknown. Here we show E. faecium has unique peptidoglycan composition and remodeling activity through SagA, which generates smaller muropeptides that more effectively activates nucleotide-binding oligomerization domain-containing protein 2 (NOD2) in mammalian cells. Our structural and biochemical studies show that SagA is a NlpC/p60-endopeptidase that preferentially hydrolyzes crosslinked Lys-type peptidoglycan fragments. SagA secretion and NlpC/p60-endopeptidase activity was required for enhancing probiotic bacteria activity against Clostridium difficile pathogenesis in vivo. Our results demonstrate that the peptidoglycan composition and hydrolase activity of specific microbiota species can activate host immune pathways and enhance tolerance to pathogens.

Keywords: Enterococcus; NOD2; biochemistry; chemical biology; commensal bacteria; intestinal barrier; microbiota; peptidoglycan.


Conflict of interest statement

BK, YW, CH, JE, JS, KR, DO, JK, VP, HH No competing interests declared

Figures

Figure 1.
Figure 1.. SagA expression alters E.faecalis growth and morphology.
(a) Expression of SagA in E. faecium (Efm), E. faecalis (Efs), and E. faecalis-sagA (Efs-sagA) supernatant and cell pellet by anti-His6 and anti-SagA blots. (b) Growth curve of E. faecium, E. faecalis, and E. faecalis-sagA. The error bars indicate standard deviation of triplicate measurements. Data was analyzed using a two-tailed t-test. *p≤0.05; **p≤0.01. (c) Electron microscopy of Enterococci strains. Cells for microscopy were grown in BHI medium at 37°C and collected in exponential growth phase. Top Panel: EM of E. faecium, E. faecalis and E. faecalis-sagA samples. Scale bars - 2 µm. Images of the E. faecalis-sagA revealed size differences from normal growth caused by the presence of the sagA expression. Bottom panel: Representative higher magnification images of each cell. Scale bars - 200 nm. The arrows indicate the morphological changes observed in the cell wall structure of E. faecalis-sagA. (d) 50 cells from E. faecium, E. faecalis and E. faecalis-sagA were randomly selected. Width was measured in each condition. Data was analyzed using an unpaired t-test with Welch’s correction; n = 50 per group. P value < 0.0001.
Figure 1—figure supplement 1.
Figure 1—figure supplement 1.. Western blot analysis of anti-SagA polyclonal sera.
Figure 2.
Figure 2.. Analysis Enterococci peptidoglycan composition and activation of intracellular peptidoglycan pattern recognition receptors.
(a) LC-MS analysis of peptidoglycan isolated from E. faecium, E. faecalis, and E. faecalis-sagA digested by mutanolysin. Numbers correspond to each muropeptide from E. faecium, E. faecalis, and E. faecalis-sagA. Muropeptides that are significantly decreased in E. faecalis-sagA compared to E. faecalis are marked with asterisks. Arrow indicates endogenous G-MDP peak from isolated E. faecium peptidoglycan. (b) Analysis of E. faecium (MOI = 1), E. faecalis, and E. faecalis-sagA (MOI = 1, 10, 100, 1000) activation of NOD1- and NOD2-expressing NF-κΒ reporter HEK293T cells with iE-DAP (50 μM, NOD1 ligand, light grey), MurNAc-L-Ala-D-isoGln (5 μM, MDP, NOD2 ligand, dark grey). (c) E. faecium (MOI = 1), E. faecalis, and E. faecalis-sagA (MOI = 1, 10, 100, 1000) internalization in HEK293T cells using gentamycin protection/CFU assay. For b and c, data are presented as means ± s.d.; n = 3 per group. Data was analyzed using a two-tailed t-test. *p≤0.05; **p≤0.01; ***p≤0.005; ****p≤0.001.
Figure 2—figure supplement 1.
Figure 2—figure supplement 1.. LC-MS analysis of mutanolysin-digested peptidoglycan fragments from E. faecium, E. faecalis, and E. faecalis-sagA.
(a) Muropeptides were reduced by sodium borohydride and separated by HPLC on a 3 μm ODS-Hypersil column (2.1 μm, 2.1 × 150 mm), using a gradient of methanol (from 0% to 30% in the presence of 0.1% TFA in 60 min) at a flow rate of 0.2 ml/min. AU, absorbance unit. Their identity is indicated in Supplementary files 1 and 2. (b) Comparative analysis of muropeptide abundance from E. faecalis-sagA (Efs-sagA) PG compared to E. faecalis (Efs) PG. Relative abundances are calculated by taking averaged area under curve from extracted ion chromatograms and normalized to the most abundant peak (peak number 10), n = 3. Overall PG composition by relative abundance between E. faecalis and E. faecalis-sagA shows significant decrease in muropeptides with expression of SagA.
Figure 3.
Figure 3.. X-ray structure analysis of SagA-NlpC/p60 domain.
(a) Schematic of SagA protein architecture, as predicted by Signal P, Jpred and BLASTP analysis. (b) Gel-filtration data of purified SagA-NlpC/p60. (c) Ribbon diagram of the C-terminal domain of SagA with secondary-structure elements labeled. (d) Surface representation of the SagA-NlpC/p60 (PDB entry: 6B8C). Catalytic triad of Cys443 (yellow), His494 (blue), His506 (blue), Trp433 (green), and Trp462 (green) are highlighted. (e) The 2Fo-Fc electron density (contoured at 1.5σ) of catalytic triad (Cys443, His494, and His506) is shown as a light blue mesh. (f) Electrostatic potentials of SagA-NlpC/p60. The color is scaled from −2 to 2 kT/e (blue, positive electrostatic potential; red, negative electrostatic potential) using PyMOL with the APBS tool. The surface shows potential glycan-binding site and substrate-binding groove, which can be proposed to bind to peptide from peptidoglycan fragment. (g) The conserved surface representation of SagA-NlpC/p60 is color coded according to amino acid conservation based on comparison to other homologs with sequence identities of 35% to 95% compared to SagA-NlpC/p60. Inlet box: Superimposition of the catalytic triad (Cys-His-His(Glu)) of SagA-NlpC/p60 with other structurally characterized peptidoglycan hydrolases. Color-coded are SagA-NlpC/p60 from Enterococcus faecium (cyan, PDB entry: 6B8C) with YkfC from Bacillus cereus (green, PDB entry: 3H41), NpPCP from Nostoc punctiforme (yellow, PDB entry: 2EVR), AvPCP from Anabaena variabilis (gray, PDB entry: 2HBW), CwlT from Staphylococcus aureus (pink, PDB entry: 4FDY), Spr from Escherichia coli (magenta, PDB entry: 2K1G), RipA from Mycobacterium tuberculosis (blue, PDB entry: 3NE0), and LysM from Thermus thermophilus (orange, PDB entry: 4XCM).
Figure 3—figure supplement 1.
Figure 3—figure supplement 1.. Multiple sequence alignment of C-terminal domains from different Enterococcus faecalis (Efs) strains.
SagA homologs were identified using BLAST protein searches through the Integrated Microbial Genomes and Microbiomes (IMG/M) system (Chen et al., 2019) based on the SagA primary sequence from E. faecium Com15. The homologous sequences in the different E. faecalis strains were retrieved and their C-terminal domains were predicted using InterPro. MUSCLE alignment of the corresponding amino acid sequences of these domains was done using the rMSA package with default parameters. The alignment was edited in LaTex with the TexShade style to highlight conserved and similar residues, and generate a % identity / % similarity table. Residues with ≥70% conservation are highlighted in dark gray, and similar residues are highlighted in light grey. Conserved tryptophan residues are highlighted in green, and cysteine and histidine residues in the catalytic triad are highlighted in yellow and cyan, respectively.
Figure 3—figure supplement 2.
Figure 3—figure supplement 2.. Multiple sequence alignment of NlpC/p60 domains from different Enterococcus faecium (Efm) strains.
SagA homologs were identified using BLAST protein searches through the Integrated Microbial Genomes and Microbiomes (IMG/M) system (Chen et al., 2019) based on the SagA primary sequence from E. faecium Com15. The homologous sequences in the different E. faecium strains were retrieved and their NlpC/p60 domains were predicted using InterPro. MUSCLE alignment of the corresponding amino acid sequences of these domains was done using the R MSA package with default parameters. The alignment was edited in LaTex with the TexShade style to highlight conserved and similar residues, and generate a % identity/ % similarity table. Residues with ≥70% conservation are highlighted in dark gray, and similar residues are highlighted in light grey. Conserved tryptophan residues are highlighted in green, and cysteine and histidine residues in the catalytic triad are highlighted in yellow and cyan, respectively.
Figure 3—figure supplement 3.
Figure 3—figure supplement 3.. Characterization of peptidoglycan hydrolase activity of SagA constructs.
(a) Schematic representation of SagA and SagA-NlpC/p60 domain. (b) Stain-free SDS-PAGE of full-length SagA and NlpC/p60 construct. (c) ANTS visualization of isolated peptidoglycan from E. faecium treated with buffer or purified SagA-NlpC/p60 (intact E. faecium) and peptidoglycan treated with mutanolysin followed by buffer or purified SagA-NlpC/p60 (predigested E. faecium). Muropeptides were isolated as previously described (Mugunthan et al., 2011), dried, labeled with ANTS, separated by native PAGE and then visualized by UV. ANTS-labeled synthetic fragments MDP (MurNAc-L-Ala-D-iGln), GlcNAc-MDP (GlcNAc-MurNAc-L-Ala-D-iGln) were analyzed in parallel for comparison. Bold asterisks indicate product formation from overnight incubation of peptidoglycan digested with purified SagA construct. (d) ANTS visualization of isolated peptidoglycan from E. faecium (Efm), E. faecalis (Efs) and E. coli (Ec) treated with mutanolysin followed by each purified SagA construct (SagA-FL: full-length SagA), NlpC/p60: truncated NlpC/p60 domain) grown from E. coli. (e) LC-MS analysis of peptidoglycan isolated from E. faecalis digested by mutanolysin followed by buffer, purified full-length SagA, full-length SagA-C443A, NlpC/p60 domain, and NlpC/p60-C443A. Enzymatic products (a,b,c,d,e) were generated only after incubation with purified full-length SagA and purified NlpC/p60 domain as shown in Supplementary file 4.
Figure 3—figure supplement 4.
Figure 3—figure supplement 4.. Alignment of SagA-NlpC/p60 domain with other homologs.
Superimposition of the X-ray structure of the NlpC/p60 domain from SagA-NlpC/p60 from Enterococcus faecium (cyan, PDB entry: 6B8C) with YkfC from Bacillus cereus (green, PDB entry: 3H41), NpPCP from Nostoc punctiforme (yellow, PDB entry: 2EVR), AvPCP from Anabaena variabilis (gray, PDB entry: 2HBW), CwlT from Staphylococcus aureus (pink, PDB entry: 4FDY), Spr from Escherichia coli (magenta, PDB entry: 2K1G), RipA from Mycobacterium tuberculosis (blue, PDB entry: 3NE0), and LysM from Thermus thermophilus (orange, PDB entry: 4XCM).
Figure 4.
Figure 4.. Model of peptidoglycan fragment bound to SagA and analysis of SagA-NlpC/p60 with purified peptidoglycan fragments.
(a) Overlay of potential substrate binding site of SagA-NlpC/p60 (cyan) with CwlT (magenta). Positive charge residues are colored as light grey, aromatic (hydrophobic) residues as green, and catalytic cysteine residue as yellow. Predicted location of substrate-binding site is marked by circles. (b) Binding of peptidoglycan fragment (GlcNAc-MurNAc-tetrapeptide; L-Ala-D-isoGln-L-Lys-D-Ala) to SagA was modeled with space-filling representation using Glide (Schrödinger, LLC, New York, NY). Catalytic triad of Cys443 (yellow), His494 (blue), His506 (blue), Trp433 (green), and Trp462 (green) are highlighted. (c) Closer view of docked peptidoglycan fragment to SagA active site. (d) LC-MS analysis of reaction of isolated muropeptide purified from E. faecium by digesting with purified NlpC/p60 domain in time-dependent manner. Peak 1, purified crosslinked peptidoglycan (Disaccharide-tetrapeptide-disaccharide-tripeptide); 2, GlcNAc-MurNAc-L-Ala-D-isoGln-L-Lys-crosslinked-D-Ala-L-Lys heptapeptide product (GlcNAc-M7P); 3, GlcNAc-MurNAc-L-Ala-D-isoGln (GlcNAc-MDP). Products were confirmed by mass spectrometry. (e) Specific activity plot of SagA-NlpC/p60 with disaccharide-dipeptide. Specific activity was determined by quantification of product peak area using LC-MS. Data was obtained as the mean ± S.D. of the data from three independent experiments. (f) In vitro studies suggest SagA-NlpC/p60 domain cleaves crosslinked peptidoglycan fragments to generate GlcNAc-MDP and GlcNAc-M7P.
Figure 4—figure supplement 1.
Figure 4—figure supplement 1.. Model of peptidoglycan fragment by SagA.
(a) Binding of peptidoglycan fragment (tetrapeptide; L-Ala-D-isoGln-L-Lys-D-Ala) to SagA was modeled with space-filling representation using Glide (Schrödinger, LLC, New York, NY). Catalytic triad of Cys443 (yellow), His494 (blue), His506 (blue), Trp433 (green), and Trp462 (green) are highlighted. (b) Closer view of docked peptidoglycan fragment to SagA active site.
Figure 4—figure supplement 2.
Figure 4—figure supplement 2.. Activity of SagA-NlpC/p60 mutants on mutanolysin-digested peptidoglycan from E.faecalis.
(a) Stain-Free (Bio-Rad) SDS-PAGE of SagA-NlpC/p60 domain, NlpC/p60-C443A, NlpC/p60-W433A, NlpC/p60-W462A, and NlpC/p60-W433A/W462A constructs. (b) ANTS visualization of peptidoglycan treated with mutanolysin followed by buffer or purified SagA-NlpC/p60 constructs (predigested E. faecalis). Bold asterisks indicate product formation from overnight incubation of peptidoglycan digested with purified SagA constructs. (c) LC-MS analysis of isolated peptidoglycan from E. faecalis were digested with mutanolysin, followed by incubating with buffer, NlpC/p60, C443A, W433A, W462A, and W433A/W462A mutants at 37°C for 16 hr. Enzymatic products (a,b,c,d, and e) from incubation of E. faecalis peptidoglycan by purified NlpC/p60 and NlpC/p60-W462A mutant were observed as shown in Supplementary file 4.
Figure 4—figure supplement 3.
Figure 4—figure supplement 3.. Analysis of SagA-NlpC/p60 with purified peptidoglycan fragments.
(a–d) Isolated muropeptides from E. faecium were digested with buffer, NlpC/p60-C443A domain, and NlpC/p60 domain at 37°C for 1 hr. Tested substrates are as follows: (a) purified GlcNAc-MurNAc-L-Ala-D-isoGln-L-Lys (Di-tri); (b) purified GlcNAc-MurNAc-L-Ala-D-isoGln-L-Lys-D-Ala (Di-tetra); (c) purified GlcNAc-MurNAc-L-Ala-D-isoGln-L-Lys-D-Ala-D-Ala (Di-penta); (d) purified GlcNAc-MurNAc-L-Ala-D-isoGln-L-Lys-D-Ala-crosslinked-GlcNAc-MurNAc-L-Ala-D-isoGln-L-Lys (Di-tetra-Di-tri). Arrow indicates the appearance of product (GlcNAc-MurNAc-L-Ala-D-isoGln) after incubation with purified NlpC/p60 domain. Products were confirmed by mass spectrometry.
Figure 4—figure supplement 4.
Figure 4—figure supplement 4.. LC-MS analysis of SagA-NlpC/p60 activity on mutanolysin-digested peptidoglycan from E. faecium.
(a) LC-MS analysis of peptidoglycan isolated from E. faecium digested by mutanolysin followed by purified NlpC/p60 domain or NlpC/p60-C443A. Arrow indicates the increased abundance of peak, which corresponding to GlcNAc-MurNAc-L-Ala-D-isoGln, after incubation with purified NlpC/p60 domain. Numbers in peak are annotated in Supplementary file 1. (b) ESI-MS analysis of indicated arrow from Figure 4—figure supplement 4a, showing reduced form of [M + H]+ / [M + Na]+ of GlcNAc-MurNAc-L-Ala-D-isoGln. Mass of product is 698.31 Da in [M + H]+ and 720.29 Da in [M + Na]+. Inset shows chemical structure of GlcNAc-MurNAc-L-Ala-D-isoGln with exact mass. (c) Tandem mass spectrum of the molecular ion [M + H]+ = 698.31. Fragmented muropeptide is indicated with chemical structure.
Figure 5.
Figure 5.. SagA activity generates small muropeptides which activate NOD2 signaling and can enhance L. plantarum probiotic activity against C. difficile infection in vivo.
(a) HEK-Blue cells were treated with iE-DAP (50 μM, NOD1 ligand, light grey), MurNAc-L-Ala-D-isoGln (5 μM, MDP, NOD2 ligand, dark grey), synthetic GlcNAc-MurNAc-L-Ala-D-isoGln (5 μM, syn GlcNAc-MDP, cyan), crosslinked peptidoglycan fragment (disaccharide-tetrapeptide-disaccharide-tripeptide, purple) and products (GlcNAc-MurNAc-L-Ala-D-isoGln: GlcNAc-MDP or GlcNAc-MurNAc-L-Ala-D-isoGln-L-Lys-L-Lys-D-Ala: GlcNAc-M7P) at 5 μM for 12 hr. The measured firefly luciferase activity was divided by Renilla luciferase activity. The plotted values are relative ratios normalized to cells without ligand treatment, valued as 1. Data are shown as the mean ±SD from triplicate values. Data was analyzed using two-tailed t-test. *p≤0.05; **p≤0.01; ***p≤0.005; ****p≤0.001. (b) NOD2 activity in HEK-Blue cells with NF-κB activation after stimulation of cells with the MurNAc-L-Ala-D-isoGln (MDP), synthetic GlcNAc-MurNAc-L-Ala-D-isoGln, purified GlcNAc-MurNAc-L-Ala-D-isoGln, purified GlcNAc-MurNAc-L-Ala-D-isoGln-L-Lys-L-Lys-D-Ala, and purified crosslinked peptidoglycan fragment at different concentrations (0.05, 0.1, 0.5, 1, 2.5, 5 μM). Two-way ANOVA with a Sidak’s posttest comparing buffer groups to MDP, syn GlcNAc-MDP, GlcNAc-MDP and GlcNAc-MDP to GlcNAc-M7P, crosslinked peptidoglycan fragment groups. Buffer shown as a negative control. *p≤0.05; **p≤0.01; ***p≤0.005; ****p≤0.001 for all analyses. (c) Expression of wild-type SagA and mutants in L. plantarum cell pellet and supernatant by anti-His6 western blot. (d) Mice were given antibiotics (ampicillin, metronidazole, neomycin, vancomycin (AMNV) for 7 days and colonized with 108 CFU of indicated bacteria 36 hr prior to oral infection with 106 C. difficile. Pooled data from three independent experiments, n = 9–10 mice/group. Survival curve of C. difficile infected mice. Log-rank analysis, p-value shown comparing L. plantarum expressing SagA, compared to vector control, C443A, signal sequence mutant (ΔSS), respectively. *p≤0.05, **p≤0.01, ***p≤0.001 for all analyses.
Figure 5—figure supplement 1.
Figure 5—figure supplement 1.. Schematic of GlcNAc-MurNAc-L-Ala-D-isoGln (GlcNAc-MurNAc-dipeptide) synthesis.
Reagents and conditions: (a) Zn, THF/Ac2O/AcOH, RT, 5.5 hr (b) DBU, CH2Cl2, 0°C, 45 min, 38% over three steps. (c) NHS, EDC, DMF, RT, 16 hr, 51%. (d) (i) 2, TFA, CH2Cl2, RT, 2 hr. (ii) 5, DIEA, DMF, RT, 16 hr, 33%. (e) (i) NaOH(aq), 1,4-dioxane/MeOH/H2O, RT, 80 min. (ii) H2, 10% Pd/C, RT, 16 hr, 20% for two steps.
Figure 5—figure supplement 2.
Figure 5—figure supplement 2.. Chemical compound 3.
Figure 5—figure supplement 3.
Figure 5—figure supplement 3.. Chemical compound 4.
Figure 5—figure supplement 4.
Figure 5—figure supplement 4.. Chemical compound 5.
Figure 5—figure supplement 5.
Figure 5—figure supplement 5.. Chemical compound 6.
Figure 5—figure supplement 6.
Figure 5—figure supplement 6.. Chemical compound 7.
Figure 5—figure supplement 7.
Figure 5—figure supplement 7.. Western blot analysis of E. faecalis-sagA active site mutant.
(a) Stain-free staining and anti-His6 western blot of culture supernatants from different E. faecalis clones expressing plasmid-encoded active site mutant (C443A, H494A and H506A) or SagA-His6. (b) Coomassie-blue staining and anti-His6 western blot of culture supernatants (Sup.) and cell lysates from E. faecalis expressing chromosomally encoded active site mutant (C443A, H494A and H506A) or SagA-His6. SagA is mostly secreted, while active site mutant is expressed and secreted at very low or undetectable levels. Wild-type E. faecalis (wt) is shown as a control.
Figure 5—figure supplement 8.
Figure 5—figure supplement 8.. LC-MS analysis of mutanolysin-digested peptidoglycan fragments from L. plantarum.
LC-MS analysis of mutanolysin-digested peptidoglycan fragments from L. plantarum-vector, L. plantarum-SagA, L. plantarum-C443A, and L. plantarum-ΔSS.
Figure 5—figure supplement 9.
Figure 5—figure supplement 9.. Individual weight loss of antibiotic-treated mice against C. difficile infection in vivo.
Mice were given AMNV for 7d and colonized with 108 CFU of indicated bacteria 36 hr prior to oral infection with 106 C. difficile. Pooled data from three independent experiments, n = 9–10 mice/group. Weight loss of mice post-infection with C. difficile. L. plantarum expressing SagA, C443A and signal sequence mutant compared to vector control, respectively.
Figure 6.
Figure 6.. E. faecium and SagA generate small muropeptides that activate NOD2 signaling to inhibit enteric pathogens.
Endogenous GlcNAc-MDP from E. faecium can stimulate NOD2 directly and secreted peptidoglycan hydrolase SagA from E. faecium can also generate small muropeptides that can activate NOD2. Activated NOD2 controls immunity and barrier function in the gut to protect the host against enteric pathogens.

References

    1. Adams PD, Afonine PV, Bunkóczi G, Chen VB, Echols N, Headd JJ, Hung LW, Jain S, Kapral GJ, Grosse Kunstleve RW, McCoy AJ, Moriarty NW, Oeffner RD, Read RJ, Richardson DC, Richardson JS, Terwilliger TC, Zwart PH. The Phenix software for automated determination of macromolecular structures. Methods. 2011;55:94–106. doi: 10.1016/j.ymeth.2011.07.005. - DOI - PMC - PubMed
    1. Al Nabhani Z, Dietrich G, Hugot JP, Barreau F. Nod2: The intestinal gate keeper. PLOS Pathogens. 2017;13:e1006177. doi: 10.1371/journal.ppat.1006177. - DOI - PMC - PubMed
    1. Anantharaman V, Aravind L. Evolutionary history, structural features and biochemical diversity of the NlpC/P60 superfamily of enzymes. Genome Biology. 2003;4:R11. doi: 10.1186/gb-2003-4-2-r11. - DOI - PMC - PubMed
    1. Aramini JM, Rossi P, Huang YJ, Zhao L, Jiang M, Maglaqui M, Xiao R, Locke J, Nair R, Rost B, Acton TB, Inouye M, Montelione GT. Solution NMR structure of the NlpC/P60 domain of lipoprotein Spr from Escherichia coli: structural evidence for a novel cysteine peptidase catalytic triad. Biochemistry. 2008;47:9715–9717. doi: 10.1021/bi8010779. - DOI - PubMed
    1. Arias CA, Murray BE. The rise of the Enterococcus: beyond vancomycin resistance. Nature Reviews Microbiology. 2012;10:266–278. doi: 10.1038/nrmicro2761. - DOI - PMC - PubMed

Publication types

MeSH terms