. 2019 Jun 1;30(12):1555-1574.
doi: 10.1091/mbc.E18-10-0682. Epub 2019 Apr 10.

Analysis of the roles of phosphatidylinositol-4,5- bis phosphate and individual subunits in assembly, localization, and function of Saccharomyces cerevisiae target of rapamycin complex 2

Affiliations

Analysis of the roles of phosphatidylinositol-4,5- bis phosphate and individual subunits in assembly, localization, and function of Saccharomyces cerevisiae target of rapamycin complex 2

Maria Nieves Martinez Marshall et al. Mol Biol Cell. .

Erratum in

Abstract

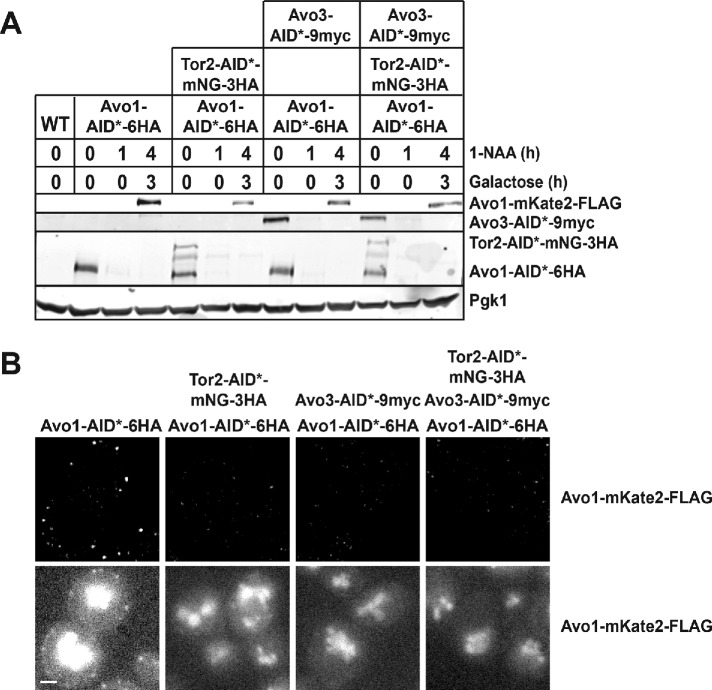
Eukaryotic cell survival requires maintenance of plasma membrane (PM) homeostasis in response to environmental insults and changes in lipid metabolism. In yeast, a key regulator of PM homeostasis is target of rapamycin (TOR) complex 2 (TORC2), a multiprotein complex containing the evolutionarily conserved TOR protein kinase isoform Tor2. PM localization is essential for TORC2 function. One core TORC2 subunit (Avo1) and two TORC2--associated regulators (Slm1 and Slm2) contain pleckstrin homology (PH) domains that exhibit specificity for binding phosphatidylinositol-4,5-bisphosphate (PtdIns4,5P2). To investigate the roles of PtdIns4,5P2 and constituent subunits of TORC2, we used auxin-inducible degradation to systematically eliminate these factors and then examined localization, association, and function of the remaining TORC2 components. We found that PtdIns4,5P2 depletion significantly reduced TORC2 activity, yet did not prevent PM localization or disassembly of TORC2. Moreover, truncated Avo1 (lacking its C-terminal PH domain) was still recruited to the PM and supported growth. Even when all three PH-containing proteins were absent, the remaining TORC2 subunits were PM-bound. Revealingly, Avo3 localized to the PM independent of both Avo1 and Tor2, whereas both Tor2 and Avo1 required Avo3 for their PM anchoring. Our findings provide new mechanistic information about TORC2 and pinpoint Avo3 as pivotal for TORC2 PM localization and assembly in vivo.


Figures

FIGURE 1:
FIGURE 1:
PtdIns4,5P2 is required for TORC2 activity, but not for PM localization of TORC2 subunits. (A) A culture growing in exponential phase of a strain (yNM706) expressing TIR1 from the TDH3 promoter integrated at the LEU2 locus and expressing MSS4-AID*-6HA from its native promoter at its endogenous locus was treated with 1-NAA (1 mM). At the indicated times, samples were withdrawn and analyzed by SDS–PAGE and immunoblotting with an anti-HA mAb to assess the level of Mss4-AID*-6HA (top panel) and with rabbit polyclonal anti-Pgk1 as a control for loading of equivalent amounts of total sample protein (bottom panel), as described in Materials and Methods. MSS4 TIR1 cells (yIZ082) (denoted “WT”) served as the negative control for antibody specificity. (B) Serial dilutions of cultures of an MSS4 TIR1 (yIZ082) strain and an otherwise isogenic MSS4-AID*-6HA TIR1 strain (yNM706) were spotted onto agar plates of SCD-T medium buffered with 50 mM K2HPO4/KH2PO4 (pH 6) and containing either DMSO alone (-) or 1-NAA (1 mM final concentration) dissolved in an equal volume of the same solvent (+ 1-NAA), incubated for 2 d at 30°C, and photographed. (C) MSS4-AID*-6HA TIR1 cells (yNM706) carrying a CEN plasmid (pGFP-PH-7) expressing GFP-PHPLCδ1 under control of the CUP1 promoter were grown in SCD-T-U treated with either vehicle (DMSO) or 1 mM 1-NAA in the same solvent. After 30 min, GFP-PHPLCδ1 expression was induced by addition of CuSO4 (final concentration 100 μM) and, after further incubation for 90 min, the cells were examined using a conventional epifluorescence microscope, as described in Materials and Methods. Representative cells are shown. Scale bar, 2 μm. (D) An MSS4 TIR1 strain (yIZ082) and an MSS4-AID*-6HA TIR1 strain (yNM706), each carrying a plasmid (pAEA419) expressing Ypk15A-myc from the YPK1 promoter in the vector pRS316, were grown to midexponential phase in SCD-T-U and at time 0 exposed to 1-NAA (final concentration 1 mM) in DMSO. Aliquots of these cultures were withdrawn at the indicated times and lysed, and samples of these extracts containing equivalent amounts of protein were resolved by phosphate-affinity SDS–PAGE and analyzed by immunoblotting (top panel), as described in Materials and Methods. In parallel, the same samples also were resolved by standard SDS–PAGE and analyzed by immunoblotting with appropriate antibodies to confirm depletion of Mss4-AID*-6HA (anti-HA mAb), equivalent Ypk15A expression (anti-myc mAb), and equal sample loading (polyclonal anti-Pgk1 antibody) (bottom panels). MSS4 TIR1 cells (yIZ082) carrying empty vector pRS316 (denoted as -) served as the negative control for antibody specificity. Values below each of the lanes on the right are the relative level of Ypk1 phospho-isoforms (boxed in red), normalized to the Pgk1 loading control, where the value at time 0 before 1-NAA addition was set to 1.00 (one of two independent experiments is shown). (E) Derivatives of an MSS4-AID*-6HA TIR1 strain (yNM706) expressing from their native promoters at their endogenous loci either Tor2-mNG-3HA (yNM986), Avo1-GFP (yNM1073), Avo3-GFP (yNM1065), or Avo2-GFP (yNM1066), as indicated, were grown, treated, and lysed and samples of the resulting extracts were analyzed by immunoblotting, using the same control (“WT”) as in A, except that, where appropriate, anti-GFP antibodies were used to detect GFP-tagged proteins. (F) Three of the same MSS4-AID*-6HA TIR1 strains described in E, namely expressing either Avo1-GFP (yNM1073), Avo3-GFP (yNM1065), or Avo2-GFP (yNM1066), were examined immediately before (0 min) and then 60 and 120 min after their exposure to 1 mM 1-NAA using HiLo fluorescence microscopy, as described in Materials and Methods. Representative cells are shown. Scale bar, 2 μm. (G) An MSS4-AID*-6HA TIR1 strain (yNM1090) simultaneously expressing from their native promoters at their endogenous loci Tor2-mNG-3HA, Slm1-mKate2, and Pil1-BFP were treated and examined as in F. Representative cells are shown. Scale bar, 2 μm.
FIGURE 2:
FIGURE 2:
The PH domain of Avo1 is dispensable for its PM association and its function. (A) A culture growing in exponential phase of a strain (yNM718) expressing TIR1 from the TDH3 promoter integrated at the LEU2 locus and expressing Avo1-AID*-6HA from its native promoter at its endogenous locus was treated with 1-NAA (1 mM). At the indicated times, samples were withdrawn and analyzed by SDS–PAGE and immunoblotting with an anti-HA mAb to assess the level of Avo1-AID*-6HA (top panel) and with rabbit polyclonal anti-Pgk1 as a control for loading of equivalent amounts of total sample protein (bottom panel), as described in Materials and Methods. AVO1 TIR1 cells (yIZ082) (denoted “WT”) served as the negative control for antibody specificity. (B) Serial dilutions of cultures of an AVO1 TIR1 strain (yIZ082), an AVO1-6HA strain (yNM928), an AVO1-6HA TIR1 strain (yNM927), an AVO1-AID*-6HA strain (yNM784), and an AVO1-AID*-6HA TIR1 strain (yNM718), as indicated, were spotted onto agar plates of SCD-T medium buffered with 50 mM K2HPO4/KH2PO4 (pH 6) and containing either DMSO alone (-) or 1-NAA (1 mM final concentration) dissolved in an equal volume of the same solvent (+ 1-NAA), incubated for 2 d at 30˚C, and photographed. (C) Cells of an AVO1-AID*-6HA TIR1 strain (yNM718) were grown to midexponential phase in SCD-T and treated with 1 mM 1-NAA, and at the indicated times samples were withdrawn, fixed, stained with an F-actin-binding probe, rhodamine-labeled phalloidin, and examined using a conventional epifluorescence microscope, as described in Materials and Methods. Representative cells are shown. Scale bar, 2 μm. (D) An AVO1-AID*-6HA TIR1 strain (yNM718) carrying a plasmid (pAEA419) expressing Ypk15A-myc from the YPK1 promoter in the vector pRS316 was grown to mid-exponential phase in SCD-T-U and at time 0 exposed to 1-NAA (1 mM final concentration) in DMSO. Aliquots of these cultures were withdrawn at the indicated times, lysed, and samples of these extracts containing equivalent amounts of protein were resolved by phosphate-affinity SDS–PAGE and analyzed by immunoblotting (top panel), as described in Materials and Methods. In parallel, the same samples also were resolved by standard SDS–PAGE and analyzed by immunoblotting with appropriate antibodies to confirm depletion of Avo1-AID*-6HA (anti-HA mAb) and equal sample loading (polyclonal anti-Pgk1 antibody) (bottom panels). AVO1 TIR1 cells (yIZ082) carrying empty vector pRS316 (denoted WT) served as the negative control for antibody specificity. Values below each of the lanes on the right are the relative level of Ypk1 phospho-isoforms (boxed in red), normalized to the Pgk1 loading control, where the value at time 0 before 1-NAA addition was set to 1.00 (one of three independent experiments is shown). (E) Cultures of AVO1-AID*-6HA TIR1 cells (yNM718) expressing from the GALS promoter in the vector pRS416, as indicated, either full-length Avo1-mKate2-FLAG (pAEA399) or a truncated version lacking the C-terminal residues 1059–1176 of Avo1, which removes its PH domain (residues 1065–1169), Avo1ΔPH-mKate2-FLAG (pNM160), growing exponentially in SC-T-U medium containing 2% raffinose-0.2% sucrose as the carbon source and buffered with 50 mM K2HPO4/KH2PO4 (pH 6), were treated with 1 mM 1-NAA. After 1 h, galactose was added (2% final concentration) to induce expression of the plasmid-borne Avo1 variants. After 3 h, the cells were harvested and lysed, and samples of the resulting extracts were resolved by SDS–PAGE and analyzed by immunoblotting with anti-HA to confirm removal of Avo1-AID*-6HA, with anti-FLAG to confirm production of the mKate2-FLAG-tagged Avo1 variants, and with anti-Pgk1 to confirm equal sample loading. AVO1 TIR1 cells (yIZ082) carrying empty vector pRS416 (denoted WT) was the negative control for antibody specificity. (F) Samples of the same AVO1-AID*-6HA TIR1 cells expressing the indicated mKate2-FLAG-tagged Avo1 variants, as in E, from the final (4 h) time point were examined by HiLo fluorescence microscopy. Representative cells are shown. Scale bar, 2 μm. (G) Serial dilutions of cultures of an AVO1 TIR1 strain (in this case, TIR1 was inserted at the HIS3 locus; yNM793) carrying an empty LEU2-marked vector (pRS315; denoted -) and an AVO1-AID*-6HA TIR1 strain (yNM786) (also with TIR1 inserted at the HIS3 locus) carrying, as indicated, either the same empty vector (-) or the same plasmid expressing from the native AVO1 promoter either full-length Avo1-9myc (pLZ3) or Avo1(ΔPH)-9myc (pLZ11), were spotted onto agar plates of SCD-T-L medium buffered with 50 mM K2HPO4/KH2PO4 (pH 6) and containing either DMSO alone (-) or 1-NAA (1 mM final concentration) dissolved in an equal volume of the same solvent (+ 1-NAA), incubated for 2 d at 30°C, and photographed.
FIGURE 3:
FIGURE 3:
PH domain–containing proteins Avo1, Slm1, and Slm2 are dispensable for PM localization of TORC2 subunits. (A) Exponentially growing cultures of AVO1-AID*-6HA TIR1 cells also expressing from their native promoter at their endogenous locus either Tor2-mNG-3HA (yNM977), Avo3-GFP (yNM888), Avo2-GFP (yNM847), or Bit61-GFP (yNM886), as indicated, were examined by HiLo fluorescence microscopy immediately before (0 min) or at the indicated times after treatment of the cultures with 1 mM 1-NAA. Representative cells are shown. Scale bar, 2 μm. (B) Extracts from the same cells as in A were resolved by SDS–PAGE and analyzed by immunoblotting with anti-HA antibodies to confirm removal of Avo1-AID*-6HA and level of expression of Tor2-mNG-3HA, with anti-GFP antibodies to assess the level of expression of Avo3-GFP, Avo2-GFP, and Bit61-GFP, and with anti-Pgk1 to confirm equal sample loading. AVO1 TIR1 cells (yIZ082) (denoted WT) were used as the negative control for specificity of the immunoblots. (C) An Avo1-AID*-6HA TIR1 strain expressing Tor2-mNG-3HA from its native promoter at its endogenous locus (yNM992), an otherwise isogenic strain also expressing Avo3-3C-3FLAG from its endogenous locus (yNM994), and an AVO1 AVO3 TOR2 TIR1 control strain (yIZ082), were grown on phosphate-buffered SCD-T to mid-exponential phase and then treated with either solvent (DMSO) alone (0) or 1 mM 1-NAA in the same solvent for 60 min, as indicated. Cells were then harvested and lysed, and FLAG-tagged proteins were immuno-isolated from the extracts using agarose beads coated with anti-FLAG antibodies as described in Materials and Methods. Samples of the bound proteins were solubilized, resolved by SDS–PAGE on an 8% gel, and analyzed by immunoblotting with anti-HA and anti-FLAG antibodies (as well as with anti-Pgk1 antibodies to confirm equal protein loading). (D) Exponentially growing cultures of Avo1-AID*-6HA Slm1-AID*-9myc slm2Δ TIR1 cells expressing from their native promoter at their endogenous locus either Avo3-GFP (yNM1026) or Avo2-mKate2 (yNM862) were examined by HiLo fluorescence microscopy immediately before (0 min) or at the indicated times after treatment of the cultures with 1 mM 1-NAA. Representative cells are shown. Scale bar, 2 μm. (E) Extracts from the same cells as in C, and the same control for antibody specificity as in B, were resolved by SDS–PAGE and analyzed by immunoblotting with anti-HA antibodies to confirm removal of Avo1-AID*-6HA, with anti-myc antibodies to confirm removal of Slm1-AID*-9myc, and with anti-Pgk1 to confirm equal sample loading.
FIGURE 4:
FIGURE 4:
PM localization of Avo3 does not require Tor2, but PM localization of Tor2 and other TORC2 subunits requires Avo3. (A) A culture of a strain (yAEA346) expressing TIR1 from the TDH3 promoter integrated at the LEU2 locus, TOR2-AID*-mNG-3HA from its native promoter at its endogenous locus, and Ypk15A-myc from plasmid pAEA419, was grown in SCD-T-U at 30°C to midexponential phase and then treated with 1-NAA (1 mM). At the indicated times, aliquots of these cultures were withdrawn and lysed, and samples of these extracts containing equivalent amounts of protein were resolved by phosphate-affinity SDS–PAGE and analyzed by immunoblotting (top panel), as described in Materials and Methods. In parallel, the same samples were also resolved by standard SDS–PAGE and analyzed by immunoblotting with appropriate antibodies to confirm depletion of Tor2-AID*-3HA (anti-HA mAb) and equal sample loading (polyclonal anti-Pgk1 antibody; bottom panels). TOR2 TIR1 cells (yIZ082) carrying empty vector pRS316 (denoted WT) were used as the negative control for specificity of the immunoblots. (B) Exponentially growing cultures of TOR2-AID*-mNG-3HA TIR1 cells also expressing from their native promoter at their endogenous locus either Avo3-mKate2 (yNM1035) (top panels) or Avo2-mKate2 (yNM1034) (bottom panels) were examined by HiLo fluorescence microscopy immediately before (0 min) or at the indicated times after treatment of the cultures with 1 mM 1-NAA. Representative cells are shown. Scale bar, 2 μm. (C) A culture of a strain (yNM858) expressing TIR1 from the TDH3 promoter integrated at the LEU2 locus, AVO3-AID*-6HA from its native promoter at its endogenous locus, and Ypk15A-myc from plasmid pAEA419 was grown in SCD-T-U at 30°C to midexponential phase and then treated with 1-NAA (1 mM). At the indicated times, aliquots of these cultures were withdrawn and lysed, and samples of these extracts containing equivalent amounts of protein were resolved by phosphate-affinity SDS–PAGE and analyzed by immunoblotting (top panel), as described in Materials and Methods. In parallel, the same samples also were resolved by standard SDS–PAGE and analyzed by immunoblotting with appropriate antibodies to confirm depletion of Avo3-AID*-3HA (anti-HA mAb) and equal sample loading (polyclonal anti-Pgk1 antibody; bottom panels). TOR2 TIR1 cells (yIZ082) carrying empty vector pRS316 (denoted WT) were used as the negative control for antibody specificity. (D) Exponentially growing cultures of AVO3-AID*-6HA TIR1 cells also expressing from their native promoter at their endogenous locus either Tor2-mNG-3HA (yNM975), Avo1-GFP (yNM998), Avo2-GFP (yNM1031), or Bit61-GFP (yNM884), as indicated, were examined by HiLo fluorescence microscopy immediately before (0 min) or at the indicated times after treatment of the cultures with 1 mM 1-NAA. Representative cells are shown. Scale bar, 2 μm. (E) Extracts from the same cells as in D were resolved by SDS–PAGE and analyzed by immunoblotting with anti-HA antibodies to confirm removal of Avo3-AID*-6HA and level of expression of Tor2-mNG-3HA, with anti-GFP antibodies to assess the level of expression of Avo1-GFP, Avo2-GFP and Bit61-GFP, and with anti-Pgk1 to confirm equal sample loading. AVO1 TIR1 cells (yIZ082) (denoted WT) were used as the negative control for antibody specificity.
FIGURE 5:
FIGURE 5:
Absence of either Avo3 or Tor2 prevents recruitment of Avo1 to the PM. (A) Cultures of AVO1-AID*-6HA TIR1 cells (yNM718) expressing from the GALS promoter Avo1-mKate2-FLAG (pAEA399) in the vector pRS416, AVO1-AID*-6HA TOR2-AID*-mNG-3HA TIR1 cells (yNM1040) carrying pAEA399, AVO1-AID*-6HA AVO3-AID*-9MYC TIR1 cells (yNM1064) carrying pAEA399, and AVO1-AID*-6HA TOR2-AID*-mNG-3HA AVO3-AID*-9MYC TIR1 cells (yNM1056) carrying pAEA399, as indicated, grown to midexponential phase in SC-T-U medium containing 2% raffinose–0.2% sucrose as the carbon source and buffered with 50 mM K2HPO4/KH2PO4 (pH 6), were treated with 1 mM 1-NAA. After 1 h, galactose was added (2% final concentration) to induce expression of the plasmid-borne Avo1-mKate2-FLAG. After 3 h, the cells were harvested and lysed, and samples of the resulting extracts were resolved by SDS–PAGE and analyzed by immunoblotting with anti-HA to confirm removal of Avo1-AID*-6HA and Tor2-AID*-mNG-3HA, with anti-myc to confirm removal of Avo3-AID*-9myc, with anti-FLAG to confirm production of the mKate2-FLAG-tagged Avo1, and with anti-Pgk1 to confirm equal sample loading. AVO1 TIR1 cells (yIZ082) carrying empty vector pRS416 (denoted WT) served as the negative control for antibody specificity. (B) Samples of the same cells as in A from the final (4 h) time point were examined by HiLo fluorescence microscopy with (top panels) and without (bottom panels) subtraction of the nonspecific cellular background signal. Representative cells are shown. Scale bar, 2 μm.
FIGURE 6:
FIGURE 6:
PM recruitment of Avo3 is independent of both Avo1 and Tor2. (A) Cultures of AVO3-AID*-9MYC TIR1 cells (yNM1057) expressing from the GALS promoter Avo3-mKate2-FLAG (pAEA400) in the vector pRS416, AVO3-AID*-9MYC AVO1-AID*-6HA TIR1 cells (yNM1064) carrying pAEA400, AVO3-AID*-9MYC TOR2-AID*-mNG-3HA TIR1 cells (yNM1062) carrying pAEA400, and AVO3-AID*-9MYC AVO1-AID*-6HA TOR2-AID*-mNG-3HA TIR1 cells (yNM1056) carrying pAEA400, as indicated, grown to midexponential phase in SC-T-U medium containing 2% raffinose–0.2% sucrose as the carbon source and buffered with 50 mM K2HPO4/KH2PO4 (pH 6), were treated with 1 mM 1-NAA. After 1 h, galactose was added (2% final concentration) to induce expression of the plasmid-borne Avo1-mKate2-FLAG. After 2 h, the cells were harvested and lysed, and samples of the resulting extracts resolved by SDS–PAGE and analyzed by immunoblotting with anti-myc to confirm removal of Avo3-AID*-9myc, with anti-HA to confirm removal of Avo1-AID*-6HA and Tor2-AID*-mNG-3HA, with anti-FLAG to confirm production of the mKate2-FLAG-tagged Avo3, and with anti-Pgk1 to confirm equal sample loading. AVO3 TIR1 cells (yIZ082) carrying empty vector pRS416 (denoted WT) served as the negative control for antibody specificity. (B) Samples of the same cells as in A from the final (3 h) time point were examined by HiLo fluorescence microscopy with (top panels) and without (bottom panels) subtraction of the nonspecific cellular background signal. Representative cells are shown. Scale bar, 2 μm.
FIGURE 7:
FIGURE 7:
N-terminal ARM repeats in Avo3 are required for its PM association. (A) Schematic depiction of full-length Avo3 and the set of N-terminal truncations, one internal deletion, and one internal fragment, all tagged at their C-terminus with mKate2-FLAG (not shown), that were examined in this study. Dark gray, ARM repeat domain. (B) An AVO3-AID*-9MYC TIR1 strain (yNM1057) was transformed with empty vector pRS416, or plasmids expressing from the GALS promoter either full-length Avo3-mKate2-FLAG (pAEA400), Avo3(Δ2-300)-mKate2-FLAG (pNM166), Avo(3Δ2-500)-mKate2-FLAG (pNM165), Avo3(Δ2-700)-mKate2-FLAG (pNM164), Avo3(Δ2-810)-mKate2-FLAG (pNM167), Avo3(Δ2-910)-mKate2-FLAG (pNM163), Avo3(Δ2-1100)-mKate2-FLAG (pNM162), Avo3(Δ300-500)-mKate2-FLAG (pNM170), or Avo3(300-500)-mKate2-FLAG (pNM168), as indicated. The cultures were grown in phosphate-buffered SCRS-T-U to mid-exponential phase and treated with 1 mM 1-NAA to induce Avo3-AID*-9myc degradation. After 1 h, induction of each plasmid-borne mKate2-FLAG construct was induced by addition of galactose (2% final concentration). After incubation for 2 h, the cells were examined by HiLo fluorescence microscopy, as described in Materials and Methods. Scale bars, 2 μm. (C) Samples of the same cells as in B expressing either empty vector, full-length Avo3, or the set of N-terminal truncations depicted in A were spotted on phosphate-buffered SCRS-T-U plates containing DMSO alone (-) (left) or 1 mM 1-NAA in same volume of DMSO (+ 1-NAA) (right). After 2 d, the plates were photographed. (D) As in C, for the same cells as in B expressing either empty vector, full-length Avo3, the internal deletion, or the fragment depicted in A.

References

    1. Aronova S, Wedaman K, Aronov PA, Fontes K, Ramos K, Hammock BD, Powers T. (2008). Regulation of ceramide biosynthesis by TOR complex 2. Cell Metab , 148–158. - PMC - PubMed
    1. Audhya A, Emr SD. (2003). Regulation of PI4,5P2 synthesis by nuclear-cytoplasmic shuttling of the Mss4 lipid kinase. EMBO J , 4223–4236. - PMC - PubMed
    1. Audhya A, Loewith R, Parsons AB, Gao L, Tabuchi M, Zhou H, Boone C, Hall MN, Emr SD. (2004). Genome-wide lethality screen identifies new PI4,5P2 effectors that regulate the actin cytoskeleton. EMBO J , 3747–3757. - PMC - PubMed
    1. Ballon DR, Flanary PL, Gladue DP, Konopka JB, Dohlman HG, Thorner J. (2006). DEP-domain-mediated regulation of GPCR signaling responses. Cell , 1079–1093. - PubMed
    1. Baretić D, Berndt A, Ohashi Y, Johnson CM, Williams RL. (2016). Tor forms a dimer through an N-terminal helical solenoid with a complex topology. Nat Commun , 11016. - PMC - PubMed

Publication types

MeSH terms

Substances