. 2019 Jul 1;122(1):66-80.
doi: 10.1152/jn.00534.2018. Epub 2019 Apr 10.

Stable memory and computation in randomly rewiring neural networks

Affiliations

Stable memory and computation in randomly rewiring neural networks

Daniel Acker et al. J Neurophysiol. .

Abstract

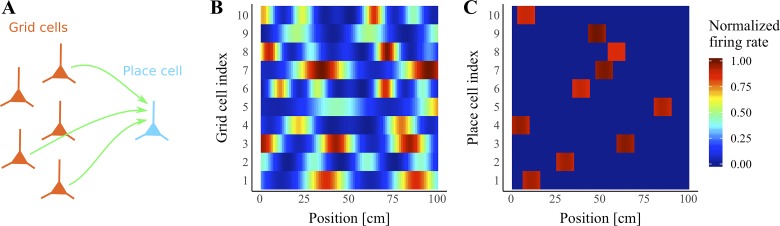
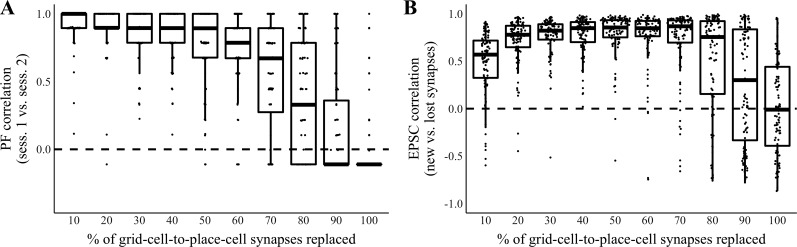
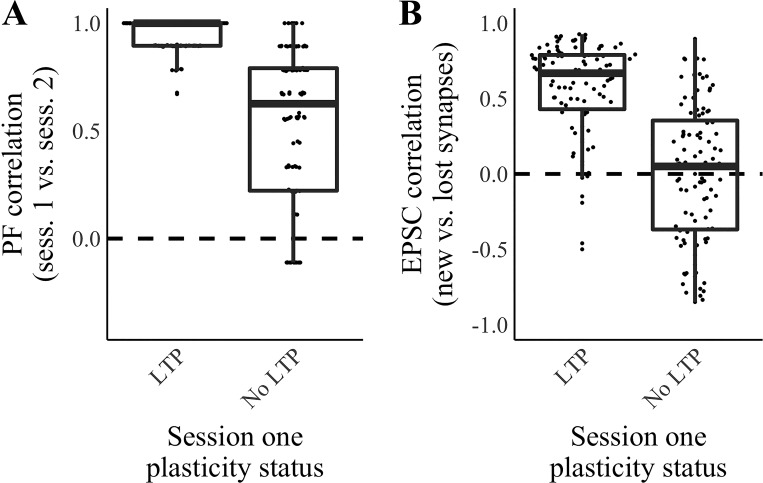
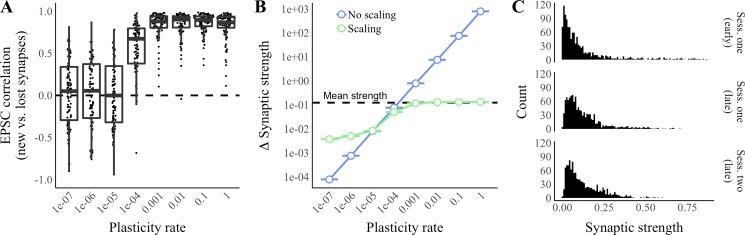
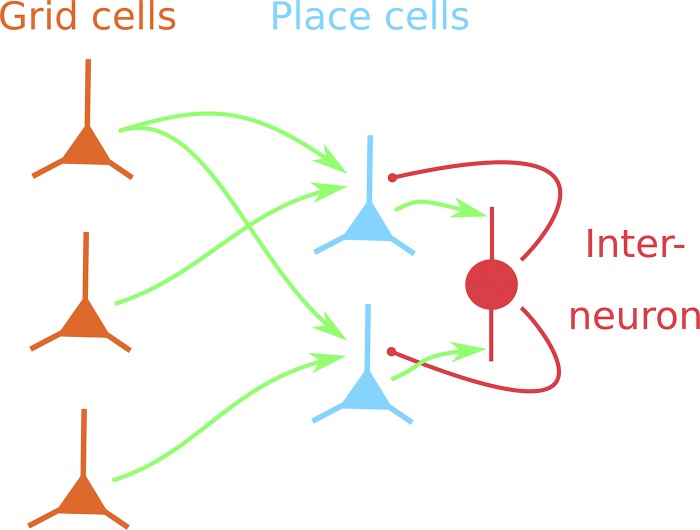
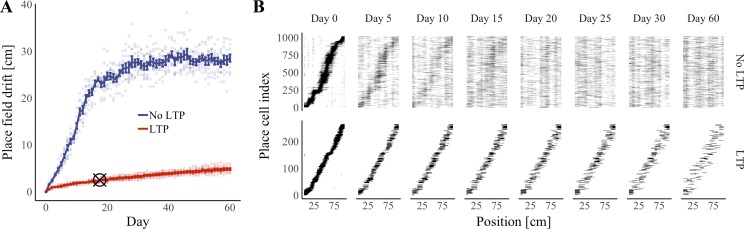
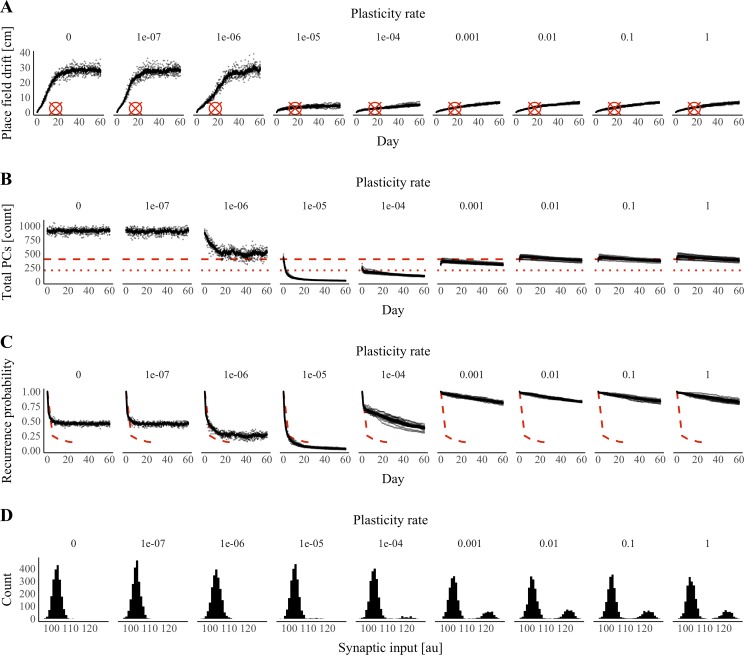
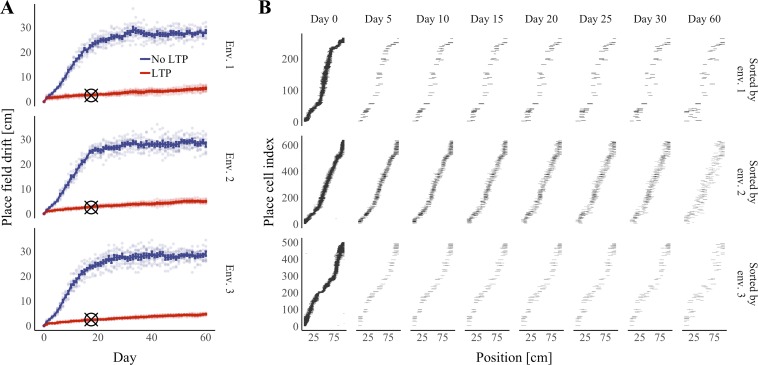
Our brains must maintain a representation of the world over a period of time much longer than the typical lifetime of the biological components producing that representation. For example, recent research suggests that dendritic spines in the adult mouse hippocampus are transient with an average lifetime of ~10 days. If this is true, and if turnover is equally likely for all spines, ~95% of excitatory synapses onto a particular neuron will turn over within 30 days; however, a neuron's receptive field can be relatively stable over this period. Here, we use computational modeling to ask how memories can persist in neural circuits such as the hippocampus and visual cortex in the face of synapse turnover. We demonstrate that Hebbian plasticity during replay of presynaptic activity patterns can integrate newly formed synapses into pre-existing memories. Furthermore, we find that Hebbian plasticity during replay is sufficient to stabilize the receptive fields of hippocampal place cells in a model of the grid-cell-to-place-cell transformation in CA1 and of orientation-selective cells in a model of the center-surround-to-simple-cell transformation in V1. Together, these data suggest that a simple plasticity rule, correlative Hebbian plasticity of synaptic strengths, is sufficient to preserve neural representations in the face of synapse turnover, even in the absence of activity-dependent structural plasticity. NEW & NOTEWORTHY Recent research suggests that synapses turn over rapidly in some brain structures; however, memories seem to persist for much longer. We show that Hebbian plasticity of synaptic strengths during reactivation events can preserve memory in computational models of hippocampal and cortical networks despite turnover of all synapses. Our results suggest that memory can be stored in the correlation structure of a network undergoing rapid synaptic remodeling.

Keywords: Hebbian; memory; place cell; structural plasticity; synapse turnover.


Conflict of interest statement

No conflicts of interest, financial or otherwise, are declared by the authors.

Figures

Fig. 1.
Fig. 1.
Feedforward convergent place-cell model of the grid-to-place-cell transformation. A: each individual place cell (blue) in CA1 receives synaptic input (green arrows) from many grid cells (orange) in entorhinal cortex. B: as the simulated animal moves through a linear enclosure, the firing rates of the grid cells vary as periodic functions of position such that most grid cells have multiple peak firing locations. Each row depicts the activity of a single representative grid cell. C: as the simulated animal moves, each place cell’s firing rate varies as the thresholded sum of its synaptic inputs from grid cells. The result of this process is that most place cells have a single firing field in the enclosure. Each row depicts the activity of a single place cell receiving inputs as shown in A.
Fig. 2.
Fig. 2.
Retained synapses provide a teaching signal to nascent synapses. Activity in a single-place-cell model of the grid-cell-to-place-cell transformation was simulated over 2 sessions (sess.) in a linear enclosure. Hebbian plasticity occurred during sessions, and 10–100% of synapses turned over between sessions. A: place-field (PF) correlation (Pearson’s correlation between the cell’s responses during the late phases of sessions 1 and 2) vs. the percentage of synapses replaced between sessions. In these and all box plots, the extent of the rectangle represents the interquartile range, the thick bar represents the median, and the extent of the whiskers represents 3 times the interquartile range. Whisker range is truncated to the minimum or maximum value if that is within 3 times the interquartile range. n = 100 Simulations per condition. B: excitatory postsynaptic current (EPSC) correlation (Pearson’s correlation between the sum of synaptic inputs by position during the late phase of session 1 at synapses removed due to turnover between sessions and the sum of synaptic inputs by position during the late phase of session 2 at synapses formed due to turnover between sessions) vs. the percentage of synapses replaced between sessions. n = 100 Simulations per condition.
Fig. 3.
Fig. 3.
Training nascent synapses requires prior plasticity in the novel environment. Activity in a single-place-cell model of the grid-cell-to-place-cell transformation was simulated over 2 sessions (sess.) in a linear enclosure. Hebbian plasticity occurred during sessions, and 10% of synapses turned over between sessions. In 50% of the simulations, Hebbian plasticity was omitted during session 1 while still present for all synapses in session 2. A: place-field (PF) correlation (Pearson’s correlation between the cell’s responses during the late phases of sessions 1 and 2) vs. a Boolean value indicating whether plasticity occurred during session 1 of each simulation. n = 100 Simulations per condition. B: excitatory postsynaptic current (EPSC) correlation (Pearson’s correlation between the sum of synaptic inputs by position during the late phase of session 1 at synapses removed due to turnover between sessions and the sum of synaptic inputs by position during the late phase of session 2 at synapses formed due to turnover between sessions) vs. a Boolean value indicating whether plasticity occurred during session 1 of each simulation. n = 100 Simulations per condition. LTP, long-term potentiation.
Fig. 4.
Fig. 4.
Effects of plasticity rate on the training of nascent synapses. Activity in a single-place-cell model of the grid-cell-to-place-cell transformation was simulated over 2 sessions (Sess.) in a linear enclosure. Hebbian plasticity occurred during sessions, and 10% of synapses turned over between sessions. A: excitatory postsynaptic current (EPSC) correlation (Pearson’s correlation between the sum of synaptic inputs by position during the late phase of session 1 at synapses removed due to turnover between sessions and the sum of synaptic inputs by position during the late phase of session 2 at synapses formed due to turnover between sessions) vs. the plasticity rate. n = 100 Simulations per condition. B: absolute changes in synaptic strength from the early to the late phase of session 1 vs. plasticity rate in the presence or absence of scaling. Error bars represent means ± SE across the strengths of synapses pooled from 10 simulations. Dashed line represents the overall mean synaptic strength before plasticity. C: representative distributions of synaptic strengths across all synapses by experimental stage in 1 simulation with a plasticity rate of 1e−4.
Fig. 5.
Fig. 5.
Multi-place-cell, feedback-inhibition model of the grid-cell-to-place-cell transformation. Many place cells (blue) in CA1 receive synaptic input (green arrows) from many grid cells (orange) in entorhinal cortex. Place cells in CA1 form convergent, excitatory connections (green arrows) onto interneurons in CA1, which, in turn, form divergent, inhibitory connections (red arrows) onto the place cells. Interneuron-mediated feedback inhibition controls which cells fire at particular locations in an enclosure.
Fig. 6.
Fig. 6.
Hebbian plasticity improves place-field stability. Activity in a feedback-inhibition, grid-cell-to-place-cell model was simulated over a period of 61 days with both Hebbian plasticity and synapse turnover. A: median place-field drift from day 0 vs. time and plasticity condition. Hebbian plasticity steps were omitted in the “No LTP” condition. Error bars represent means ± the standard error of the mean for median drift across simulations. Points represent median drift in individual simulations. Cross hairs indicate the experimentally determined median drift across days 530 in 5-day increments; cross hairs are positioned on the x-axis at the center of this time window (17.5 days). n = 10 Simulations per condition. B: representative place-cell firing fields sorted by place-field centroid on day 0. Black areas represent regions of the enclosure in which a cell was active. LTP, long-term potentiation.
Fig. 7.
Fig. 7.
Effects of plasticity rate on place-code properties. Activity in a feedback-inhibition, grid-cell-to-place-cell model was simulated over a period of 61 days with both Hebbian plasticity and synapse turnover. Plasticity rate varied over a 10-million-fold range across simulations. A: median place-field drift from day 0 vs. time and the plasticity rate taken during the late phase (after plasticity) on each day. Cross hairs indicate the experimentally determined median drift over days 530 in 5-day increments. Cross hairs are positioned on the x-axis at the center of this time window (17.5 days). B: total number of place cells (PCs; CA1 cells with place fields) vs. time and the plasticity rate taken during the late phase (after plasticity) on each day. Dashed lines indicate the experimentally determined number of place cells per 2,000 cells when the animal is moving in 1 direction (small dashes, 10%) or either direction (large dashes, 20%). C: probability of place-cell recurrence (the fraction of CA1 cells with place fields on both day 0 and a later date) vs. the time and the plasticity rate taken during the late phase (after plasticity) on each day. Dashed lines indicate experimentally determined values from Ziv et al. (2013). AC: n = 10 simulations per plasticity rate; data from the same set of simulations were used across panels; error bars represent means ± the standard error of the mean across simulations, and points represent values from individual simulations. D: histograms of mean synaptic input per cell across positions on day 60 at several plasticity rates. au, Arbitrary units.
Fig. 8.
Fig. 8.
Hebbian plasticity improves place-field stability across multiple environments (Env.). Activity in a feedback-inhibition, grid-cell-to-place-cell model was simulated in 3 separate linear enclosure environments over a period of 61 days with both Hebbian plasticity and synapse turnover. A: median place-field drift from day 0 vs. time in each environment. Hebbian plasticity steps were omitted in the “No LTP” condition. Error bars represent means ± the standard error of the mean for median drift across simulations. Points represent median drift in individual simulations. Cross hairs indicate the experimentally determined median drift across days 530 in 5-day increments; cross hairs are positioned on the x-axis at the center of this time window (17.5 days). n = 10 Simulations per condition. B: representative place-cell firing fields from the “LTP” condition sorted by place-field centroid on day 0 in each of the 3 environments. Black areas represent regions of the enclosure in which a cell was active. LTP, long-term potentiation.
Fig. 9.
Fig. 9.
Persistent orientation tuning in a lateral geniculate nucleus-to-V1 model. A: visual receptive fields of 3 representative V1 cells on days 0 and 118. Excitation is the amount of synaptic input received by the V1 cell in response to bright (“On”) or dark (“Off”) spot on the visual field. B: synaptic input received by cells in A at their most excited phase across orientations on days 0 (solid lines) and 118 (dashed lines). C: firing rates of cells in A at their most-excited phase across orientations on days 0 (solid lines) and 118 (dashed lines). D: original vs. final preferred orientation for all V1 cells. E: cumulative probability density plot of observed orientation-preference shifts (red) and a shuffled condition (blue). F: histograms of original and final synaptic strengths at realized synapses across all cells. au, Arbitrary units; PDF, probability density function; Stim., stimulus.

Similar articles

Cited by

References

    1. Abraham WC, Logan B, Greenwood JM, Dragunow M. Induction and experience-dependent consolidation of stable long-term potentiation lasting months in the hippocampus. J Neurosci 22: 9626–9634, 2002. doi:10.1523/JNEUROSCI.22-21-09626.2002. - DOI - PMC - PubMed
    1. Agnihotri NT, Hawkins RD, Kandel ER, Kentros C. The long-term stability of new hippocampal place fields requires new protein synthesis. Proc Natl Acad Sci USA 101: 3656–3661, 2004. doi:10.1073/pnas.0400385101. - DOI - PMC - PubMed
    1. Attardo A, Fitzgerald JE, Schnitzer MJ. Impermanence of dendritic spines in live adult CA1 hippocampus. Nature 523: 592–596, 2015. doi:10.1038/nature14467. - DOI - PMC - PubMed
    1. Attardo A, Lu J, Kawashima T, Okuno H, Fitzgerald JE, Bito H, Schnitzer MJ. Long-term consolidation of ensemble neural plasticity patterns in hippocampal area CA1. Cell Rep 25: 640–650.e2, 2018. doi:10.1016/j.celrep.2018.09.064. - DOI - PubMed
    1. Bezaire MJ, Soltesz I. Quantitative assessment of CA1 local circuits: knowledge base for interneuron-pyramidal cell connectivity. Hippocampus 23: 751–785, 2013. doi:10.1002/hipo.22141. - DOI - PMC - PubMed

Publication types

LinkOut - more resources