. 2019 Jun 1;121(6):2341-2357.
doi: 10.1152/jn.00738.2018. Epub 2019 Apr 10.

Autonomous patch-clamp robot for functional characterization of neurons in vivo: development and application to mouse visual cortex

Affiliations

Autonomous patch-clamp robot for functional characterization of neurons in vivo: development and application to mouse visual cortex

Gregory L Holst et al. J Neurophysiol. .

Abstract

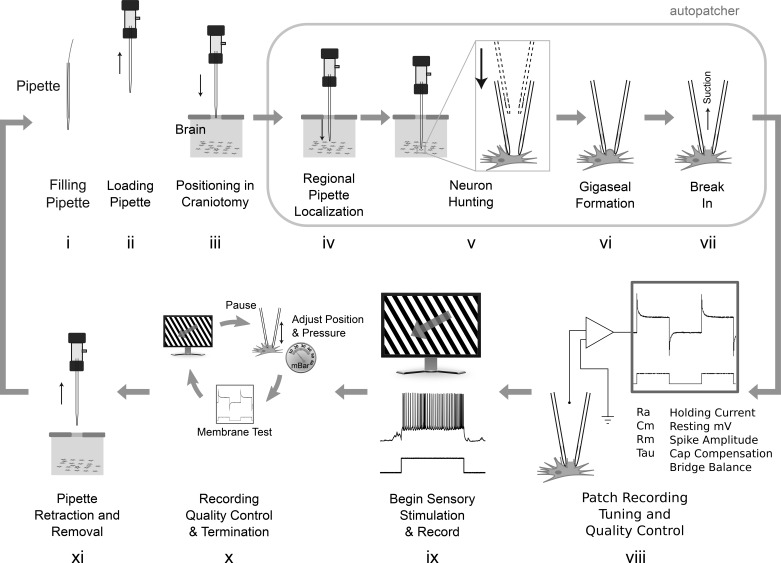
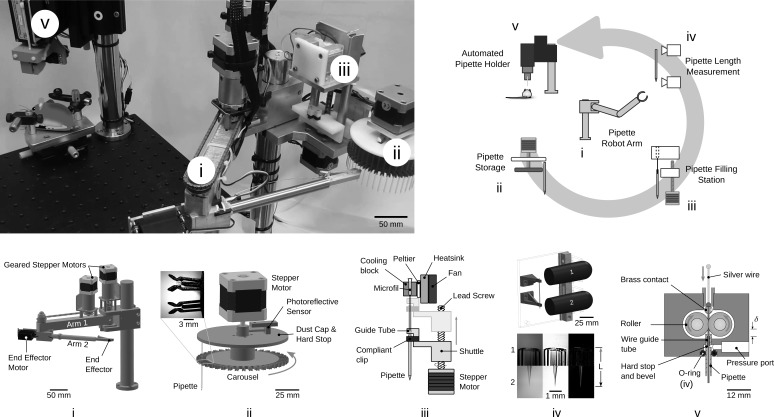
Patch clamping is the gold standard measurement technique for cell-type characterization in vivo, but it has low throughput, is difficult to scale, and requires highly skilled operation. We developed an autonomous robot that can acquire multiple consecutive patch-clamp recordings in vivo. In practice, 40 pipettes loaded into a carousel are sequentially filled and inserted into the brain, localized to a cell, used for patch clamping, and disposed. Automated visual stimulation and electrophysiology software enables functional cell-type classification of whole cell-patched cells, as we show for 37 cells in the anesthetized mouse in visual cortex (V1) layer 5. We achieved 9% yield, with 5.3 min per attempt over hundreds of trials. The highly variable and low-yield nature of in vivo patch-clamp recordings will benefit from such a standardized, automated, quantitative approach, allowing development of optimal algorithms and enabling scaling required for large-scale studies and integration with complementary techniques. NEW & NOTEWORTHY In vivo patch-clamp is the gold standard for intracellular recordings, but it is a very manual and highly skilled technique. The robot in this work demonstrates the most automated in vivo patch-clamp experiment to date, by enabling production of multiple, serial intracellular recordings without human intervention. The robot automates pipette filling, wire threading, pipette positioning, neuron hunting, break-in, delivering sensory stimulus, and recording quality control, enabling in vivo cell-type characterization.

Keywords: automated; in vivo; layer 5; patch clamp; robotic; visual cortex.


Conflict of interest statement

No conflicts of interest, financial or otherwise, are declared by the authors.

Figures

Fig. 1.
Fig. 1.
i–xi: steps in a typical patch-clamp experiment. Steps iv–vi were automated previously (Kodandaramaiah et al. 2012, 2016). The autonomous robot in this work automatically performs steps i–xi and obtains multiple consecutive recordings completely without human interaction (gray arrow). Each recording attempt requires 5.5 min, not including steps viii–x.
Fig. 2.
Fig. 2.
Diagram of the head post (A and B) and dental cement application (C). In C, bregma and lambda are identified by B and L respectively.
Fig. 3.
Fig. 3.
Algorithmic steps of the autonomous autopatcher. A: pipette resistance check. B: pipette insertion, breakage check, and clog check. Arrow denotes the moment the pipette is lowered into the brain followed by a tip breakage resistance check. C: neuron hunting. D: neuron detection and gigasealing. First arrow indicates the moment the last resistance measurement in a monotonically increasing series met the threshold required for neuron detection. Ten resistance measurements are taken to confirm the resistance does not decrease, and then the second arrow denotes low positive pressure release. E: feedback-controlled break-in. First arrow denotes the moment of break-in. Second arrow denotes the moment that the negative pressure ramp was released. F: membrane test in voltage-clamp mode. G: bridge balance adjustment in current clamp mode. H: spike detection and rheobase measurement. I: standard current injections. J: current injection frequency sweep to elicit back-propagating action potentials. K: recording during visual stimulus. Gray bars indicate periods where visual stimuli were presented. L: membrane test performed during pauses of the visual stimulus for online quality control throughout the recording.
Fig. 4.
Fig. 4.
Photograph (top left) and schematics of the autonomous patch clamp robot. i: a two degree-of-freedom robot arm moves the pipettes between stations. ii: a pipette storage carousel where up to 40 pipettes can be loaded. iii: a pipette filling station with thermoelectrically cooled intracellular solution dispenses 3–4 µl. iv: a pipette length measurement station accurately measures variation in pipette length for compensation by the automated pipette holder (v).
Fig. 5.
Fig. 5.
Histograms of whole cell recording quality, from 37 unmanned robot whole cell recordings: recording time (A), resting membrane voltage (B), series resistance (C), membrane resistance (D), holding current (E), and spike amplitude (F). E: note that holding current is defined as the current required to maintain the cell at −65 mV.
Fig. 6.
Fig. 6.
A representative experiment using the autonomous autopatcher for consecutive patch-clamp recordings in layer 5 of mouse visual cortex in vivo. From 40 loaded pipettes, 34 attempts to record are made in two craniotomies, resulting in four whole cell recordings for visual cortex functional characterization. Operator denotes manual intervention (e.g., switching craniotomy, tending to animal welfare, optimizing anesthesia conditions). Recordings 3 and 4 were automatically terminated early after they fell below quality thresholds. A: current clamp recordings of the four cells recording during this single experiment. B: current injection amplitudes and durations corresponding to the recordings in A. C: timeline of events and duration of the activities during this 4-h experiment.
Fig. 7.
Fig. 7.
Representative responses to current injections for all four cell types nonbursting (A), bursting (left: current injections, right: spontaneous burst) (B), putative SOM+ interneuron with a strong h-current (sag) (C), and putative PV+ interneuron with 0.2-ms spike half-width (D).
Fig. 8.
Fig. 8.
Visually evoked response (A–D) from preferred (top), orthogonal (middle), and anti-preferred (bottom) grating orientations, and spike orientation tuning (E–H) of layer 5 cell types with the preferred direction aligned to point up. A and E are nonbursting, B and F are bursting, C and G are putative SOM+, D and H are putative PV+. A–D: gray bar indicates duration of visual stimulation presentation. Solid black line represents the average subthreshold response. Scaling of plots is the same unless otherwise specified. E–H: solid black lines indicate the mean spike tuning response and the limits of the black-shaded region represent means ± SE. For G and H: only 1 cell was recorded so no ± SE is shown. E–H: gray solid line indicates the spontaneous background firing rate.
Fig. 9.
Fig. 9.
A and B: representative bursts from two different cells showing characteristic spike attenuation and depolarization during the burst. C: current injection in a bursting neuron showing lack of bursting when injecting 1.5× rheobase. D: current injection into the same bursting cell from C showing bursting when injection is coincident with spontaneous input to the cell. A–D: tic marks signify spikes that are part of a burst. E and F: representative traces showing plateau potentials (dashed lines) following a burst. G and H: representative response to three 1.8-ms current pulses (amplitude between 800 and 1000 pA, frequency of pulses increased from 25 to 100 Hz) designed to induce back-propagating action potentials and dendritic calcium currents. Plots are aligned to the last of the three pulses. The epoch between the dashed lines is where depolarization is expected to occur in a subset layer 5 bursting cells when the pulse frequency is above 100 Hz. None of the bursting cells or nonbursting cells in this study exhibited such behavior. In all plots, 0 mV and the resting membrane potential are labeled with gray lines.

References

    1. Annecchino LA, Morris AR, Copeland CS, Agabi OE, Chadderton P, Schultz SR. Robotic automation of in vivo two-photon targeted whole-cell patch-clamp electrophysiology. Neuron 95: 1048–1055.e3, 2017. doi:10.1016/j.neuron.2017.08.018. - DOI - PMC - PubMed
    1. Ascoli GA, Alonso-Nanclares L, Anderson SA, Barrionuevo G, Benavides-Piccione R, Burkhalter A, Buzsáki G, Cauli B, Defelipe J, Fairén A, Feldmeyer D, Fishell G, Fregnac Y, Freund TF, Gardner D, Gardner EP, Goldberg JH, Helmstaedter M, Hestrin S, Karube F, Kisvárday ZF, Lambolez B, Lewis DA, Marin O, Markram H, Muñoz A, Packer A, Petersen CCH, Rockland KS, Rossier J, Rudy B, Somogyi P, Staiger JF, Tamas G, Thomson AM, Toledo-Rodriguez M, Wang Y, West DC, Yuste R; Petilla Interneuron Nomenclature Group . Petilla terminology: nomenclature of features of GABAergic interneurons of the cerebral cortex. Nat Rev Neurosci 9: 557–568, 2008. doi:10.1038/nrn2402. - DOI - PMC - PubMed
    1. Atallah BV, Bruns W, Carandini M, Scanziani M. Parvalbumin-expressing interneurons linearly transform cortical responses to visual stimuli. Neuron 73: 159–170, 2012. doi:10.1016/j.neuron.2011.12.013. - DOI - PMC - PubMed
    1. Berger T, Larkum ME, Lüscher H-R. High I(h) channel density in the distal apical dendrite of layer V pyramidal cells increases bidirectional attenuation of EPSPs. J Neurophysiol 85: 855–868, 2001. doi:10.1152/jn.2001.85.2.855. - DOI - PubMed
    1. Bourassa J, Deschênes M. Corticothalamic projections from the primary visual cortex in rats: a single fiber study using biocytin as an anterograde tracer. Neuroscience 66: 253–263, 1995. doi:10.1016/0306-4522(95)00009-8. - DOI - PubMed

Publication types

LinkOut - more resources