Case Reports
. 2019 Apr 11;380(15):1433-1441.
doi: 10.1056/NEJMoa1806627.

Glutaminase Deficiency Caused by Short Tandem Repeat Expansion in GLS

Affiliations
Case Reports

Glutaminase Deficiency Caused by Short Tandem Repeat Expansion in GLS

André B P van Kuilenburg et al. N Engl J Med. .

Abstract

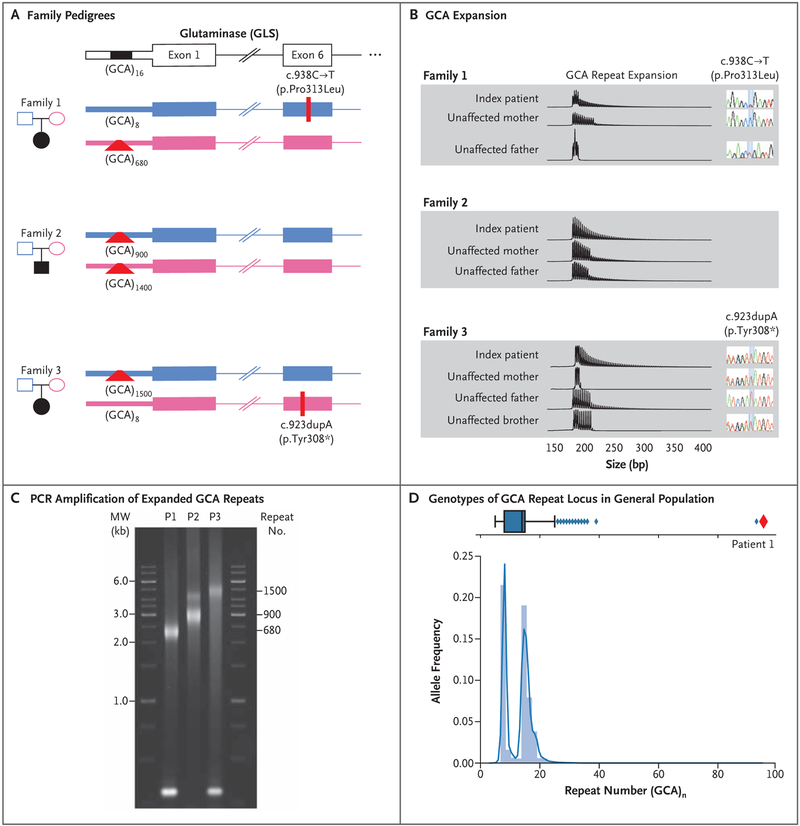
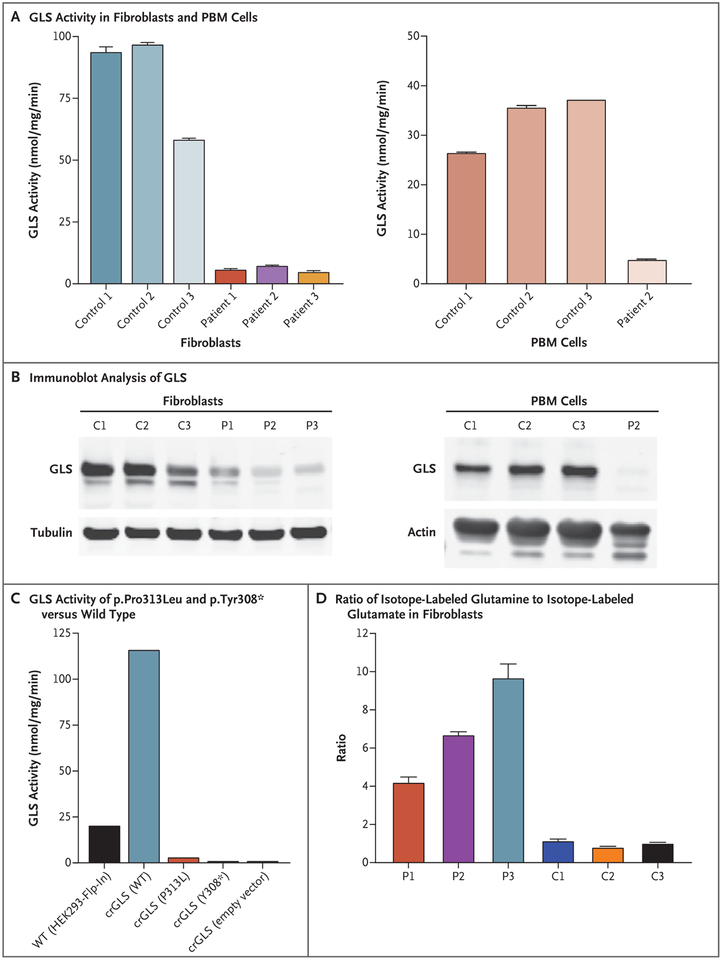
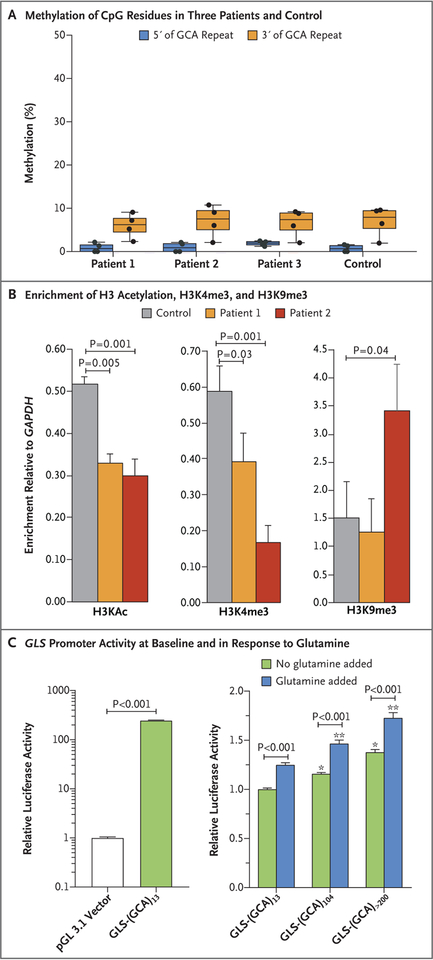
We report an inborn error of metabolism caused by an expansion of a GCA-repeat tract in the 5' untranslated region of the gene encoding glutaminase (GLS) that was identified through detailed clinical and biochemical phenotyping, combined with whole-genome sequencing. The expansion was observed in three unrelated patients who presented with an early-onset delay in overall development, progressive ataxia, and elevated levels of glutamine. In addition to ataxia, one patient also showed cerebellar atrophy. The expansion was associated with a relative deficiency of GLS messenger RNA transcribed from the expanded allele, which probably resulted from repeat-mediated chromatin changes upstream of the GLS repeat. Our discovery underscores the importance of careful examination of regions of the genome that are typically excluded from or poorly captured by exome sequencing.


Figures

Figure 1 (facing page).
Figure 1 (facing page).. Genotyping of GLS Probands.
Panel A shows the pedigrees of the three affected families. The presence of c.938C→T (p.Pro313Leu) in Family 1 and c.923dupA (p.Tyr308) in Family 3 was confirmed on Sanger sequencing. Polymerase-chain-reaction (PCR) amplification of the 5′ region containing the GCA repeat and subsequent Sanger sequencing allowed for the determination of the number of GCA repeats in nonexpanded alleles. In family members in whom a large expansion was observed, the number of GCA repeats was estimated on PCR amplification, followed by agarose gel electrophoresis. Panel B shows the results of triplet repeat–primed PCR assay and subsequent capillary electrophoresis to confirm the presence of the GCA expansion. Each vertical line represents a single GCA repeat. Thus, larger expansions are represented by a greater number of vertical lines. The results of Sanger sequencing that correspond to the missense and frameshift variants are shown next to each member of Families 1 and 3. Panel C shows PCR amplification of the expanded GCA repeats in blood samples obtained from the three patients (P), followed by agarose electrophoresis. The approximately 300-bp PCR product visible in the samples from Patients 1 and 3 reflects the nonexpanded alleles in these patients, who are heterozygous for an expansion and a point mutation. Panel D shows the genotypes of the GCA repeat locus in an untargeted population, indicating the number of GCA repeats for 8295 persons (16,590 total genotypes) as determined with the use of Expansion Hunter run on PCR-free genomesequencing data sets. The blue box plot shows the distribution of alleles with different numbers of GCA repeats in the general population. The vertical line in the box indicates the median, the left side of the box indicates quartile 1 (Q1), and the right side of the box indicates quartile 3 (Q3), with the interquartile range (IQR) defined as Q1 to Q3. The left and right whiskers represent the closest genotype to Q1 minus 1.5 × IQR and Q3 plus 1.5 × IQR, respectively. Any genotypes falling outside this range are considered to be outliers and are represented by diamonds. The repeat number ranged from 5 to 26 in the majority of persons who were assayed, with a bimodal distribution centered at 8 and 16 and 12 outliers with 26 to 38 repeats. Patient 1 is represented by a red diamond, and only one unaffected person was detected with a large expansion similar to that of Patient 1 (far-right outlier at more than 90 repeat units).
Figure 2 (facing page).
Figure 2 (facing page).. Biochemical Characterization of GLS Deficiency.
Panel A shows GLS activity in fibroblasts obtained from all three study patients and from three controls and in peripheral-blood mononuclear (PBM) cells obtained from Patient 2 and from three controls. The GLS activity is measured in nanomoles of glutamate per milligram of protein per minute. Panel B shows the results of immunoblot analysis of GLS in fibroblasts and PBM cells obtained from the same patients (P) and controls (C) shown in Panel A. Panel C shows GLS activity of recombinantly expressed p.Pro313Leu and p.Tyr308 GLS variants, as compared with wild-type (WT) GLS enzyme, expressed in GLS-deficient HEK293-Flp-In cells. Panel D shows the ratio of stable isotope-labeled glutamine to stable isotope-labeled glutamate in fibroblasts obtained from the three patients and three controls. In Panels A and D, the T bars indicate the standard deviation.
Figure 3.
Figure 3.. Repeat-Associated Effects.
Panel A shows the percentage methylation of CpG residues in the upstream genomic region (four sites) and the downstream genomic region (four sites) of the repeat in the three study patients and in a control. CpG sites are regions of DNA where a cytosine nucleotide is followed by a guanine nucleotide in the linear sequence of bases from 5′ to 3′. Cytosines in CpG dinucleotides can be methylated to form 5-methylcytosines. Panel B shows the results of chromatin immunoprecipitation experiments using fibroblasts obtained from Patients 1 and 2 and from a control, indicating the levels of enrichment of H3 acetylation (H3KAc), H3K4me3, and H3K9me3 on the GLS promoter relative to the gene encoding glyceraldehyde-3-phosphate dehydrogenase (GAPDH). Differences between the control sample and those obtained from the two patients were significant for H3KAc, H3K4me3, and H3K9me3 in Patient 2. Differences between enrichment for different histone modifications were evaluated with a t-test to determine significance. The enrichment was calculated as the percentage of input. The y axis shows the enrichment for GLS as the factor change over enrichment for GAPDH. The results are from two independent chromatin immunoprecipitation experiments. Panel C shows the results of cloning of DNA fragments containing the GLS promoter with 13, 104, and approximately 240 GCA repeats — wild-type GLS-(GCA)13, mutant GLS-(GCA)104, and GLS-(GCA)>200 — into luciferase promoter reporter constructs with or without glutamine supplementation at 48 hours. For vector normalization, activity of two luciferases, firefly and Renilla, were measured in the same cells or lysate in three independent experiments. Two-way analyses of variance with Bonferroni post-tests were used for analysis. One asterisk indicates P<0.001 for the comparison with GLS-(GCA)13 with no glutamine supplementation, and two asterisks indicate P<0.001 for the comparison with GLS-(GCA)13 with glutamine supplementation. In Panel A, the data are shown in box plots with the same measures as described in Figure 1D; the T bars indicate the standard deviation of the mean in Panel B and standard error in Panel C.

Comment in

References

    1. Wright CF, FitzPatrick DR, Firth HV. Paediatric genomics: diagnosing rare disease in children. Nat Rev Genet 2018; 19: 253–68. - PubMed
    1. Tarailo-Graovac M, Shyr C, Ross CJ, et al. Exome sequencing and the management of neurometabolic disorders. N Engl J Med 2016; 374: 2246–55. - PMC - PubMed
    1. Gilissen C, Hehir-Kwa JY, Thung DT, et al. Genome sequencing identifies major causes of severe intellectual disability. Nature 2014; 511: 344–7. - PubMed
    1. Tarailo-Graovac M, Drögemöller BI, Wasserman WW, et al. Identification of a large intronic transposal insertion in SLC17A5 causing sialic acid storage disease. Orphanet J Rare Dis 2017; 12: 28. - PMC - PubMed
    1. Alfares A, Aloraini T, Subaie LA, et al. Whole-genome sequencing offers additional but limited clinical utility compared with reanalysis of whole-exome sequencing. Genet Med 2018; 20: 1328–33. - PubMed

Publication types