. 2017 Jun 16;9(6):228.
doi: 10.3390/polym9060228.

A Novel Heterogalactan from Antrodia camphorata and Anti-Angiogenic Activity of Its Sulfated Derivative

Affiliations

A Novel Heterogalactan from Antrodia camphorata and Anti-Angiogenic Activity of Its Sulfated Derivative

Yanqiu Liu et al. Polymers (Basel). .

Abstract

A heterogalactan, named ACW0, was extracted from Antrodia camphorata and purified by anion exchange and gel permeation chromatography. It was composed of galactose (94.98%), traces of mannose (2.41%), and fucose (2.61%), with its molecular weight estimated to be 13.5 k Da. The polysaccharide ACW0 was shown to be a mannofucogalactan with a backbone chain of α-d-1,6-linked Gal, attached by a non-reducing terminal α-d-Man and α-l-Fuc on C-2 of nearly every six α-d-1,6-linked Gal residues. A sulfated polysaccharide, ACW0-Sul was achieved by the chlorosulfonic acid-pyridine method. Compared with the native polysaccharide, ACW0-Sul could disrupt tube formation and migration as well as cell growth of human microvascular endothelial cells (HMEC-1) dose-dependently. Further studies revealed that phosphorylation of Extracellular Regulated Protein Kinases (Erk) and Focal Adhesion Kinase (FAK) were significantly inhibited by ACW0-Sul. These results suggested that ACW0-Sul could be a potent candidate for anti-angiogenic agent development.

Keywords: Antrodia camphorata; anti-angiogenesis; mannofucogalactan; sulfated polysaccharide.


Conflict of interest statement

The authors declare no conflict of interest.

Figures

Figure 1
Figure 1
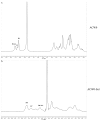
IR spectra of ACW0 (A) and ACW0-Sul (B).
Figure 2
Figure 2
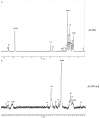
1H NMR spectrum of ACW0 (a) and ACW0-Sul (b) “A1” means terminally linked α-d-Man; “B1” means terminally linked α-l-Fuc; “C1” means 1,2,6-linked α-d-Gal; “D1” means 1,6-linked α-d-Gal. B1’/A1’, terminal Man sulfated at O-6; C1’, 1,2,6-linked Gal sulfated at O-3 and/or O-4; D1’, 1,6-linked Gal sulfated at O-2, O-3, and/or O-4.
Figure 3
Figure 3
13C NMR spectrum of ACW0 (a) and ACW0-Sul (b). From the 13C NMR spectrum, we can see that δ 99.10 was from 1,2,6-linked galactose and 1,6-linked galactose, δ 102.45 was from terminal fucose, δ 102.73 was from terminal mannose. The chemical shifts at 60–80 ppm represented different ring carbon signal resonances. Among them, the C-6 atom of the unsubstituted hexose residue at δ 62.22 and C-6 signals at δ 67.76 for substituted pyranose residues were observed. Two signals at δ 79.08 and δ 79.80 indicated the substitution at C2–C5 of the sugar ring carbons. The methyl group (on C-6) of the fucose appeared at δ 16.99.
Figure 4
Figure 4
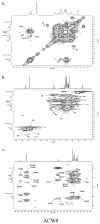
2D NMR spectra of ACW0. (a) 1H-1H COSY spectra of ACW0; (b) HSQC spectra of ACW0; (c) HMBC spectra of ACW0. In the picture, “A” represents terminally linked α-d-Man; “B” represents terminally linked α-l-Fuc; “C” represents 1,2,6-linked α-d-Gal; and “D” represents 1,6-linked α-d-Gal. The precise values include A1–6, B1–6, C1–6, and D1–6 are all in Table 2.
Figure 5
Figure 5
Proposed structure of ACW0.
Figure 6
Figure 6
The effect of ACW0 on tube formation of HMEC-1 cells. (A) HMEC-1 cells treated with ACW0 at different concentrations (9.25, 18.5, 37, and 74 μM). The blank (0 μM) was control. The scale bar are 3.0 um. (B) Quantitative measurement of tube numbers. The values represent mean ± S.D.
Figure 6
Figure 6
The effect of ACW0 on tube formation of HMEC-1 cells. (A) HMEC-1 cells treated with ACW0 at different concentrations (9.25, 18.5, 37, and 74 μM). The blank (0 μM) was control. The scale bar are 3.0 um. (B) Quantitative measurement of tube numbers. The values represent mean ± S.D.
Figure 7
Figure 7
The effects of sulfated polysaccharide ACW0-Sul on tube formation of HMEC-1 cells. (A) HMEC-1 cells were treated with ACW0-Sul at different concentration (0, 3.5, 7, 14, and 28 μM). The scale bar are 3.0 um. (B) Quantitative measurement of (A). Each experiment was performed at least 3 times, and the values represent mean ± S.D. *** p < 0.001 as determined by unpaired t-test.
Figure 7
Figure 7
The effects of sulfated polysaccharide ACW0-Sul on tube formation of HMEC-1 cells. (A) HMEC-1 cells were treated with ACW0-Sul at different concentration (0, 3.5, 7, 14, and 28 μM). The scale bar are 3.0 um. (B) Quantitative measurement of (A). Each experiment was performed at least 3 times, and the values represent mean ± S.D. *** p < 0.001 as determined by unpaired t-test.
Figure 8
Figure 8
ACW0-Sul inhibited cell migration and cell proliferation of HMEC-1 cells. (A) The wound healing assay was performed with ACW0-Sul treatment at different concentrations (0, 3.5, 7, 14 μM) for 0 and 12 h. The wound areas at time 0 and 12 h are indicated by dotted lines. (B) Quantification of effect of ACW0-Sul on HMEC-1 cells migration in the wound healing assay. (C) HMEC-1 cells were treated with different concentrations of ACW0-Sul (0, 0.4375, 0.875, 1.75, 3.5, 7, 14, and 28 μM) for 24, 48, and 72 h, respectively, and followed by cell viability MTT assay. Each experiment was repeated at least 3 times, and the values represent mean ± S.D. * p < 0.05 as determined by unpaired t-test.
Figure 9
Figure 9
ACW0-Sul inhibited the phosphorylation of FAK and Erk. HMEC-1 cells incubated with 3.5 μM ACW0-Sul for different time (0, 1, 2, 4, 8 and 12 h). Then the cells were lysed and subjected to Western blotting measurement. (A) The expression of phospho-FAK and total FAK was measured by Western blotting. (B) The expression of phospho-Erk and total Erk was examined by Western blotting. GAPDH was used as loading control. The experiments were repeated at least 3 times, and the data were represented as mean ± S.D.; n = 3. *** p < 0.001.

References

    1. Cuvillier O. The therapeutic potential of HIF-2 antagonism in renal cell carcinoma. Transl. Androl. Urol. 2017;6:131–133. doi: 10.21037/tau.2017.01.12. - DOI - PMC - PubMed
    1. Wu S.Y., Watabe K. The roles of microglia/macrophages in tumor progression of brain cancer and metastatic disease. Front. Biosci. 2017;22:1805–1829. doi: 10.2741/4573. - DOI - PMC - PubMed
    1. Escudero C.A. Pro-angiogenic Role of Insulin: From Physiology to Pathology. Front. Physiol. 2017;8:204. doi: 10.3389/fphys.2017.00204. - DOI - PMC - PubMed
    1. Wang P., Zhang L., Yao J., Shi Y., Li P., Ding K. An arabinogalactan from flowers of Panax notoginseng inhibits angiogenesis by BMP2/Smad/Id1 signaling. Carbohydr. Polym. 2015;121:328–335. doi: 10.1016/j.carbpol.2014.11.073. - DOI - PubMed
    1. Qiu H., Yang B., Pei Z.C., Zhang Z., Ding K. WSS25 inhibits growth of xenografted hepatocellular cancer cells in nude mice by disrupting angiogenesis via blocking bone morphogenetic protein (BMP)/Smad/Id1 signaling. J. Biol. Chem. 2010;285:32638–32646. doi: 10.1074/jbc.M110.105544. - DOI - PMC - PubMed

LinkOut - more resources