. 2019 Apr 11;19(1):314.
doi: 10.1186/s12879-019-3930-6.

Epidemiological and genetic characterization of pH1N1 and H3N2 influenza viruses circulated in MENA region during 2009-2017

Affiliations

Epidemiological and genetic characterization of pH1N1 and H3N2 influenza viruses circulated in MENA region during 2009-2017

Hebah A Al Khatib et al. BMC Infect Dis. .

Abstract

Background: Influenza surveillance is necessary for detection of emerging variants of epidemiologic and clinical significance. This study describes the epidemiology of influenza types A and B, and molecular characteristics of surface glycoproteins (hemagglutinin [HA] and neuraminidase [NA]) of influenza A subtypes: pH1N1 and H3N2 circulated in Arabian Gulf, Levant and North Africa regions during 2009-2017.

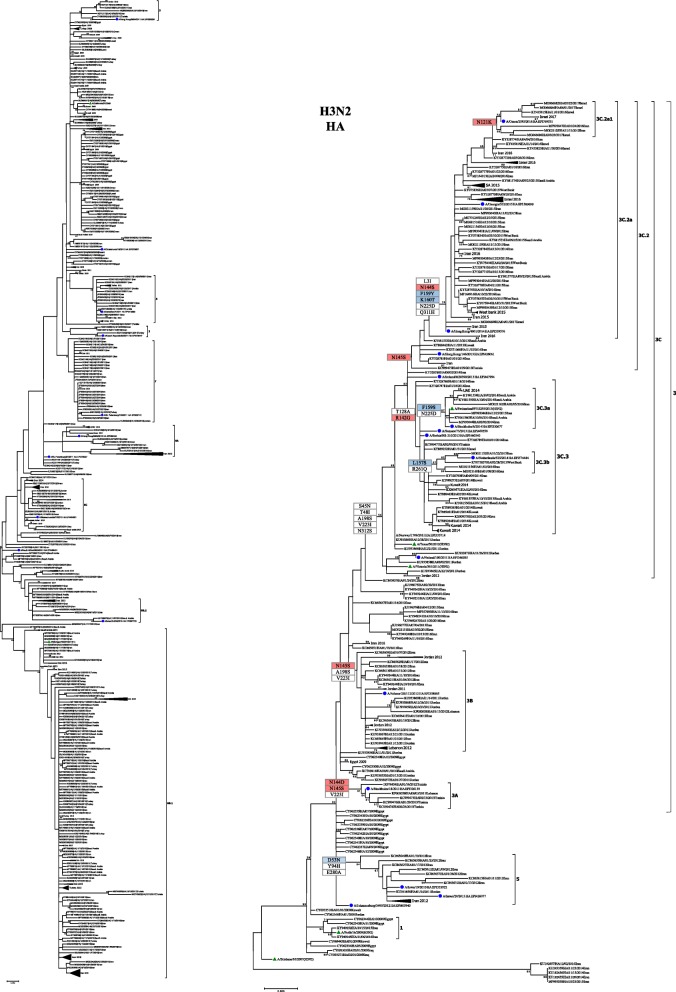
Methods: Analysis of phylogenetics and evolution of HA and NA genes was done using full HA and NA sequences (n = 1229) downloaded from Influenza Research Database (IRD).

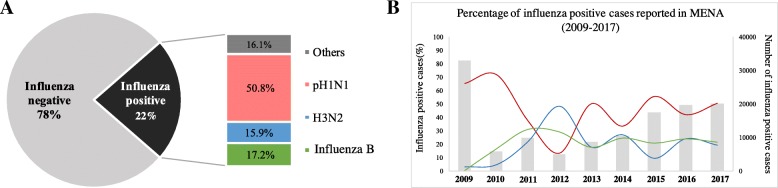
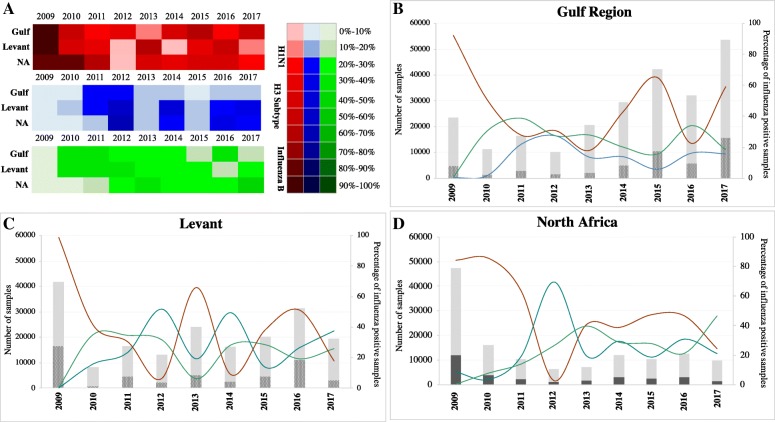
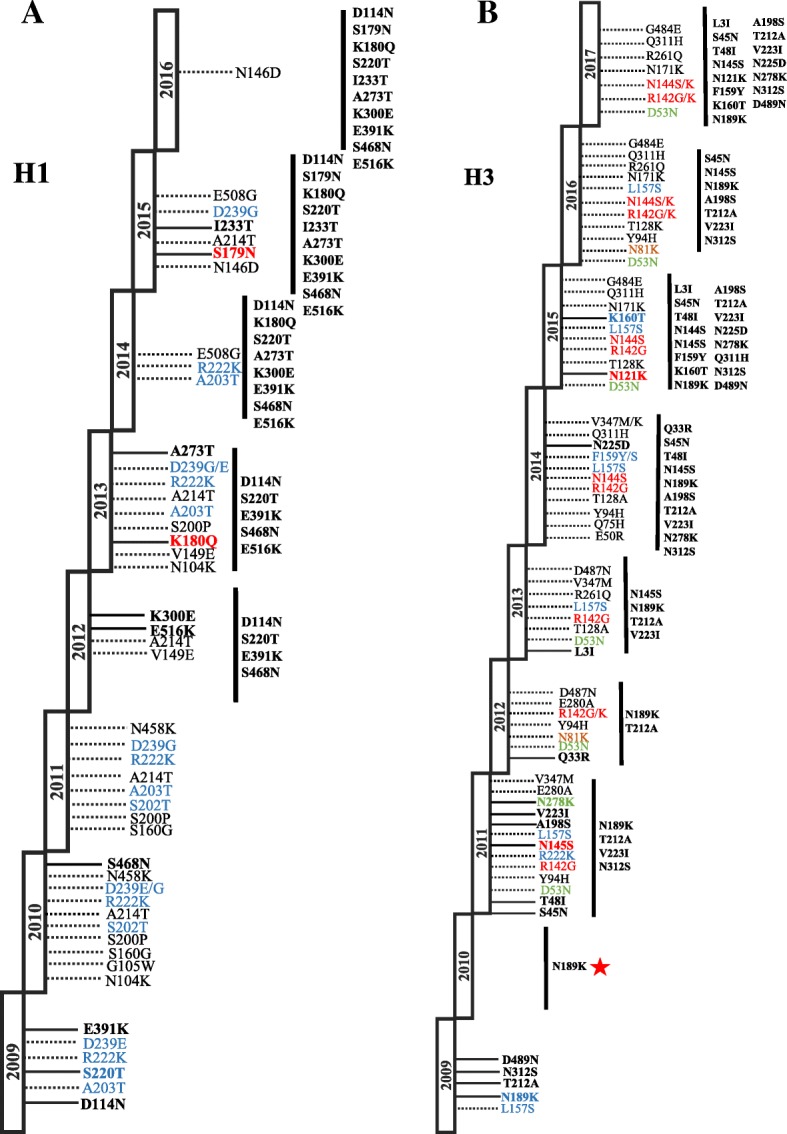
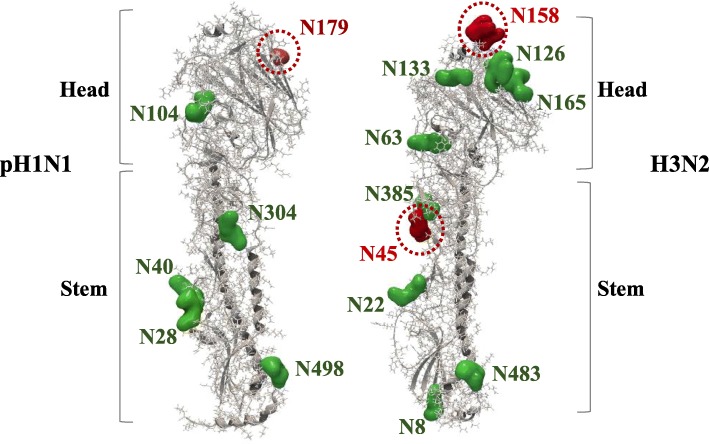
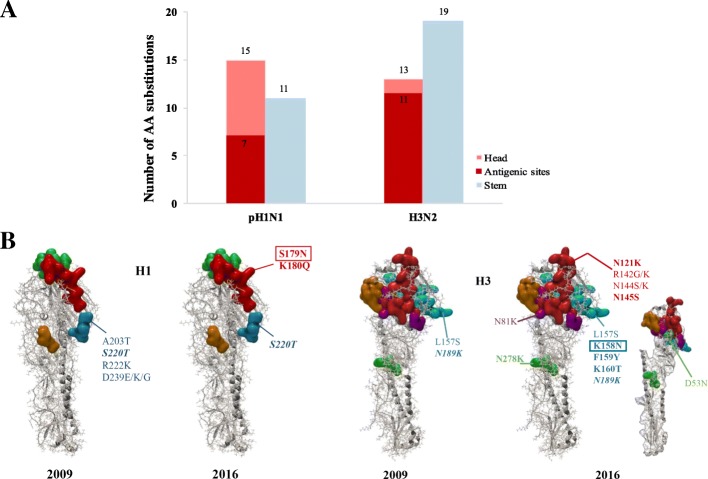
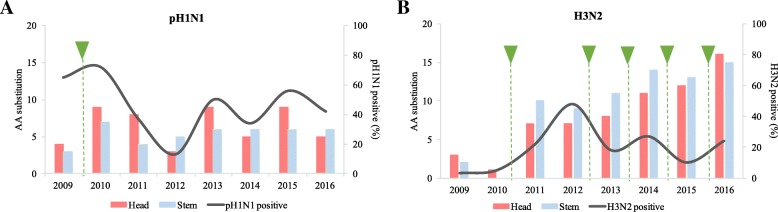
Results: In total, 130,354 influenza positive cases were reported to WHO during study period. Of these, 50.8% were pH1N1 positive, 15.9% were H3N2 positives and 17.2% were influenza B positive. With few exceptions, all three regions were showing the typical seasonal influenza peak similar to that reported in Northern hemisphere (December-March). However, influenza activity started earlier (October) in both Gulf and North Africa while commenced later during November in Levant countries. The molecular analysis of the HA genes (influenza A subtypes) revealed similar mutations to those reported worldwide. Generally, amino acid substitutions were most frequently found in head domain in H1N1 pandemic viruses, while localized mainly in the stem region in H3N2 viruses. Expectedly, seasons with high pH1N1 influenza activity was associated with a relatively higher number of substitutions in the head domain of the HA in pH1N1 subtype. Furthermore, nucleotide variations were lower at the antigenic sites of pH1N1 viruses compared to H3N2 viruses, which experienced higher variability at the antigenic sites, reflecting the increased immunological pressure because of longer circulation and continuous vaccine changes. Analysis of NA gene of pH1N1 viruses revealed sporadic detections of oseltamivir-resistance mutation, H275Y, in 4% of reported sequences, however, none of NAI resistance mutations were found in the NA of H3N2 viruses.

Conclusions: Molecular characterization of H1N1 and H3N2 viruses over 9 years revealed significant differences with regard to position and function of characterized substitutions. While pH1N1 virus substitutions were mainly found in HA head domain, H3N2 virus substitutions were mostly found in HA stem domain. Additionally, more fixed substitutions were encountered in H3N2 virus compared to larger number of non-fixed substitutions in pH1N1.

Keywords: H3N2; Hemagglutinin; Influenza epidemics; Molecular evolution; Neuraminidase; Phylogeny; pH1N1.


Conflict of interest statement

Ethics approval and consent to participate

Not applicable.

Consent for publication

Not applicable.

Competing interests

Hadi Yassine is a member of the editorial board of the journal. Otherwise, the authors declare they have no conflict of interest.

Publisher’s Note

Springer Nature remains neutral with regard to jurisdictional claims in published maps and institutional affiliations.

Figures

Fig. 1
Fig. 1
a Percentage of influenza types/subtypes reported to FluNet database from MENA (2009–2017). The bar chart represents the contribution of each type/subtype to the overall percentage of positive samples. b Overall trends of influenza activity in MENA region during 2009–2017 as reported to FluNet database. Total number of influenza positive samples received per year is presented by gray bars. Annual percentages of reported cases positive for influenza A subtypes pH1N1 (red), H3N2 (blue) and influenza B viruses are also presented
Fig. 2
Fig. 2
Influenza activity patterns of co-circulating influenza A subtypes (pH1N1 and H3N2) and influenza B in MENA, 2009–2017. a Heat map showing the levels of influenza activity of each type/subtype in each region (n = 3) from April 2009 to December 2017 period. The color scale denotes the percentage of influenza positive samples relative to corresponding color shade. Annual activity trends of influenza viruses: pH1N1 (red), H3N2 (blue) and influenza B in Gulf (b), Levant (c) and North Africa (d) regions since April 2009 to December 2017. Bars represent the total number of samples collected in each year while doted pattern in each bar denotes number of influenza positive samples in each specific year
Fig. 3
Fig. 3
Phylogenetic trees of HA nucleotide sequences of pH1N1 and H3N2 viruses. HA sequences of pH1N1 (n = 512) and H3N2 (n = 239) reported from MENA region between 2009 and 2017 were compared to vaccine strains recommended by WHO (denoted with green triangles) and the reference strains of known clades as reported in WHO Influenza Center London, indicated by navy blue circles [25]. Phylogenic trees were generated using maximum likelihood method by GTR + G model using in MEGA7 software. Bootstrap values of 1000 replicates and only values larger than 50 are indicated at the nodes. At the major nodes are the signature amino acid changes in different colors according to antigenic site: Red for Sa (pH1N1) and A (H3N2), blue for Ca (pH1N1) and B (H3N2), green for C (H3N2). Scale bar represents approximately 0.005 nucleotide difference between close relatives
Fig. 4
Fig. 4
Summary of amino acid substitutions identified in HA proteins of (A) pH1N1 viruses and (B) H3N2 viruses between 2009 and 2017 in MENA. Substitutions are colored with respect to their localization in the antigenic sites. For pH1N1: Sa is colored red and Ca is colored blue. For H3N2: A is colored red; B is colored blue; C is colored green and D is colored orange. Sporadic and fixed substitutions (bold) are indicated by the dashed and continuous lines respectively. Fixed substitutions that have been found in > 80% of viruses are listed in parallel (on the right) to respective year. Only one HA sequence has been found in IRD representing H3N2 virus from MENA during 2010 (red star)
Fig. 5
Fig. 5
The glycosylation sites of HA proteins of pH1N1 and H3N2 viruses. The 3D structures of HA monomers from pH1N1 (PDB 3LZG) and H3N2 (PDB 2YP7) are displayed using CLC genomic workbench version 11. The 3D structures show glycosylation sites with respect to their localization in the HA protein: conserved glycosylation sequon are colored green and acquired glycosylation sequon are colored in red
Fig. 6
Fig. 6
Amino acid (AA) substitutions in HAs of pH1N1 and H3N2 viruses circulated between 2009 and 2017. a Number of amino acid substitutions in HA head and stem domains of pH1N1 and H3N2 viruses. Amino acids are colored according to their location in head (red), stem (blue) and antigenic sites (dark red). b Amino acid substitutions identified in the antigenic sites of HAs of pH1N1 and H3N2 viruses in 2009 and 2016. The 3D crystal structures of A/California/04/2009 (PDB 3LZG) and for 2005 human H3N2 Virus (PDB 2YP7) are displayed using CLC genomic workbench version 11. The antigenic sites of H1 are colored: Sa (red), Sb (green), Ca (blue) and Cb (orange). The antigenic sites of H3 are colored: A (red), B (blue), C (green), D (orange) and E (purple). The inner site of H3 structure (2016) is shown to visualize D53N substitution in C1 epitope. Fixed substitutions developed during the evolution of the influenza viruses are labeled in bold. AA substitutions in RBS are shown in italics. AA substitutions that are associated with changes of potential glycosylation sites are framed
Fig. 7
Fig. 7
Amino acid substitutions in the HA genes of (a) pH1N1 and (b) A(H3N2) viruses circulated during 2009–2017. Amino acid substitutions in the head domain of the HA protein are labeled in red and amino acid (AA) substitutions in the stem domain are displayed in blue. The black curve shows the number of positive samples as reported to FluNet (WHO) during the same period. The green arrows denote the introduction of a new vaccine strain

References

    1. World Health Organization- Influenza fact sheet. Influenza (Seasonal) Fact sheet. 2017 [cited 2018 February]; Available from: http://www.who.int/news-room/detail/14-12-2017-up-to-650-000-people-die-...
    1. Hay AJ, et al. The evolution of human influenza viruses. Philos Trans R Soc Lond Ser B Biol Sci. 2001;356(1416):1861–1870. doi: 10.1098/rstb.2001.0999. - DOI - PMC - PubMed
    1. Molinari NA, et al. The annual impact of seasonal influenza in the US: measuring disease burden and costs. Vaccine. 2007;25(27):5086–5096. doi: 10.1016/j.vaccine.2007.03.046. - DOI - PubMed
    1. Schafer JR, et al. Origin of the pandemic 1957 H2 influenza a virus and the persistence of its possible progenitors in the avian reservoir. Virology. 1993;194(2):781–788. doi: 10.1006/viro.1993.1319. - DOI - PubMed
    1. Webster RG, et al. Evolution and ecology of influenza a viruses. Microbiol Rev. 1992;56(1):152–179. - PMC - PubMed

MeSH terms

Substances