. 2019 Apr 10;11(487):eaaw2064.
doi: 10.1126/scitranslmed.aaw2064.

Cbp-dependent histone acetylation mediates axon regeneration induced by environmental enrichment in rodent spinal cord injury models

Affiliations

Cbp-dependent histone acetylation mediates axon regeneration induced by environmental enrichment in rodent spinal cord injury models

Thomas H Hutson et al. Sci Transl Med. .

Abstract

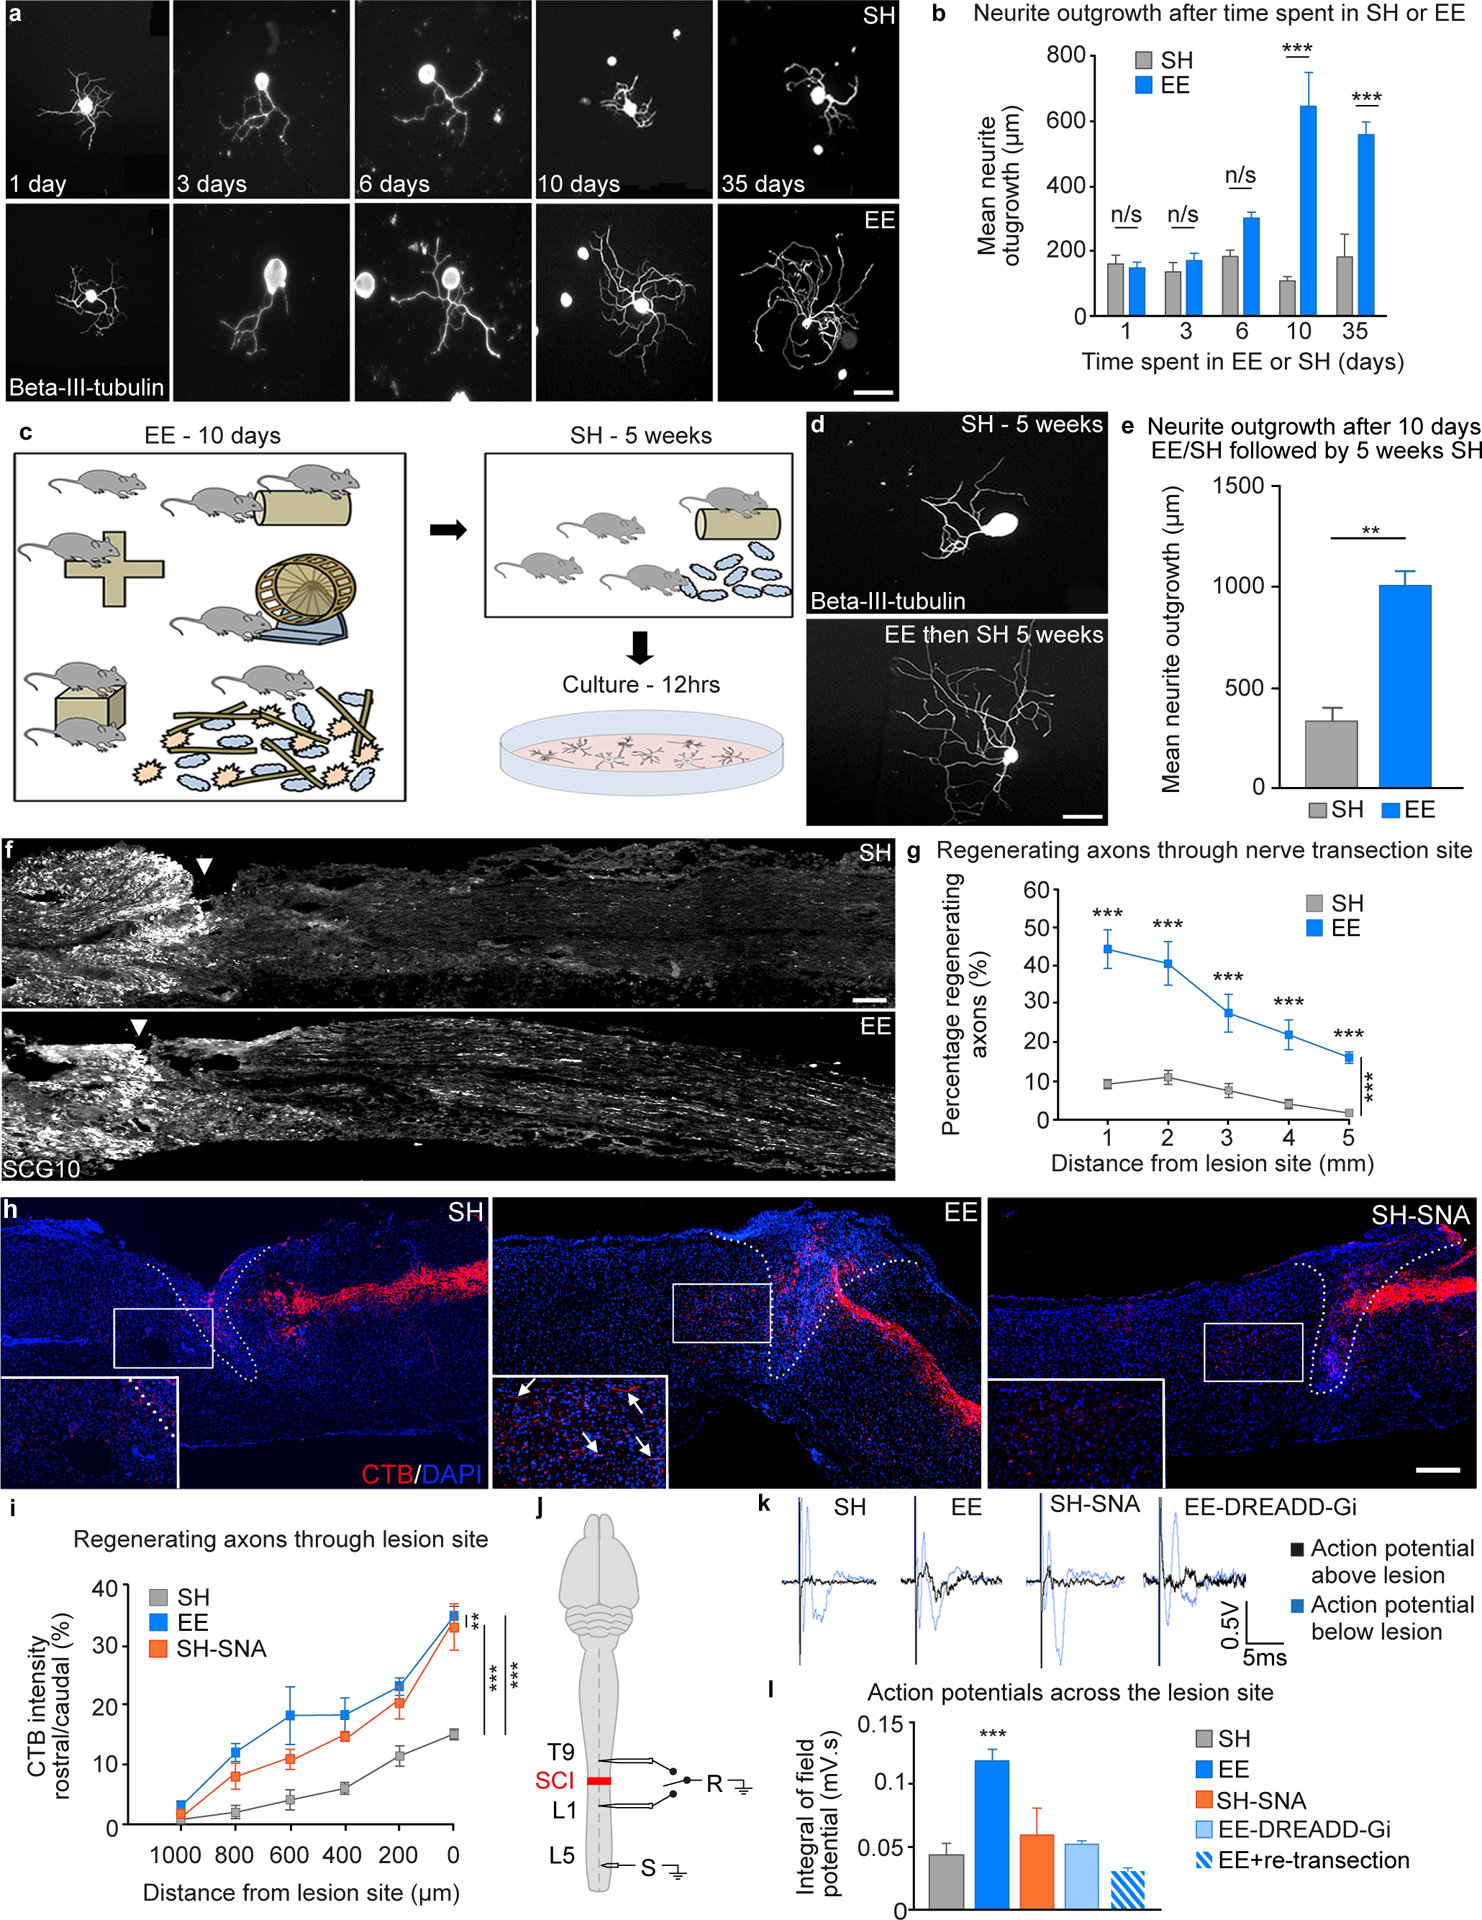
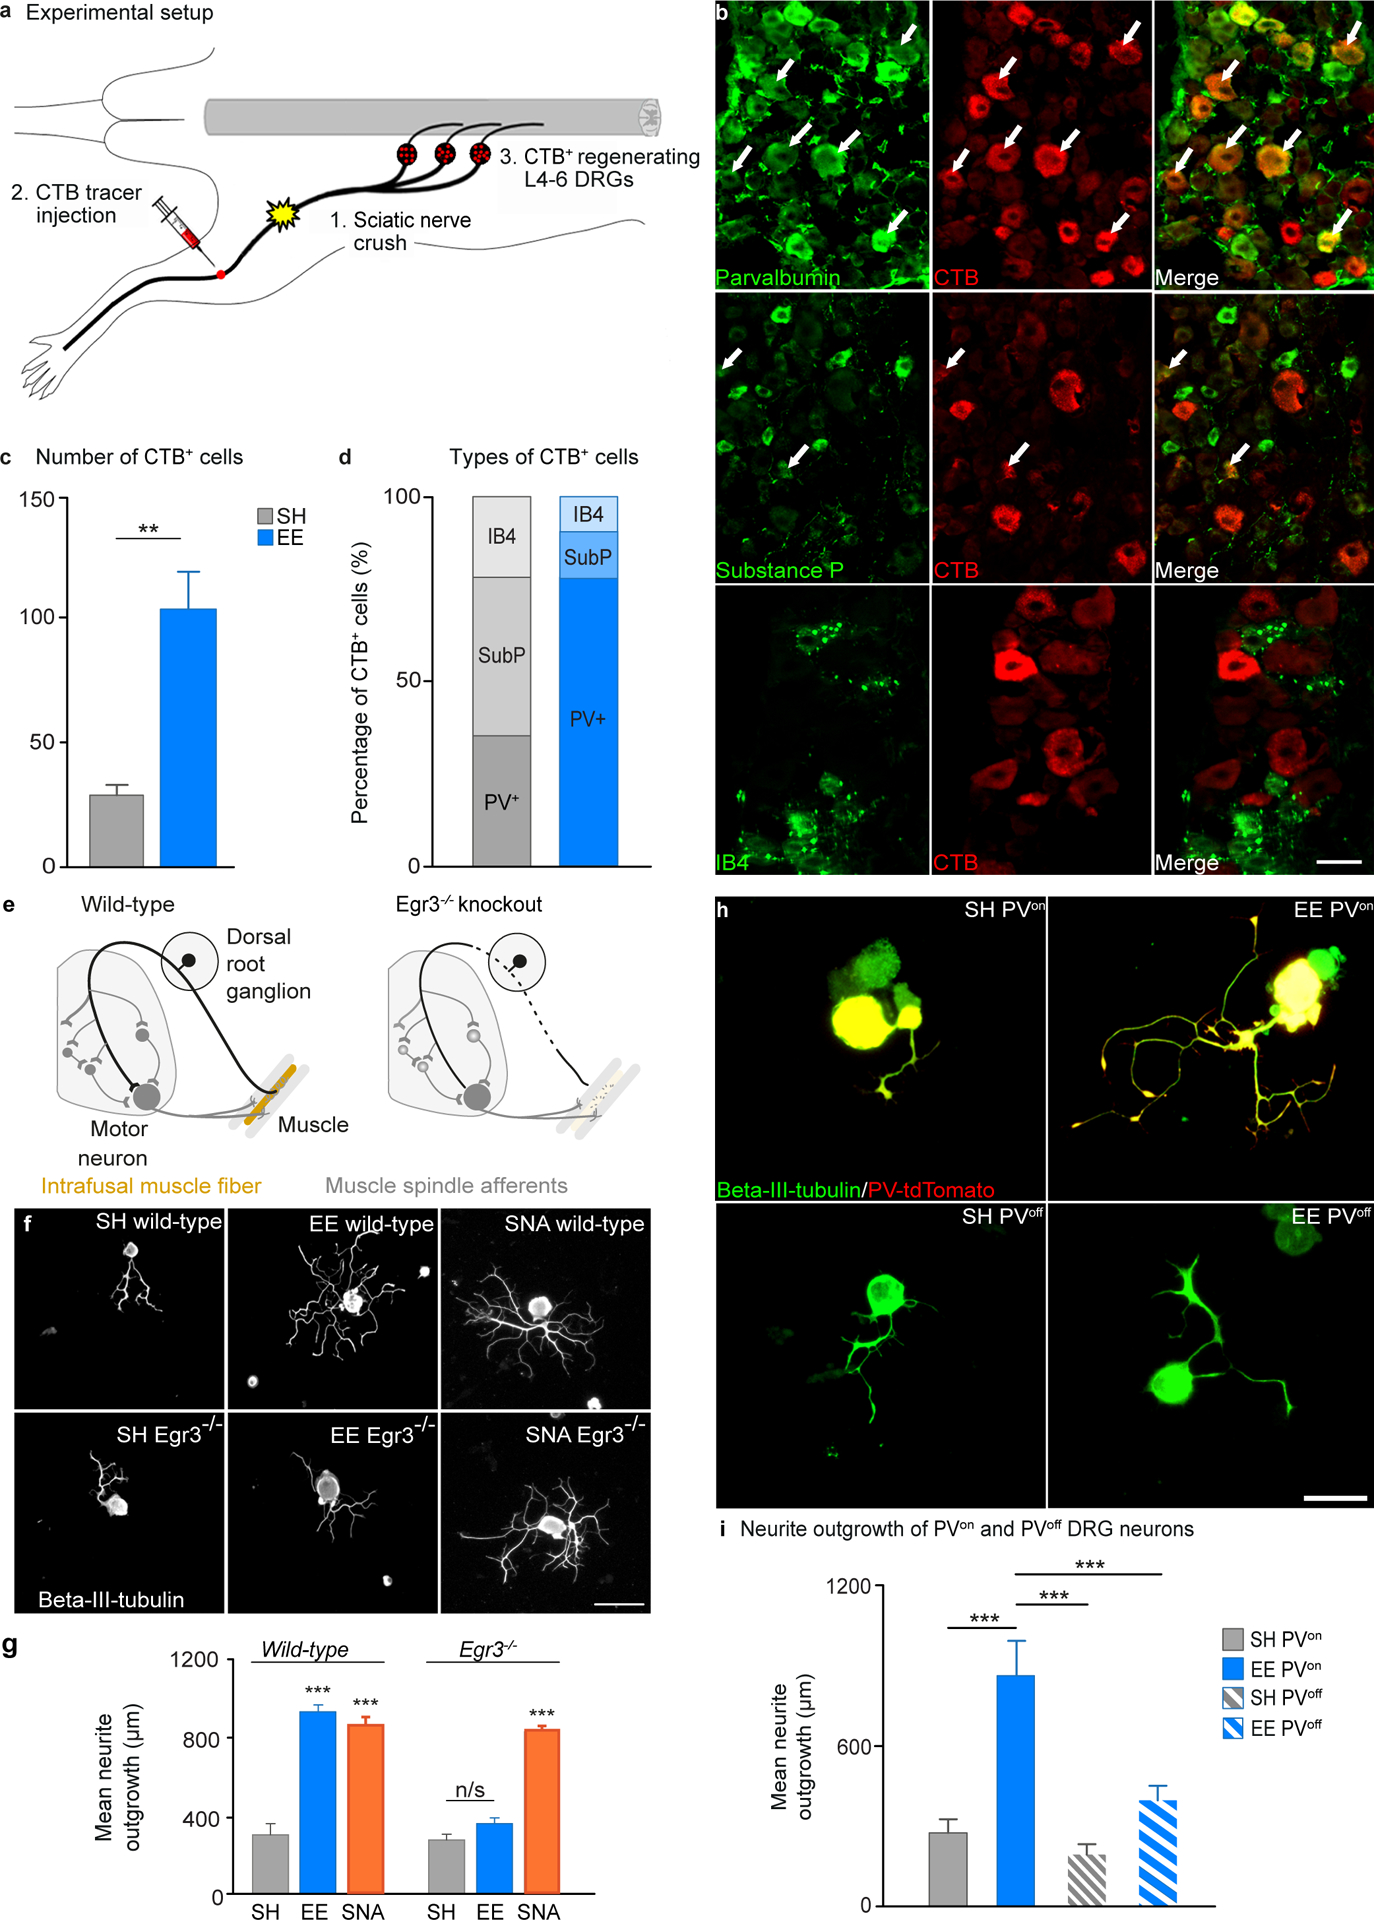
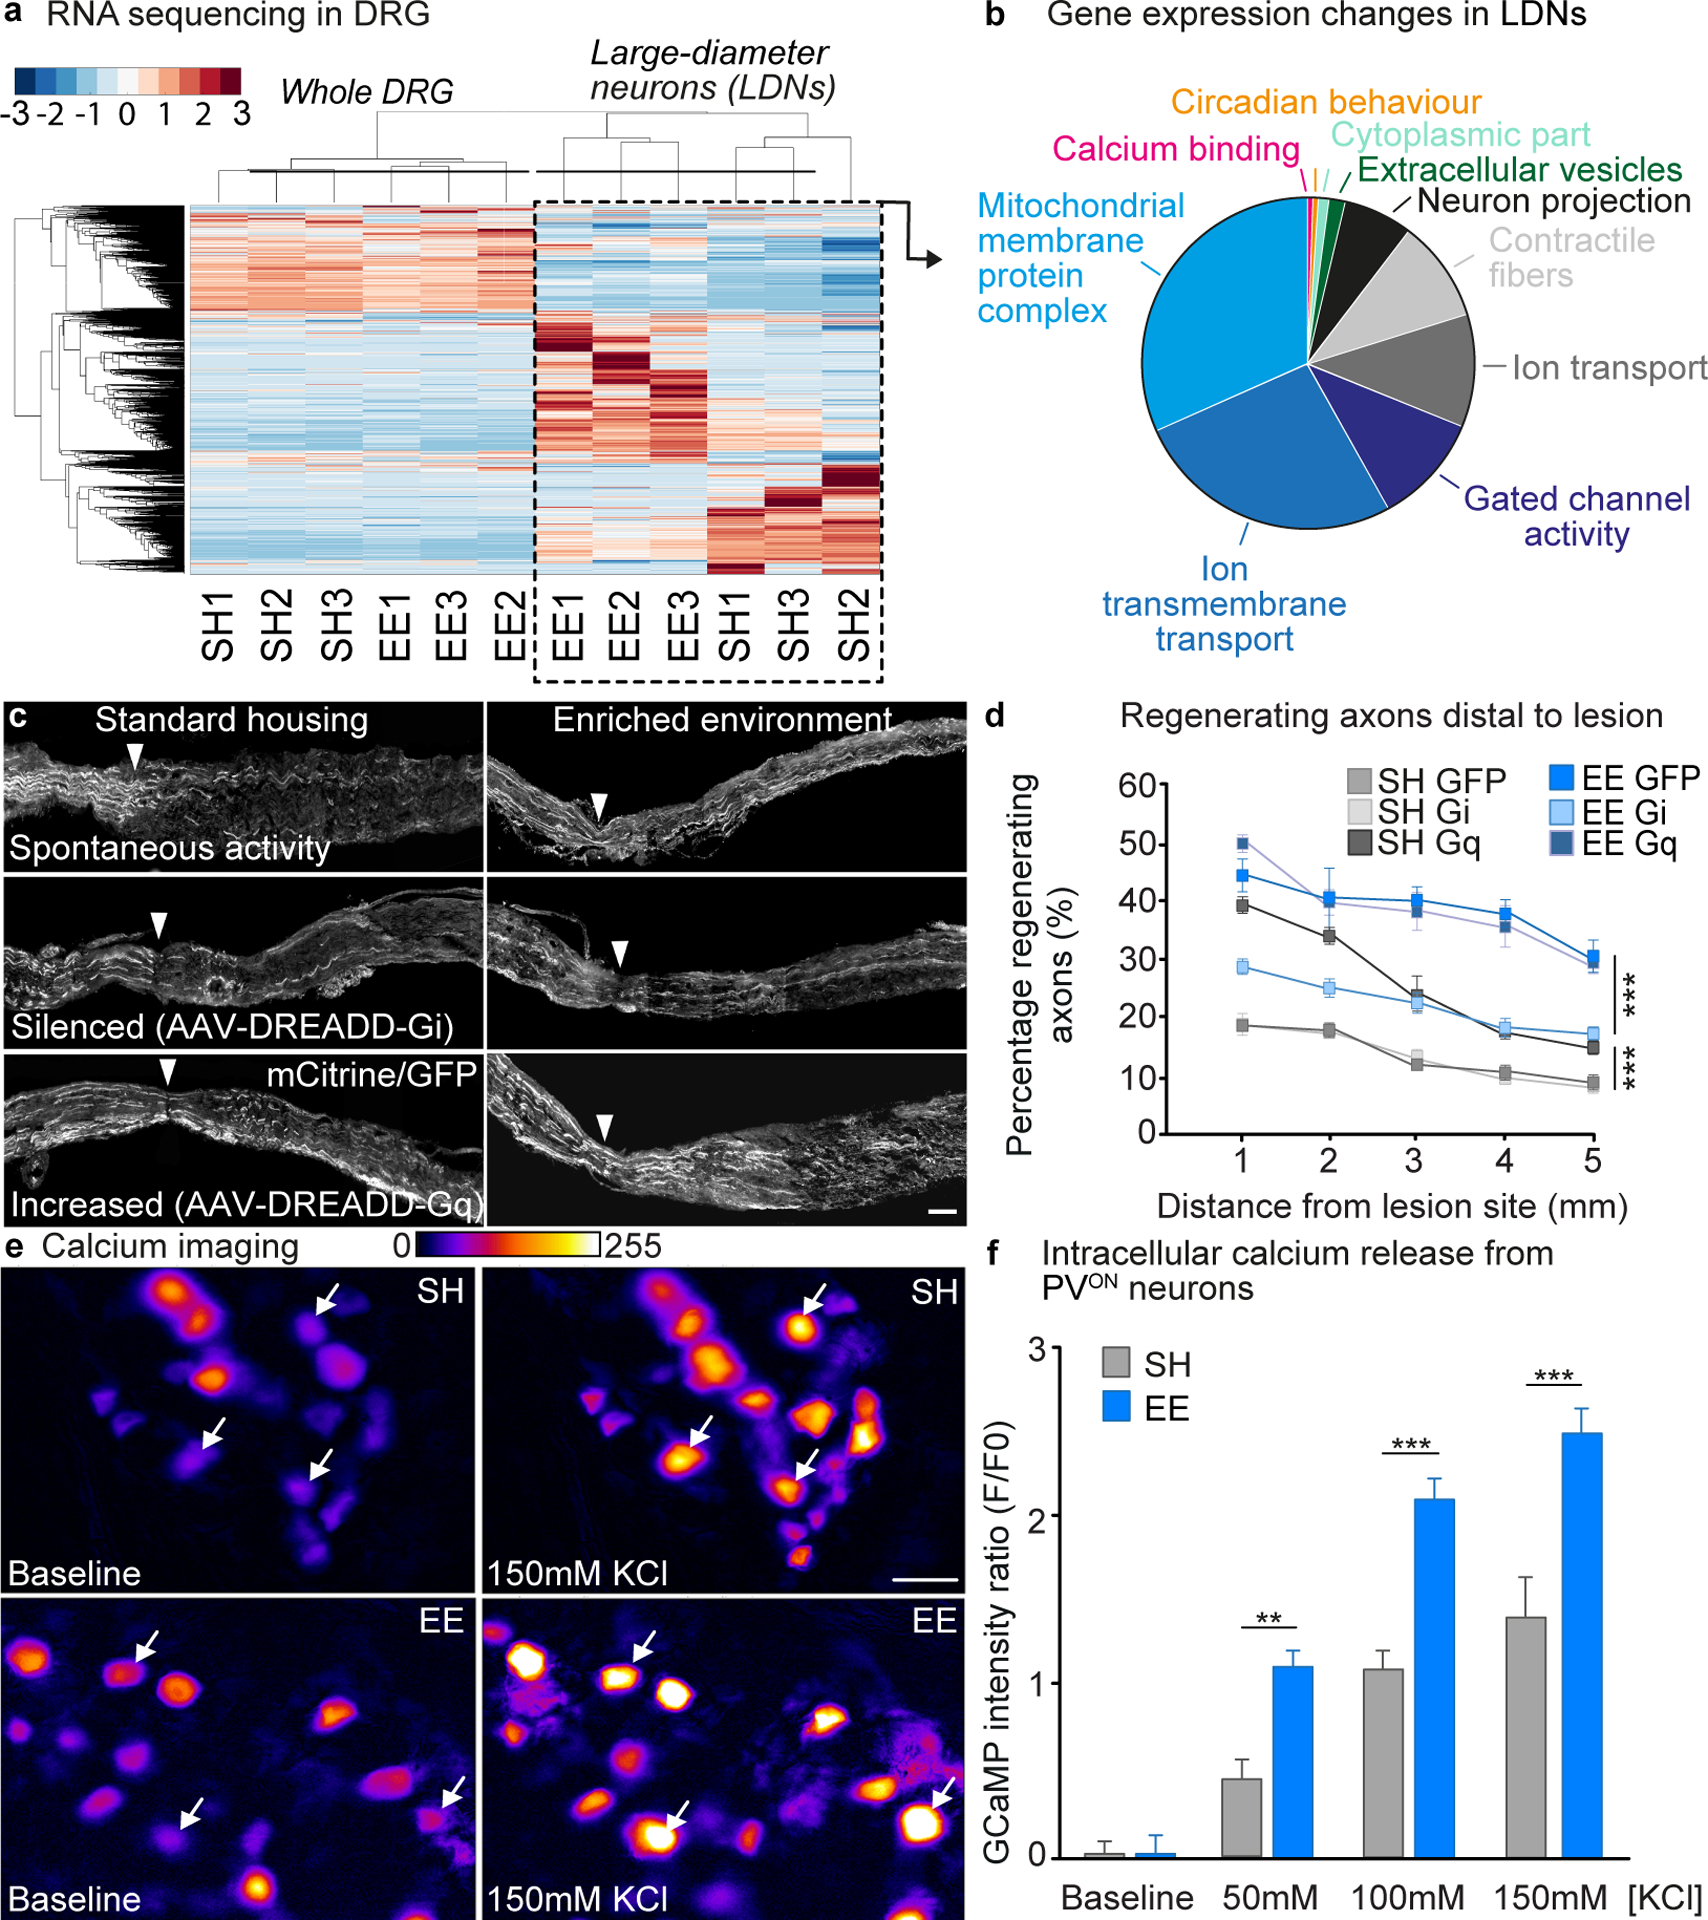
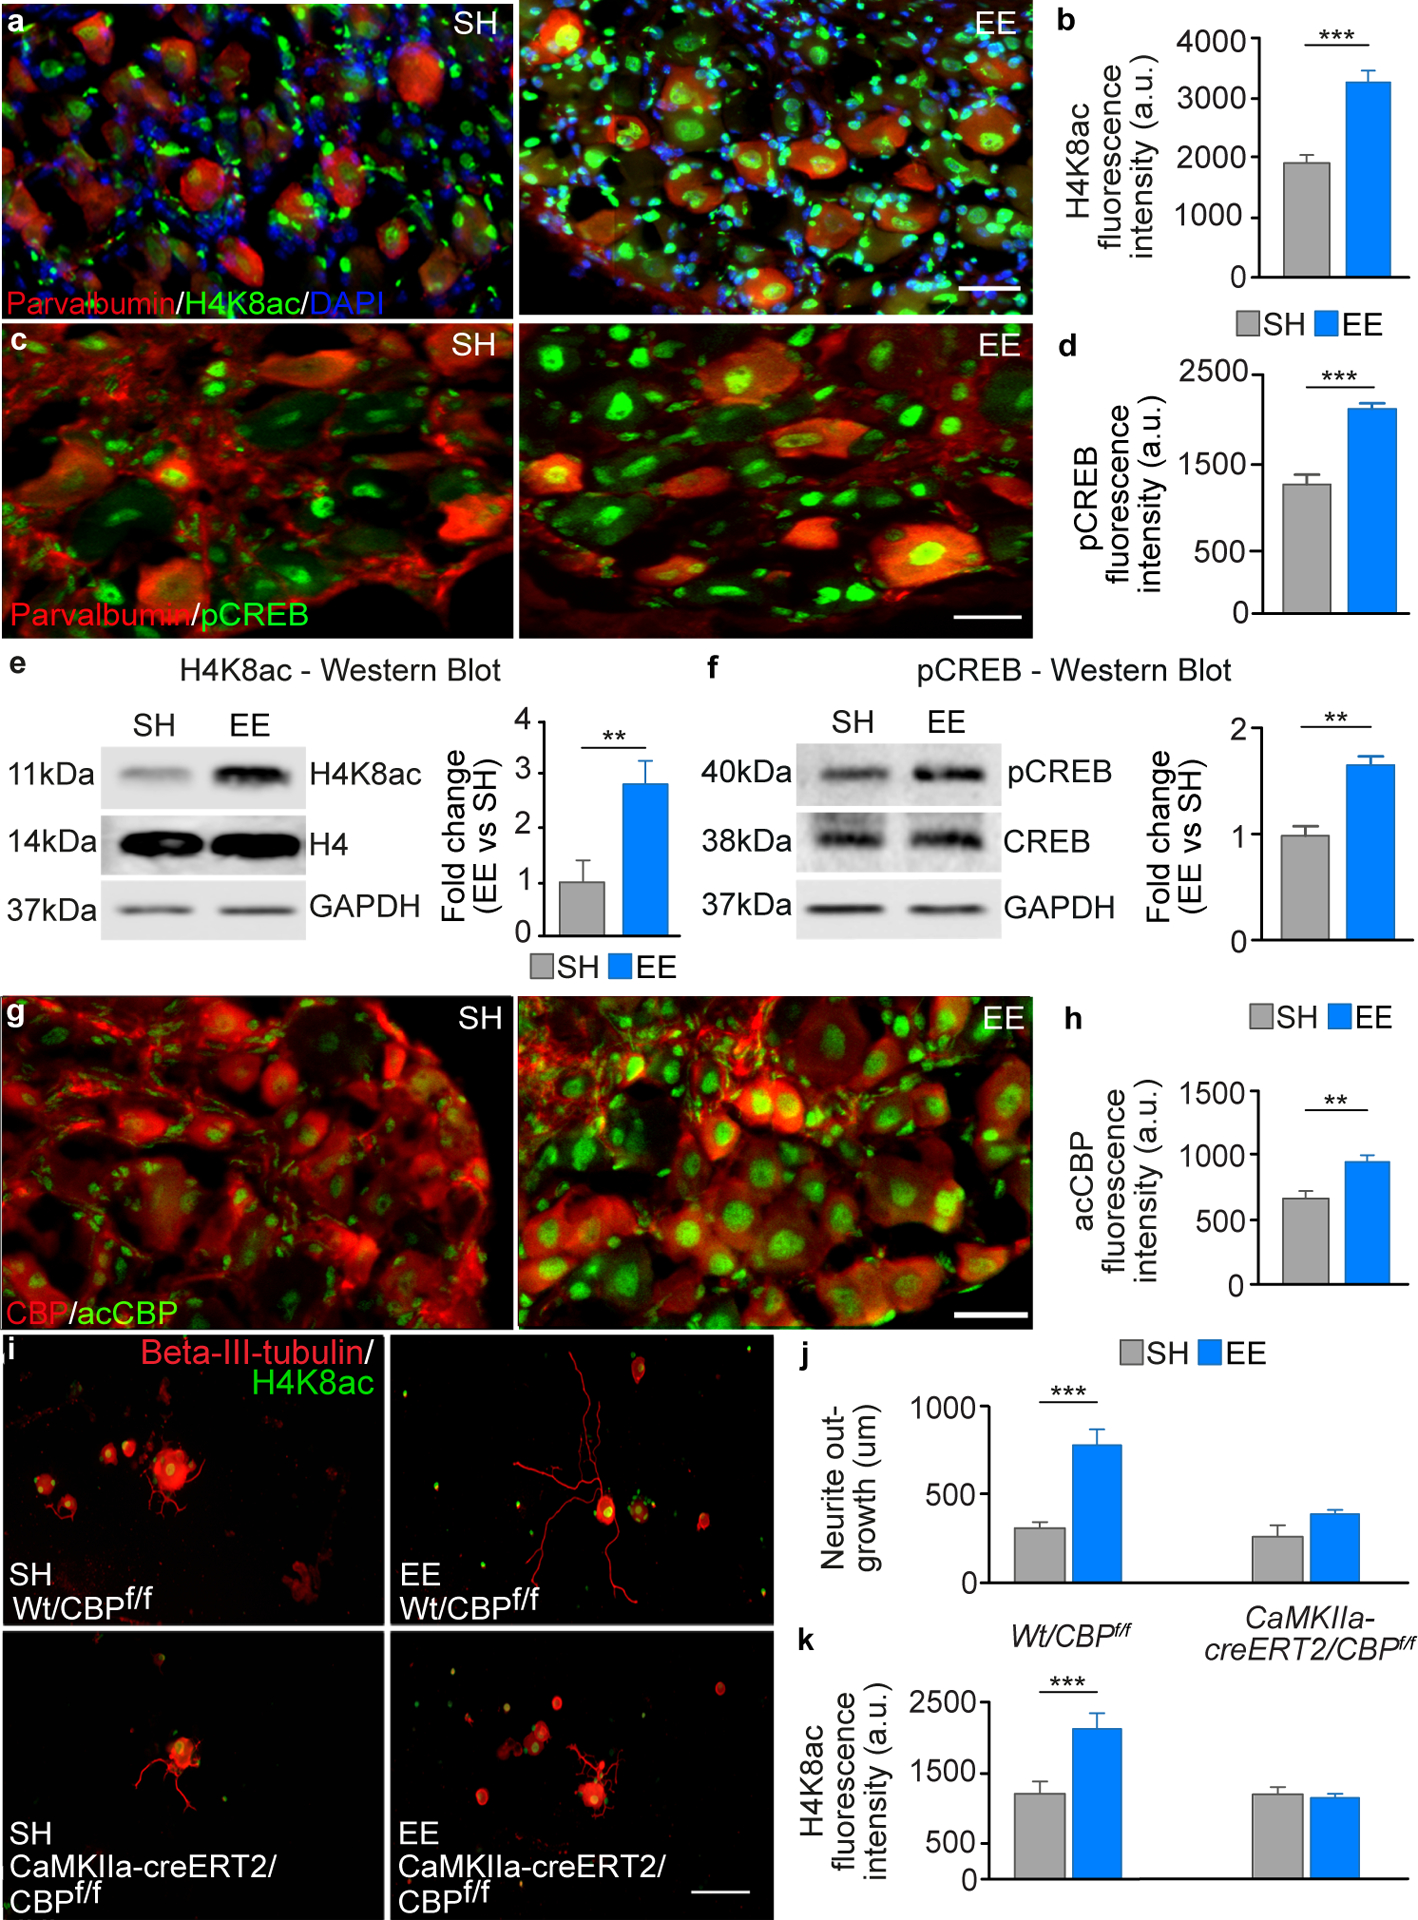
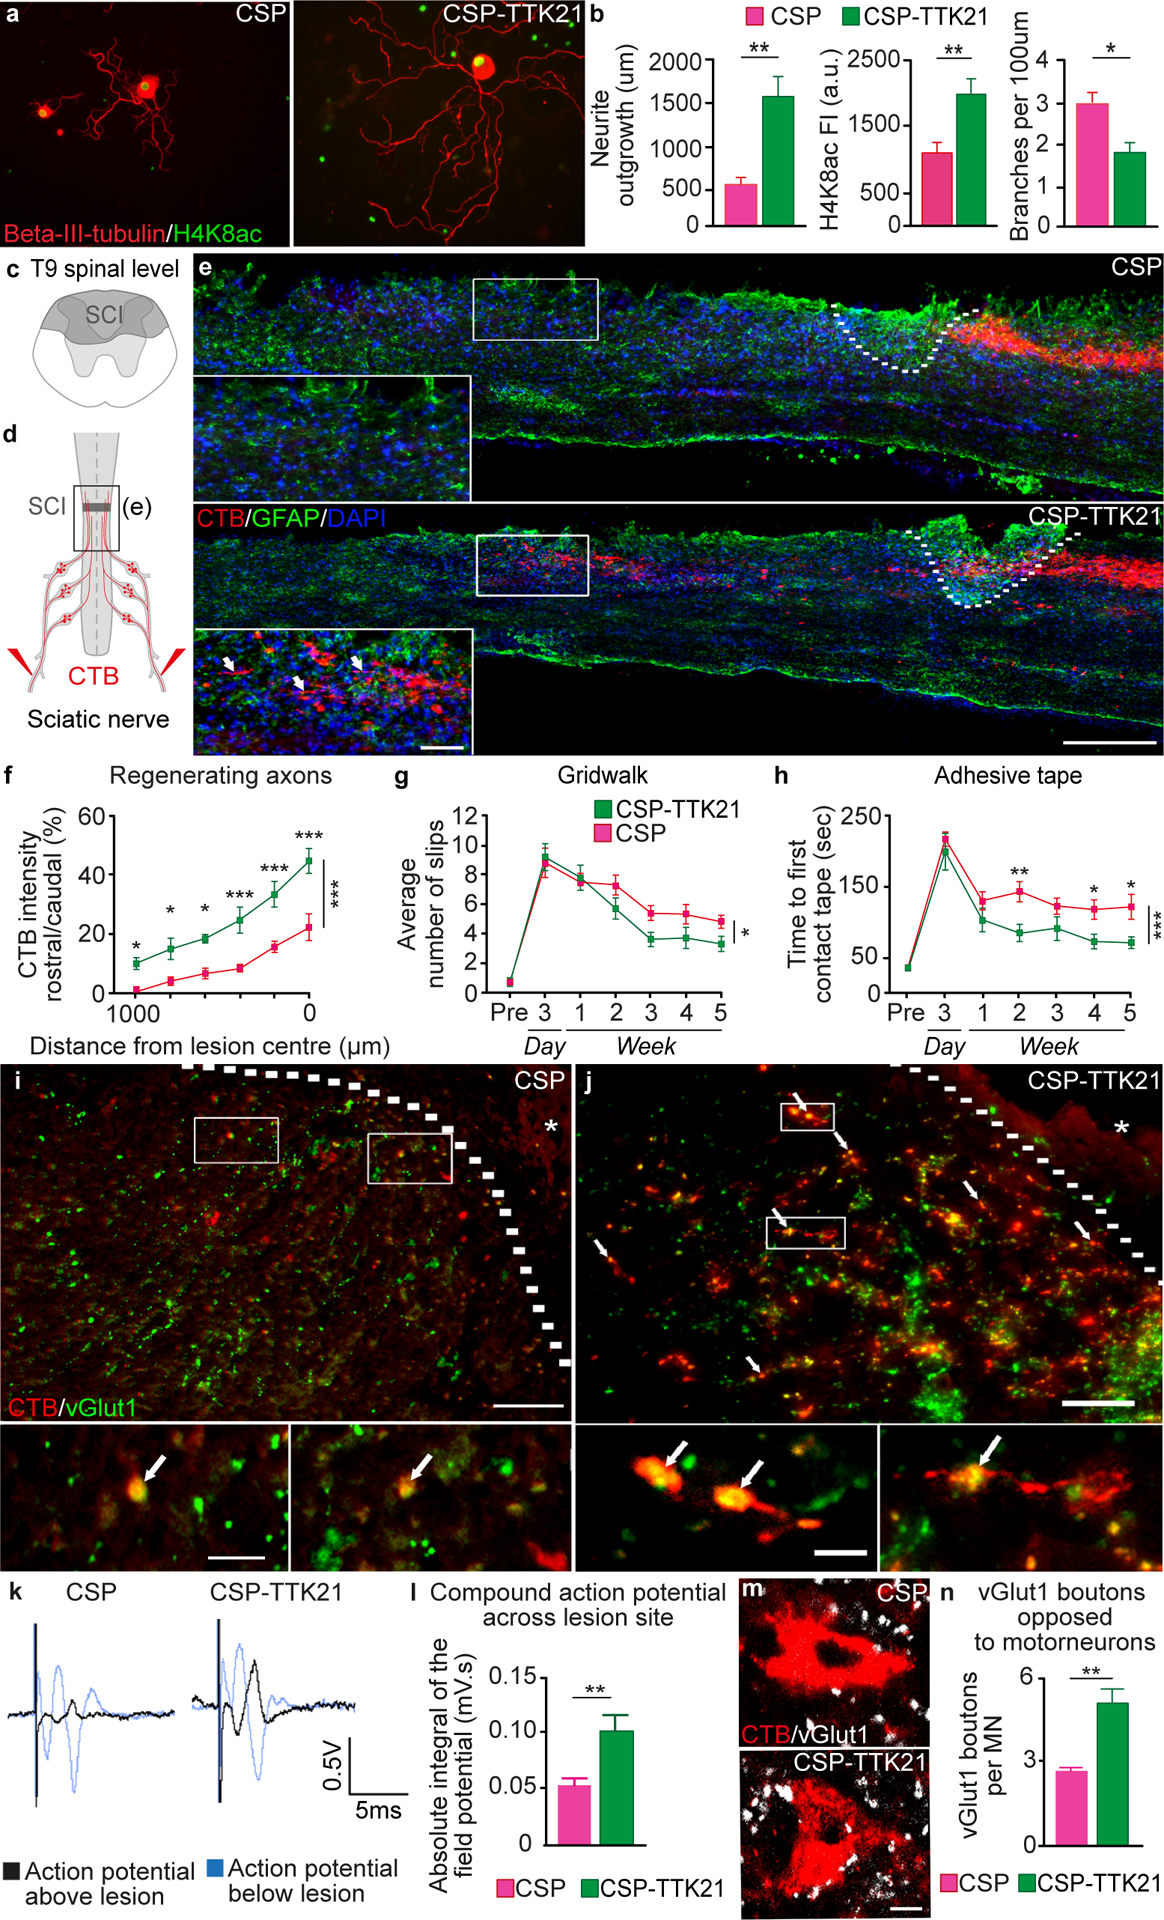
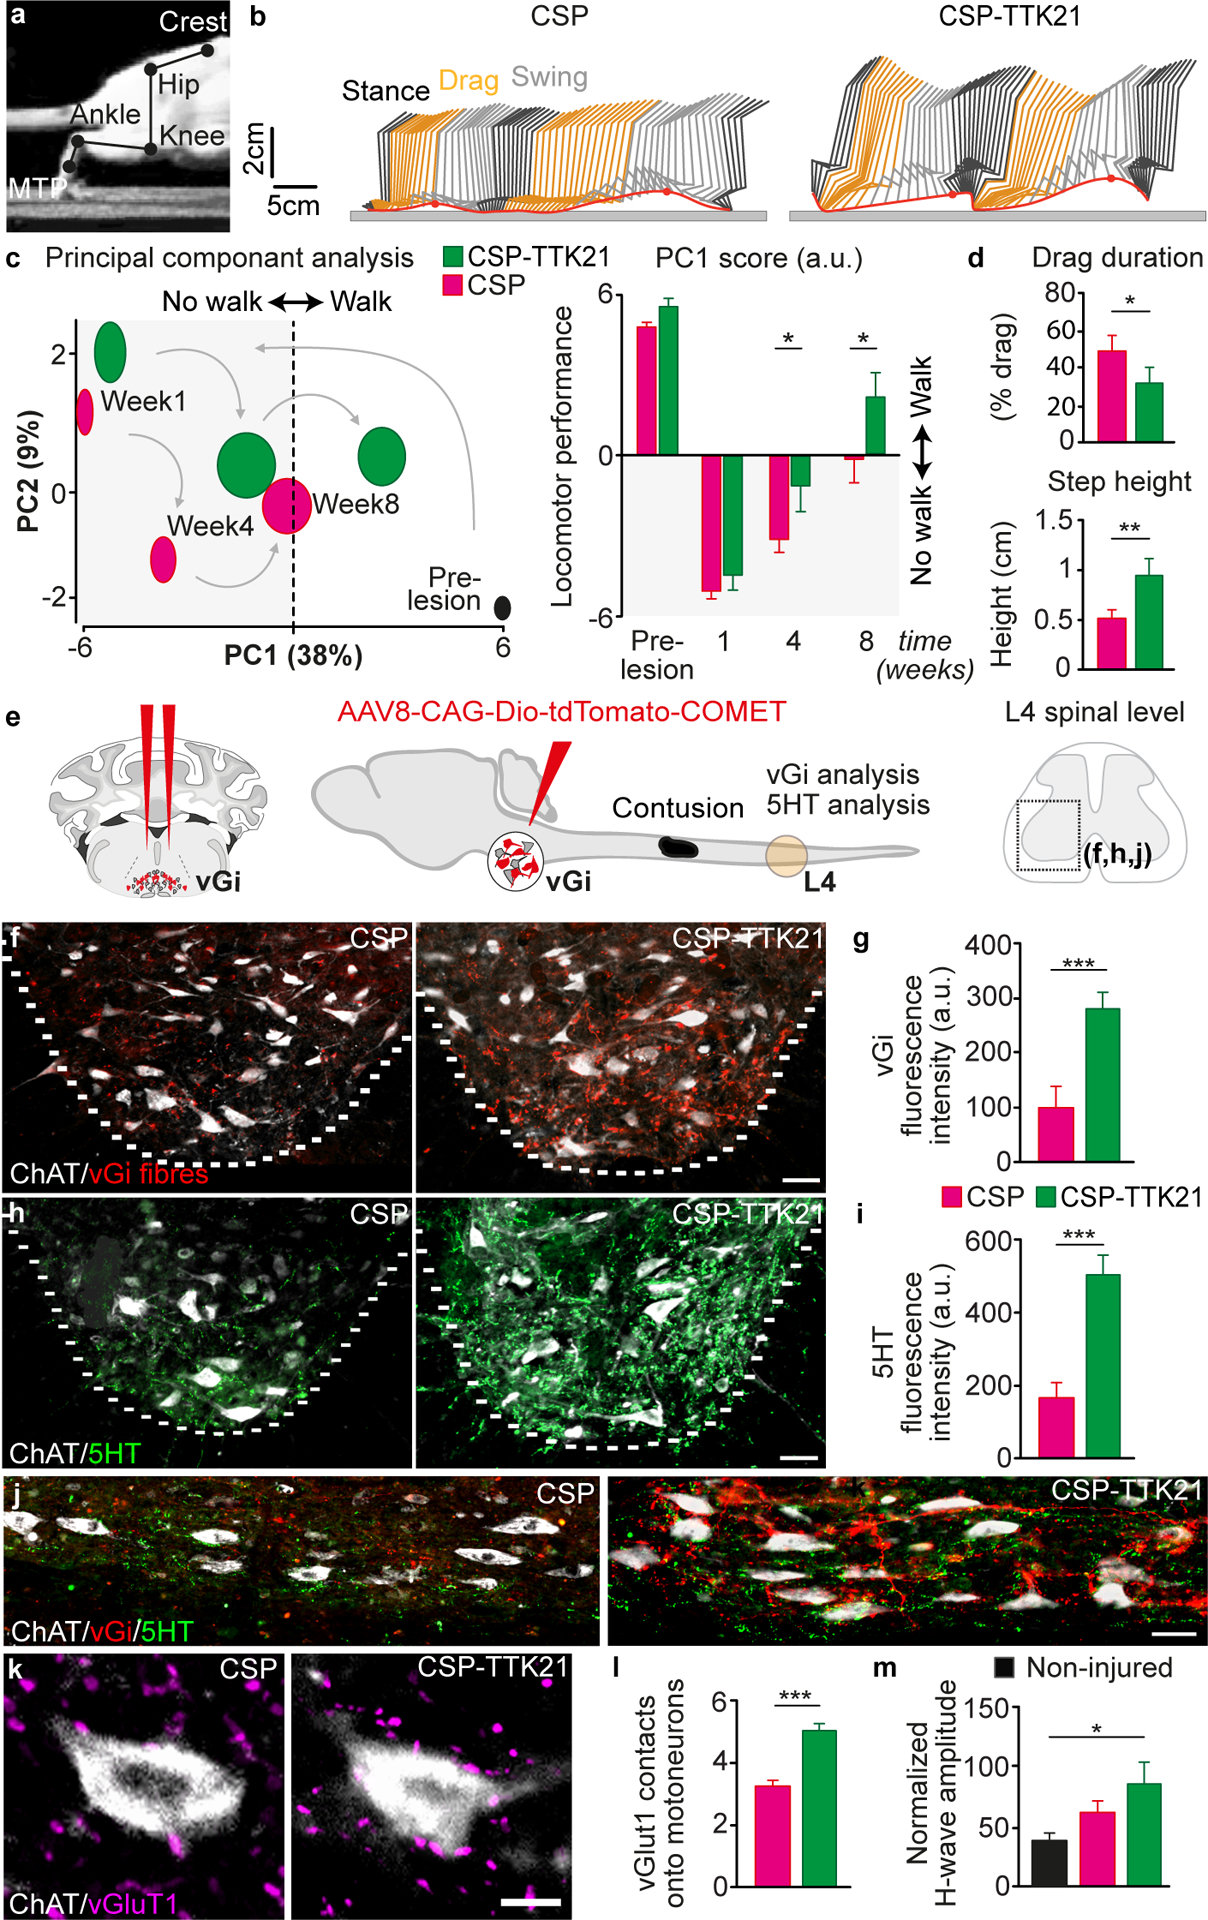
After a spinal cord injury, axons fail to regenerate in the adult mammalian central nervous system, leading to permanent deficits in sensory and motor functions. Increasing neuronal activity after an injury using electrical stimulation or rehabilitation can enhance neuronal plasticity and result in some degree of recovery; however, the underlying mechanisms remain poorly understood. We found that placing mice in an enriched environment before an injury enhanced the activity of proprioceptive dorsal root ganglion neurons, leading to a lasting increase in their regenerative potential. This effect was dependent on Creb-binding protein (Cbp)-mediated histone acetylation, which increased the expression of genes associated with the regenerative program. Intraperitoneal delivery of a small-molecule activator of Cbp at clinically relevant times promoted regeneration and sprouting of sensory and motor axons, as well as recovery of sensory and motor functions in both the mouse and rat model of spinal cord injury. Our findings showed that the increased regenerative capacity induced by enhancing neuronal activity is mediated by epigenetic reprogramming in rodent models of spinal cord injury. Understanding the mechanisms underlying activity-dependent neuronal plasticity led to the identification of potential molecular targets for improving recovery after spinal cord injury.


Conflict of interest statement

Competing interests:

LDFM is the director of the company Research Devices Ltd, but no conflicts of interest arise related to the work reported in this study. GC is a founder and shareholder of the company GTXmedical, but its activity is not directly linked to the interventions reported in this study. TKK holds the following patents related to CSP-TTK21. (a) International Patent: PCT/IN2008/000632. Title of the invention: Intrisically Fluorescent Carbon Nanospheres and a Process thereof. (b) US Patent WO2013160885 A1, US20150119466, European Patent EP2841111 A1. Title of the invention: Nanosphere-Histone Acetyltransferase (HAT) Activator Composition. process and methods thereof. (c) USS Patent:US93145399B2. Title of the invention: Nanosphere-histone acetyltransferase (HAT) activator composition, process and methods thereof. Otherwise the authors declare no competing interests.

Figures

Fig. 1.
Fig. 1.. Environmental enrichment induces a lasting increase in the regenerative potential of sensory neurons.
A, Cultured mouse sciatic DRGs after exposure to EE, stained for Beta-III-tubulin. Scale bar 100 μm. B, Quantification of neurite outgrowth (mean ± SEM, Unpaired Student’s t-tests ***P<0.001, n = 4/group). C, Diagram illustrating the experimental design, sciatic DRGs were cultured from mice that had been placed in EE for 10 days and then returned to SH for up to 5 weeks. D, Example images of sciatic DRGs from mice that had been in SH or EE for 10 days and then SH for 5 weeks. Scale bar 100 μm. E, Quantification of neurite outgrowth in DRGs from mice that had been exposed to EE compared to SH controls (mean ± SEM, unpaired Student’s t test *** P<0.001, n = 4/group).F, Sciatic nerves immunostained for SCG10 after transection and re-anastomosis, Scale bar 500 μm. G, Quantification of regenerating axons (mean ± SEM, Two-way ANOVA, Holm-Sidak post-hoc, ***P<0.001, **P<0.01, *P<0.05 n = 6/group). H, CTB-traced (red) dorsal column axons after injury, DAPI (blue), lesion site (dashed line). Scale bar, 200 μm. I, Quantification of CTB positive regenerating axons (mean ± SEM, Two-way repeated measures ANOVA, Tukey’s post-hoc **P<0.01, ***P<0.001, n = 5/group). J, Electrophysiological setup. K, Representative compound action potentials recorded below (blue) and above (black) injury. L, Quantification of compound action potentials above the lesion (mean ± SEM, One-way ANOVA, Fisher’s LSD post-hoc ***P<0.001, n = 4–7/group).
Fig. 2.
Fig. 2.. Proprioceptive afferent feedback is required for EE-mediated increase in DRG regenerative growth.
A, Schematic of the experimental design, after EE and SH exposure mice underwent sciatic nerve crush injury and CTB injection distal to the crush site, axons that regenerate across the injury site take up CTB and retrogradely transport it to the soma. B, Representative images of co-localization between parvalbumin, substance P or isolectin B4 (green) and CTB (red) in DRGs from EE mice that had undergone a sciatic nerve crush. Scale bar, 50 μm. C, Quantification of the number of CTB positive DRG neurons in mice exposed to EE compared to SH (mean ± SEM, unpaired Student’s t test, ** P<0.01, n = 6/group). D, Quantification of the percentage of CTB positive neurons that co-localized with parvalbumin, substance P or isolectin B4 after exposure to EE or SH. E, Schematic showing Egr3 mutation resulting in degeneration of muscle spindles. F, Beta-III-tubulin stained sciatic DRGs from WT or Egr3−/− mice after exposure to SH or EE. Scale bar 100 μm. G, Quantification of neurite outgrowth. (mean ± SEM, One-way ANOVA, Tukey’s post-hoc, ***P<0.001, n = 4/group). H, Example images of tdTomato (red) positive or tdTomato negative DRGs co-stained with beta-III-tubulin (green) cultured from PV-cre x tdTomato mice that had been exposed to either SH or EE for 10 days. Yellow indicates colocalization between tdTomato and beta-III-tubulin. Scale bar 100 μm. I, Quantification of neurite outgrowth (mean ± SEM, One-way ANOVA, Tukey’s post-hoc, ** P<0.01, *** P<0.001, n = 5/group).
Fig. 3.
Fig. 3.. EE induces signaling pathways involved in neuronal activity, calcium mobilization and the regenerative program of large-diameter DRG neurons.
A, Heatmap of the differentially expressed (DE) genes in whole-DRG and LDN RNA-seq (P<0.05). Color scale represents arbitrary expression units (lowest, blue; highest, red). B, Pie chart of genes in each functional group identified by GO analysis of DE genes in LDN. Functional groups are color-coded. C, Representative images of sciatic nerves transduced with AAV5-GFP, AAV5-hM4Di-mCitrine or AAV5-hM3Dq-mCitrine labeled with mCitrine/GFP after sciatic nerve crush. Arrow-head: lesion site. Scale bar, 500 μm. D, Quantification of axon regeneration (mean ± SEM, Two-way repeated measures ANOVA, Tukey’s posthoc, ***P<0.001, n = 3/group). E, Representative time-lapse images of intracellular calcium release from whole-mount PV-GCaMP DRGs before and after addition of 150 mM KCl. Scale bar, 50 μm. F, Quantification of F/Fo ratio after 50 mM, 100 mM and 150 mM KCl (mean ± SEM, Two-way ANOVA, Sidak’s post-hoc **P<0.01, ***P<0.001, n = 4/group).
Fig. 4.
Fig. 4.. Cbp is required for EE-dependent increase in regeneration potential.
A, DRGs stained for H4K8ac (green), parvalbumin (red) and DAPI (blue). Scale bar, 50 μm. B, Quantification of H4K8ac intensity (mean ± SEM, unpaired Student’s t test *** P<0.001, n = 6/group). C, Examples images of DRGs from mice housed in SH or EE, which were double stained for pCreb (green) and parvalbumin (red). Scale bar, 50 μm. D, Quantification of the fluorescence intensity of pCreb in the nuclei of parvalbumin positive DRGs (mean ± SEM, unpaired Student’s t test *** P<0.001, n = 4/group). E, Immunoblotting analysis for H4K8ac from protein extracts from whole sciatic DRGs after 10 days exposure to SH or EE (mean ± SEM, unpaired Student’s t test, ** P<0.01, n = 3/group). H4K8ac was normalised the levels of H4, Gapdh was used as a loading control. F, Immunoblotting analysis for pCreb from protein extracts of whole sciatic DRGs after 10 days exposure to SH or EE (mean ± SEM, unpaired Student’s t test ** P<0.01, n = 3/group). pCreb was normalised to levels of Creb; Gapdh was used as a loading control. G, DRGs stained for acCbp (green) and total Cbp (red). Scale bar, 50 μm. H, Quantification of acCbp intensity (mean ± SEM, unpaired Student’s t test *** P<0.001, n = 11/group). I, Cultured DRG neurons from WT x Cbpf/f or CaMKIIa-creERT2 x Cbpf/f mice (Beta-III-tubulin, red and H4K8ac, green). Scale bar, 200 μm. J, Quantification of neurite outgrowth (mean ± SEM, One-way ANOVA, Tukey’s post-hoc *** P<0.001, n = 5/group). K, Quantification of H4K8ac intensity (mean ± SEM, One-way ANOVA, Tukey’s post-hoc *** P<0.001, n = 5/group).
Fig. 5.
Fig. 5.. Pharmacological activation of Cbp/p300 promotes sensory axon regeneration and recovery after a dorsal hemisection SCI in mice.
A, Cultured DRG neurons treated with control (CSP) or Cbp/p300 pharmacological activator (CSP-TTK21) (Beta-III-tubulin, red and H4K8ac, green). Scale bar, 50 μm. B, Quantification of neurite outgrowth (mean ± SEM, unpaired Student’s t test **P<0.01, n = 4/group), H4K8ac intensity (mean ± SEM, unpaired Student’s t test **P<0.01, n = 11/group) and neurite branching (mean ± SEM, unpaired Student’s t test *P<0.05, n = 4/group) C, Schematic view of a T9 dorsal column axotomy that lesions the ascending sensory axons in the dorsal columns. D, CTB (red) was injected into the sciatic nerve 5 weeks after SCI. E, CTB-traced (red) dorsal column axons after SCI, Gfap (green), DAPI (blue), lesion site (dashed line). Scale bar, 200 μm. F, Quantification of CTB positive regenerating axons (mean ± SEM, Two-way repeated measures ANOVA, Holm’s Sidak post-hoc ***P<0.001, **P<0.01, *P<0.05, n = 5/group). G, Quantification of slips (mean ± SEM, Two-way repeated measures ANOVA, Fisher’s LSD post-hoc *P<0.05, n = 10/group). H, Quantification of the time required to first contact an adhesive pad placed on the hindpaws (mean ± SEM, Two-way repeated measures ANOVA, Fisher’s LSD post-hoc ***P<0.001, **P<0.01, *P<0.05, n = 10/group). I, Representative image from a control CSP treated mouse showing CTB-positive regenerating axons rostral to the lesion and co-localization with the pre-synaptic marker vGlut1. Lesion site is marked by the dashed line and asterisk. Scale bar, 100 μm, scale bar for insets 10 μm. J, Representative image from a CSP-TTK21 treated mouse showing co-localization of regenerating CTB (red) positive axons rostral to the spinal cord injury site (marked by the dashed line and asterisk) with the pre-synaptic marker vGlut1 (green) to identify prospective nascent synapses (marked by arrows). Scale bar, 100 μm. Higher-magnification images of insets show co-localization of CTB positive axons (red) and vGlut1 (green). Scale bar, 10 μm. K, Quantification of CTB and vGlut1 co-localization rostral to the lesion site (mean ± SEM, unpaired Student’s t test ***P<0.001, n = 6/group). L, Representative compound action potentials recorded below (grey) and above (black) the lesion. M, Quantification of compound action potentials above the lesion (mean ± SEM, unpaired Student’s t test *P<0.05, n = 8–10/group). N, vGluT1 positive boutons (white) from Group-Ia afferents in proximity to hindlimb motoneurons (Red, CTB) below the injury (L1–4). Scale bar, 25 μm. O, Quantification of vGluT1 positive boutons opposed to motoneurons (mean ± SEM, unpaired Student’s t test **P<0.01, n = 8/group).
Fig. 6.
Fig. 6.. Pharmacological Cbp/p300 activation enhances sprouting of both descending motor and ascending sensory axons leading to functional recovery after contusion SCI in rats.
A, Image showing joints used for reconstruction of hindlimb movements B, Representative hindlimb kinematics after treatment with CSP or CSP-TTK21. Black, orange and grey correspond to stance, drag and swing phases of gait, respectively. C, PC analysis of gait parameters averaged for each group at weeks 1, 4 and 8 and quantification of average scores on PC1, which quantify the locomotor performance of rats treated with CSP or CSP-TTK21 (mean ± SEM, Two-way ANOVA, Fisher’s LSD post-hoc * P<0.05, n = 10/group). D, Bar plots of drag duration and step height (mean ± SEM, unpaired Student’s t test * P<0.05, **P<0.01, n = 10/group). E, Schematics showing strategy for tracing vGi axons, T9 contusion and the L4 ventral horn analyzed for vGi and 5HT sprouting. F, Representative images of descending vGi axons (Red) sprouting around motoneurons (ChAT, Cyan) in the lumbar ventral horn after treatment with CSP or CSP-TTK21. Scale bar, 50 μm. G, Quantification of vGi intensity in the ventral horn (mean ± SEM, unpaired Student’s t test, ***P<0.001, n = 8/group). H, Representative images of descending 5HT axons (Magenta) sprouting around motoneurons (ChAT, Cyan) in the lumbar ventral horn after treatment with CSP or CSP-TTK21. Scale bar, 50 μm. I, Quantification of 5HT intensity in the ventral horn (mean ± SEM, unpaired Student’s t test, ***P<0.001, n = 9/group). J, Representative sagittal sections showing sprouting of descending vGi (Red) and 5HT (Green) axons around motoneurons (ChAT, White) below in the injury in the lumbar ventral horn after treatment with CSP or CSP-TTK21. Scale bar, 50 μm. K, vGluT1 positive boutons (yellow) from Group-Ia afferents in proximity to motoneurons (ChAT, Cyan) below the injury (L1–4). Scale bar, 25 μm. L, Quantification of vGluT1 positive boutons opposed to motoneurons (mean ± SEM, unpaired Student’s t test ***P<0.001, n = 9/group). M, Quantification of the H-wave amplitude after treatment with CSP or CSP-TTK21 (mean ± SEM, One-way ANOVA, Tukey’s post-hoc * P<0.05, n = 5–10/group).

References

    1. Sofroniew MV, Dissecting spinal cord regeneration. Nature 557, 343–350 (2018). - PubMed
    1. He Z, Jin Y, Intrinsic Control of Axon Regeneration. Neuron 90, 437–451 (2016). - PubMed
    1. Di Giovanni S, Molecular targets for axon regeneration: focus on the intrinsic pathways. Expert Opin Ther Targets 13, 1387–1398 (2009). - PubMed
    1. Xie F, Zheng B, White matter inhibitors in CNS axon regeneration failure. Exp Neurol 209, 302–312 (2008). - PMC - PubMed
    1. Plunet W, Kwon BK, Tetzlaff W, Promoting axonal regeneration in the central nervous system by enhancing the cell body response to axotomy. J Neurosci Res 68, 1–6 (2002). - PubMed

Publication types

MeSH terms