. 2019 Apr 10;10(1):1662.
doi: 10.1038/s41467-019-09552-9.

Multicolor multiscale brain imaging with chromatic multiphoton serial microscopy

Affiliations

Multicolor multiscale brain imaging with chromatic multiphoton serial microscopy

Lamiae Abdeladim et al. Nat Commun. .

Erratum in

Abstract

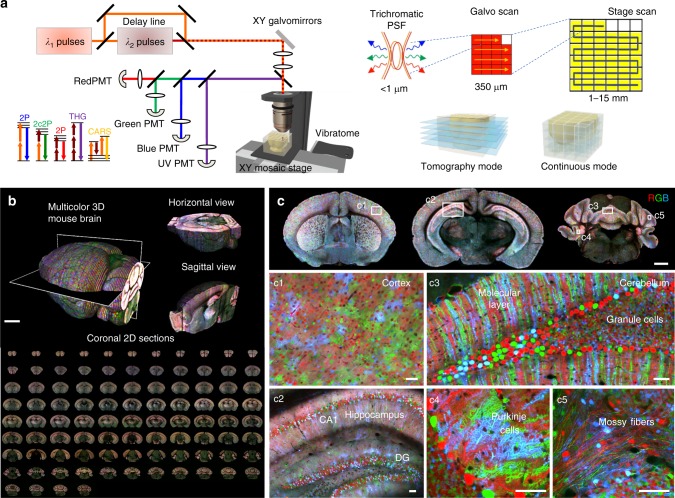
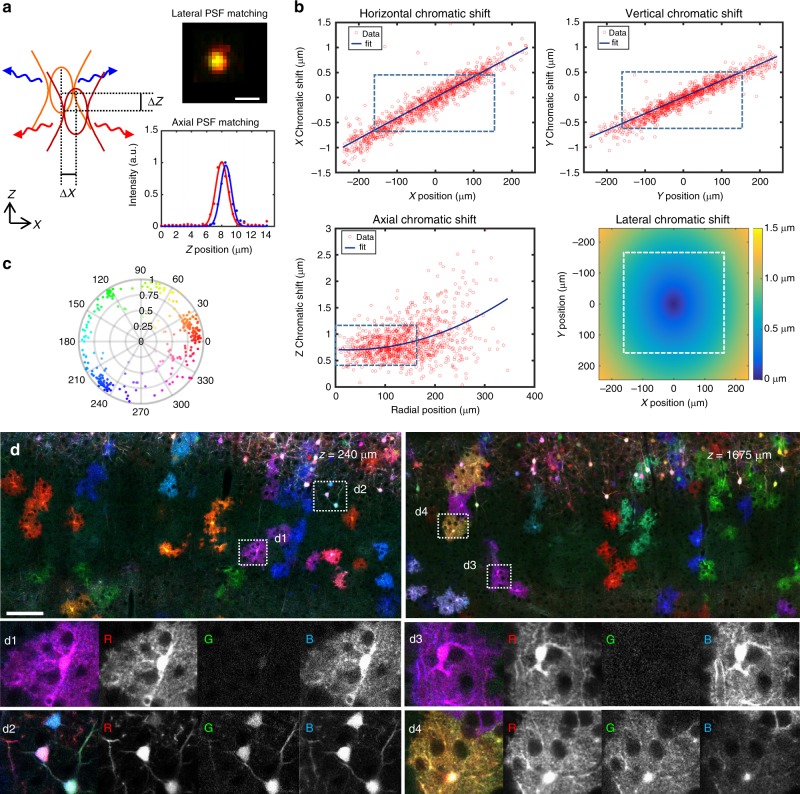
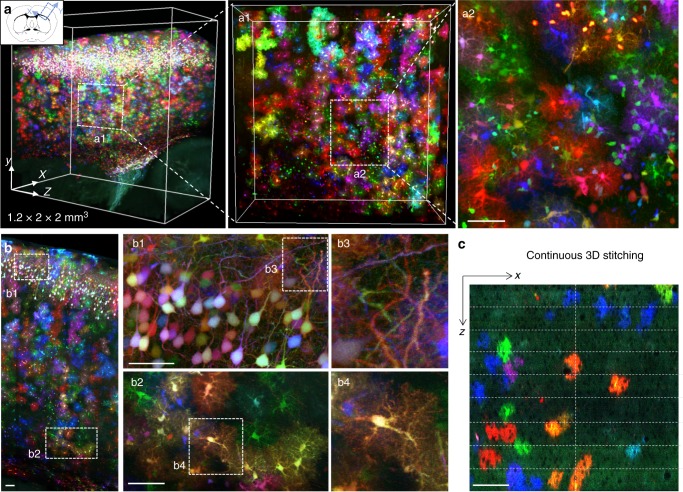
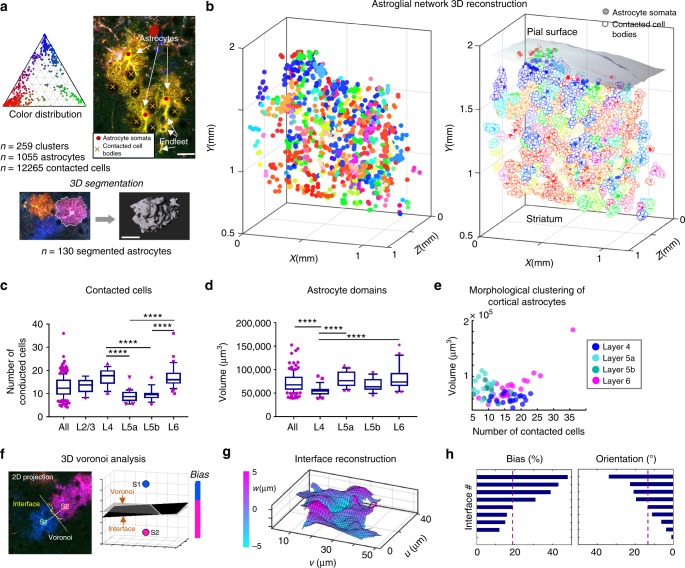
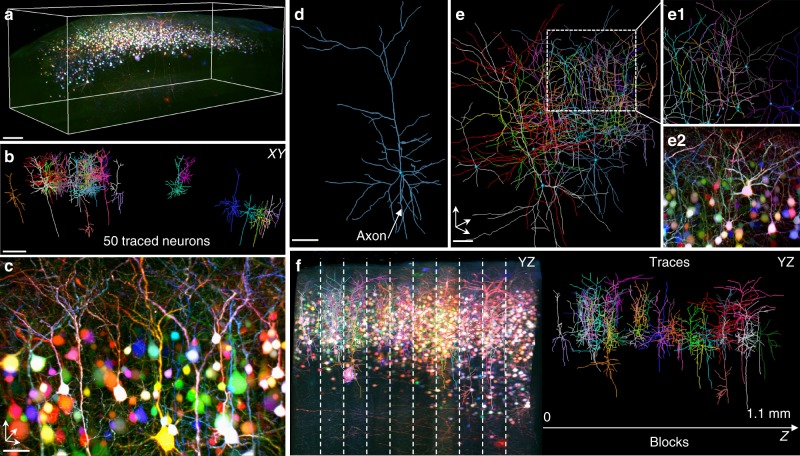
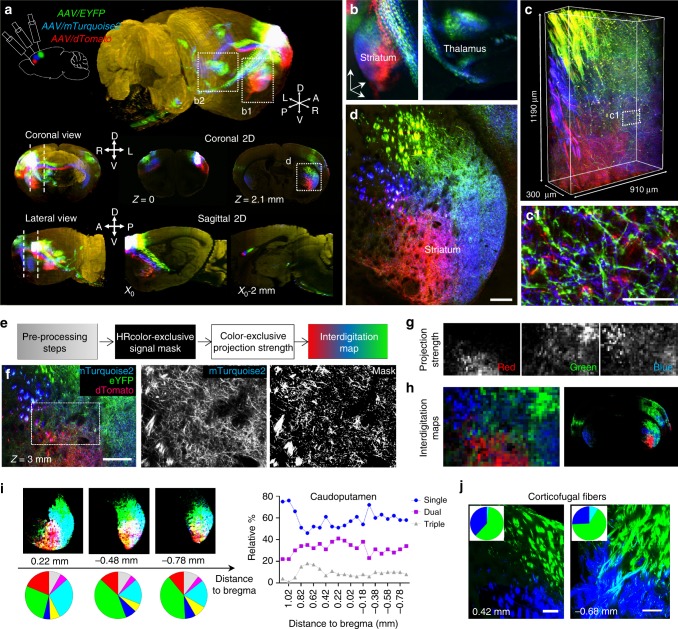
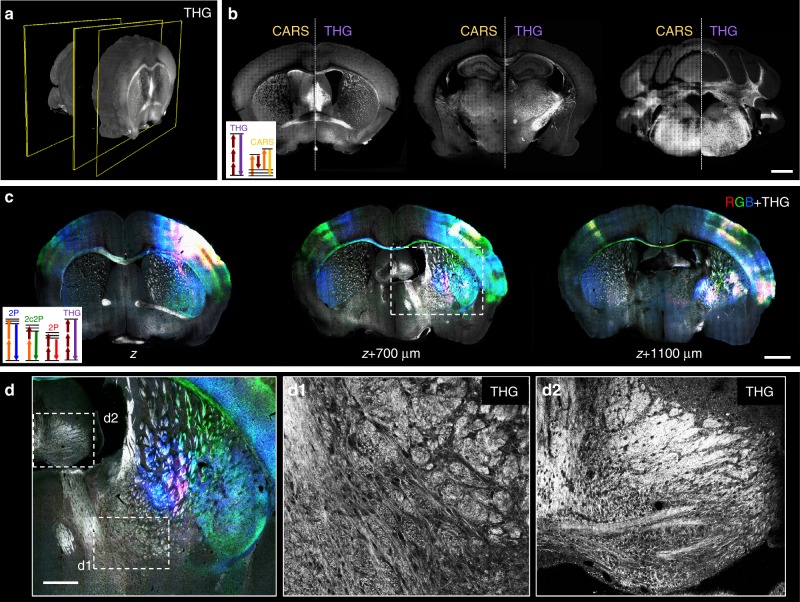
Large-scale microscopy approaches are transforming brain imaging, but currently lack efficient multicolor contrast modalities. We introduce chromatic multiphoton serial (ChroMS) microscopy, a method integrating one-shot multicolor multiphoton excitation through wavelength mixing and serial block-face image acquisition. This approach provides organ-scale micrometric imaging of spectrally distinct fluorescent proteins and label-free nonlinear signals with constant micrometer-scale resolution and sub-micron channel registration over the entire imaged volume. We demonstrate tridimensional (3D) multicolor imaging over several cubic millimeters as well as brain-wide serial 2D multichannel imaging. We illustrate the strengths of this method through color-based 3D analysis of astrocyte morphology and contacts in the mouse cerebral cortex, tracing of individual pyramidal neurons within densely Brainbow-labeled tissue, and multiplexed whole-brain mapping of axonal projections labeled with spectrally distinct tracers. ChroMS will be an asset for multiscale and system-level studies in neuroscience and beyond.


Conflict of interest statement

E.B., P.M., and W.S. are co-authors of a patent that describes multicolor two-photon excitation by wavelength mixing (FR1250990). The remaining authors declare no competing interests.

Figures

Fig. 1
Fig. 1
ChroMS microscopy principle and application for brain-wide multicolor imaging. a ChroMS imaging principle and setup (see Methods). b 3D views from a whole CAG-Cytbow; Nestin-Cremouse brain (10.5 × 7.3 × 9.2 mm3) imaged with ChroMS microscopy. Scale bar: 1 mm. c 2D sub-cellular multicolor brain-wide anatomical maps from the brain in b. Upper panel displays representative coronal views. Middle and lower panel correspond to magnified crops from boxed regions in the coronal views, demonstrating sub-cellular lateral resolution enabling the visualization of dendritic and axonal processes. See also Supplementary Fig. 1 and Supplementary Movies 2–5. Scale bars: 1 mm (upper panel), 50 µm (middle and lower panels). DG: Dentate Gyrus
Fig. 2
Fig. 2
Submicrometer-scale channel registration over millimeter-scale volumes. ChroMS provides multicolor excitation in the 850–1100 nm range with <0.6 µm of chromatic shift in all three directions in the used field of view and at arbitrary depths. a Overlap of the two PSFs is required for wavelength mixing. Axial and lateral chromatic shifts are measured using SHG nanocrystals. Top right: coalignment of the foci at the center of the field of view (fov). Bottom right: axial PSFs corresponding to the two beams measured were axially matched using telescopes placed on each beam path. b Characterization of chromatic aberrations across the fov for the 850 nm/1100 nm wavelength combination. Top: Chromatic lateral shifts ΔX and ΔY as a function of the position in the fov. Measurements were performed on n = 1012 KTP nanocrystals across the fov and data fitted using an affine model. Bottom left: Chromatic axial shift ΔZ as a function of the radial position in the fov. Measurements were performed on n = 1037 KTP nanocrystals across the fov and data fitted using a polynomial model. Bottom right: Lateral chromatic shift mapped across the fov. Lateral chromatic shift is defined as (ΔX2 + ΔX2)0.5 with ΔX and ΔY the corresponding fitted horizontal and vertical chromatic shifts. Dashed boxes outline the effective fov used for ChroMS imaging experiments. c Hue-Saturation polar plot representing the distribution of color combinations expressed in a portion of cortex labeled with the MAGIC markers strategy after spectral unmixing. Multiple color combinations (>20) spanning the HSV color space can be distinguished. d XY representative multicolor images from a MAGIC markers-labeled dataset acquired with ChroMS microscopy with 0.4 µm × 0.4 µm × 1.5 µm voxel size. Insets demonstrate channel co-registration at arbitrary depths within the dataset. Individual channels (R, G, B) are shown in gray scale. Cell structures (astrocyte domains and main processes, cell bodies, axons) can be visualized with multicolor precision (i.e. not affected by chromatic aberrations) and discriminated with a quantitative color ratio. Scale bar: 100 µm
Fig. 3
Fig. 3
Continuous 3D multicolor imaging of mouse cortical tissue. a Multicolor 3D micrometric imaging of a 1.2 × 2 × 2 mm3 volume of a P65 mouse cerebral cortex with ChroMS microscopy, showing multicolor labeling with MAGIC markers. Scale bar: 50 µm. b Maximum intensity projection over 500 µm and XY crops showing high resolution imaging of axons and astrocyte processes with multicolor precision. Scale bars: 200 µm (right panel) and 50 µm (middle panel). c XZ view of nine successively imaged blocks stitched in 3D, showing the continuity of the dataset in depth. Cellular structures are recovered from one block to another with no tissue loss. Scale bar: 100 µm. See also Supplementary Movies 6–8
Fig. 4
Fig. 4
3D analysis of cortical astrocyte morphology and heterogeneity across layers. a Colorimetric and morphological analyses performed on labeled astrocyte in the multicolor dataset shown in Fig. 3. Top left, ternary plot of the color distribution of astrocyte clusters present in the dataset (ensemble of astrocytes expressing a same color combination and continuously in contact with each other). Top right: positioning of astrocyte somata from a cluster and the cells they contact (visible as negatively contrasted). Bottom: 3D segmentation of astrocyte domains. b 3D plots showing labeled astrocytes (color-filled) without (left) or with (right) their contacted cells (white-filled markers) in a 1.2 × 2 × 1 mm3 subvolume of the multicolor dataset shown in Fig. 3. The 3D positions of 1055 glial cells forming 261 color clusters and 12,265 contacting neurons have been extracted in the entire dataset. c, d Number of contacted cells per astrocyte (c) and 3D segmented volumes of astrocyte domains (d) as a function of cortical layers. Data are presented as box-and-whisker plots, central mark representing the median value, bottom and top box edges indicating the 25th and 75th percentiles, whiskers extending to 10 and 90% of min and max values. Non-parametric one-way statistical test (Kruskal–Wallis) followed by post hoc multiple comparison tests (Dunn) have been performed. **** indicates adjusted p-value <0.0001. e Domain volume as a function of the number of contacted cells for individual astrocytes located in cortical layers 4–6. fh Morphological analysis of astrocyte-astrocyte contacts. The interface is reconstructed in 3D and compared to the median position given by a Voronoi tessellation. The proportion of interface on either side of the median plane is computed (bias %) as well as the interface mean orientation (°) relative to the median plane. See also Supplementary Figs. 5 and 6
Fig. 5
Fig. 5
Dense tracing of multicolor-labeled cortical pyramidal neurons. a 3D view of a 2.6 × 0.9 × 1.1 mm3 portion of cerebral cortex electroporated at E15 with a CAG-Cytbow transgene, yielding dense multicolor labeling of layer 2/3 pyramidal neurons. Scale bar: 200 µm. b XY projection of 50 reconstructed neurons within the volume displayed in (a). Scale bar: 150 µm. c 3D view from the volume in a showing color segregation of tufted apical dendrites from individual adjacent neurons. Scale bar: 40 µm. d Example of 3D reconstruction of a pyramidal neuron. Scale bar: 50 µm. e 3D view showing multiplexed neuron tracing in a densely labeled area. Insets (e1) and (e2) show, respectively, a zoom of the boxed area in e and the corresponding color image. Scale bar: 50 µm. f 3D neuron tracing across serially acquired image blocks. Left: YZ projection of the 3D volume represented in a. Dotted vertical lines correspond to junctions between blocks. Right: YZ view of the corresponding neuron traces. See also Supplementary Movies 9 and 10
Fig. 6
Fig. 6
Brain-wide multiplexed projection mapping with ChroMS microscopy. a Brain-wide mapping of neural projections using tricolor AAV anterograde labeling and ChroMS imaging. 3D, coronal and sagittal views of the 3 labeled projections. See also Supplementary Movies 11–14. b 3D views extracted from the multicolor volume showing tridimensional topography patterns in target regions (striatum, thalamus). c Continuous high-resolution 910 × 1190 × 300 µm3 volume acquired with 0.4 × 0.4 × 1.5 µm3 voxel size in the striatum, within the brain-wide dataset. (c1) Magnification of the boxed region in c showing intermingled axonal processes. Scale bar: 30 µm. d Magnification of the region boxed in a showing topographic arrangement of labeled projections in the striatum. Scale bar: 200 µm. eh Multiplexed quantitative projection analysis. The general workflow is summarized in e. See also Supplementary Figs. 7–10. High-resolution binary signal masks (g) are computed for each spectrally unmixed channel to separate fluorescence signal from background. For each channel mask, pixels detected in other channels are removed to generate color exclusive binary masks. The signal ratio over non-overlapping blocks of 30 × 30 pixels (24 × 24 µm2) is then computed to generate three exclusive projection strength maps (g). Red, green, and blue projection strength maps are merged into quantitative color maps of interdigitation (h). Scale bar (f): 200 µm. i Quantitative projection analysis in the caudoputamen (CP). Left: Three representative interdigitation maps at different rostro-caudal positions throughout the CP and corresponding interdigitation diagrams. Diagram color code: red, green, and blue correspond to single red, green, and blue projections, respectively; yellow, cyan, and magenta correspond to dual red+green, green+blue, and red+blue projections, respectively; gray corresponds to interdigitation of the three projections. Right: relative proportion of single, dual, and triple projections throughout the caudoputamen. See also Methods, Supplementary Fig. 11 and Supplementary Movie 14. j Analysis of the topography of striato-pallidal fiber arrangement reveals segregated parallel pathways throughout the striatum (left) followed by partial fiber interdigitation when passing through the external pallidus (right). Scale bars: 100 µm. See also Supplementary Fig. 12
Fig. 7
Fig. 7
Brain-wide multimodal imaging using endogenous nonlinear contrasts. a, b Label-free THG-CARS serial imaging. a Coronal 3D view from the brain-wide THG channel. b Representative coronal sections showing combined THG/CARS images acquired with ChroMS imaging. Excitation wavelengths set to 832/1090 nm match the CH2 stretching vibrational band at 2845 cm1 and produce CARS at 673 nm. THG from the 1090 nm beam is detected at 363 nm. Scale bar: 1 mm. c, d Multicolor+THG coronal sections extracted from a 8 × 11 × 5 mm3 volume using 840/1100 nm excitation. Three AAV anterograde tracers (DsRed Express, YFP, and mCerulean) were injected in motor and somato-sensory cortex. c Overlay of multicolor (RGB) and THG (grays) 2D coronal images acquired simultaneously. Scale bar: 1 mm. d Magnification of the boxed area in c showing multicolor-labeled neural projections along with morphological landmarks. THG signals highlight cytoarchitecture and lipid-rich structures such as myelinated axons (d1–d2). Scale bar: 500 µm

Comment in

References

    1. Livet J, et al. Transgenic strategies for combinatorial expression of fluorescent proteins in the nervous system. Nature. 2007;450:56–62. doi: 10.1038/nature06293. - DOI - PubMed
    1. Cai D, Cohen KB, Luo T, Lichtman JW, Sanes JR. Improved tools for the Brainbow toolbox. Nat. Methods. 2013;10:540–547. doi: 10.1038/nmeth.2450. - DOI - PubMed
    1. Kim EJ, Jacobs MW, Ito-Cole T, Callaway EM. Improved monosynaptic neural circuit tracing using engineered rabies virus glycoproteins. Cell Rep. 2016;15:692–699. doi: 10.1016/j.celrep.2016.03.067. - DOI - PMC - PubMed
    1. Hammer S, Monavarfeshani A, Lemon T, Su J, Fox MA. Multiple retinal axons converge onto relay cells in the adult mouse thalamus. Cell Rep. 2015;12:1575–1583. doi: 10.1016/j.celrep.2015.08.003. - DOI - PMC - PubMed
    1. Tsuriel S, Gudes S, Draft RW, Binshtok AM, Lichtman JW. Multispectral labeling technique to map many neighboring axonal projections in the same tissue. Nat. Methods. 2015;12:547–552. doi: 10.1038/nmeth.3367. - DOI - PubMed

Publication types

MeSH terms

Supplementary concepts