. 2019 Apr 10;10(1):1668.
doi: 10.1038/s41467-019-09656-2.

A CRISPR-Cas9 delivery system for in vivo screening of genes in the immune system

Affiliations

A CRISPR-Cas9 delivery system for in vivo screening of genes in the immune system

Martin W LaFleur et al. Nat Commun. .

Abstract

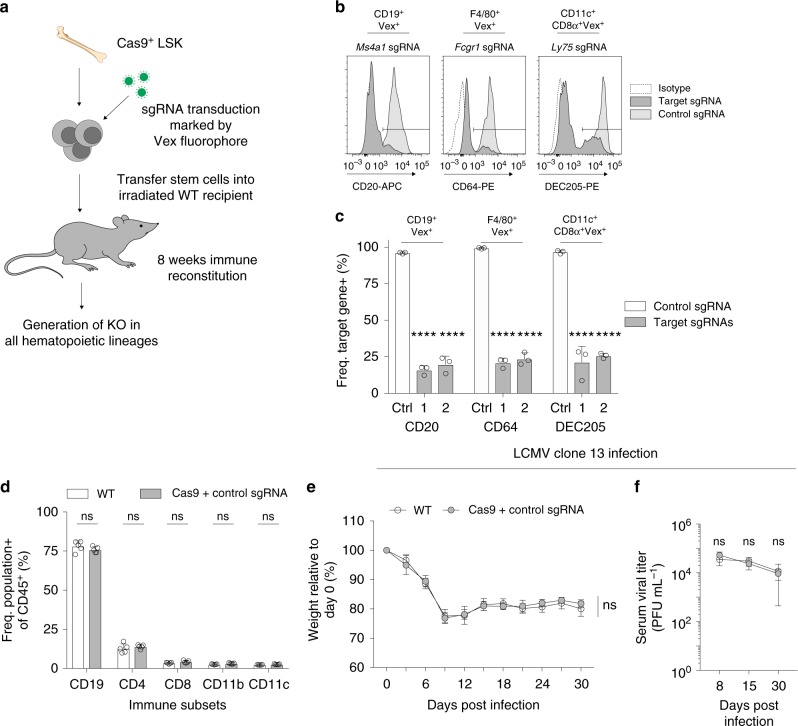
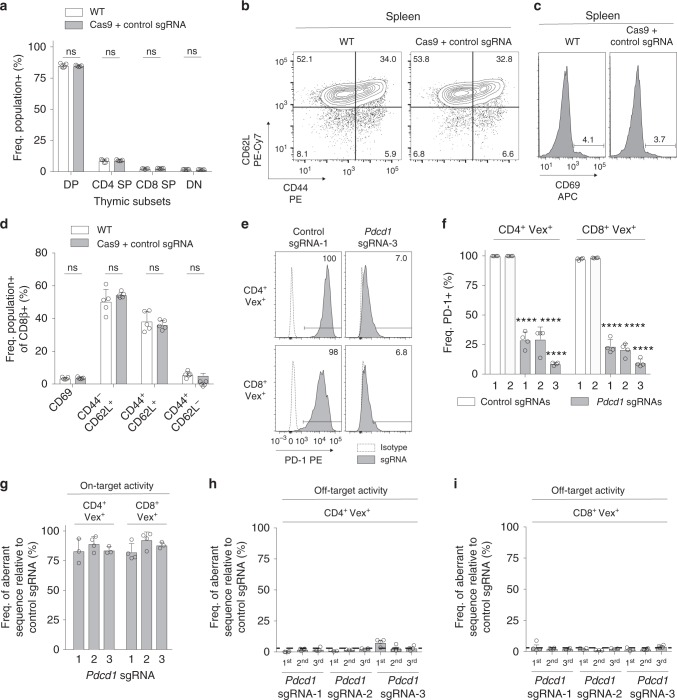
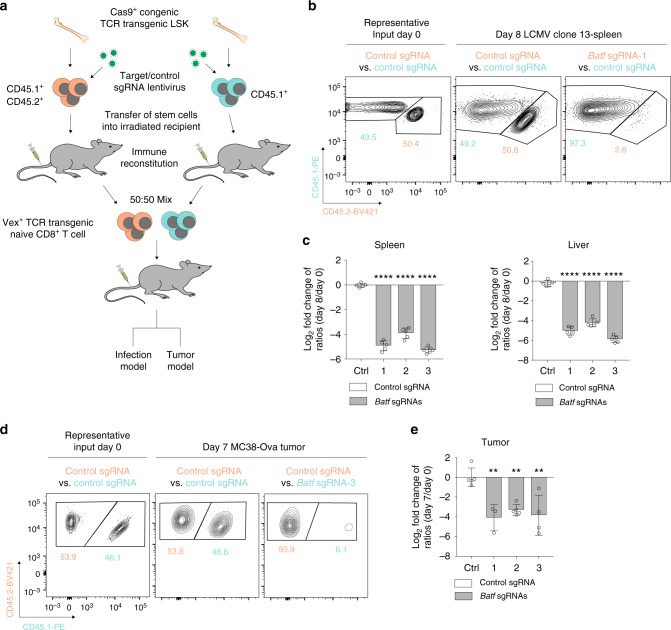
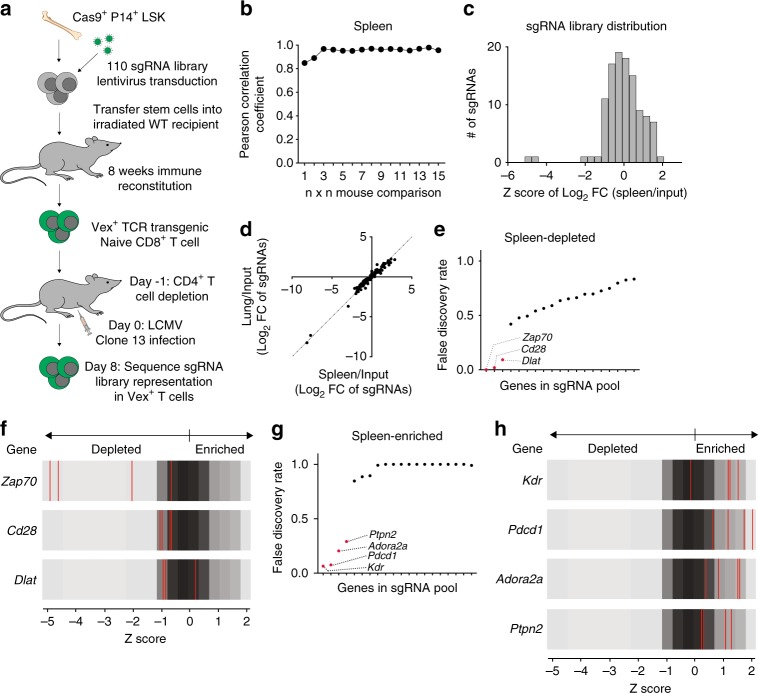
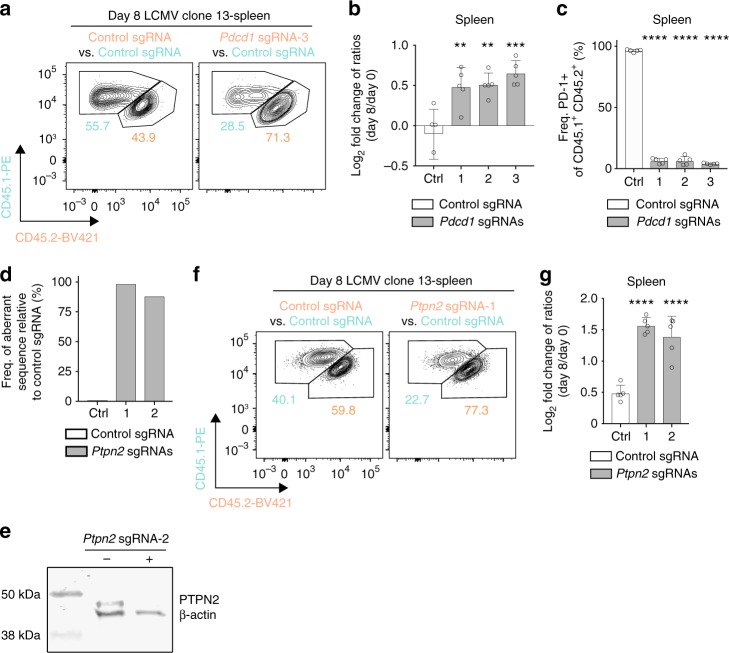
Therapies that target the function of immune cells have significant clinical efficacy in diseases such as cancer and autoimmunity. Although functional genomics has accelerated therapeutic target discovery in cancer, its use in primary immune cells is limited because vector delivery is inefficient and can perturb cell states. Here we describe CHIME: CHimeric IMmune Editing, a CRISPR-Cas9 bone marrow delivery system to rapidly evaluate gene function in innate and adaptive immune cells in vivo without ex vivo manipulation of these mature lineages. This approach enables efficient deletion of genes of interest in major immune lineages without altering their development or function. We use this approach to perform an in vivo pooled genetic screen and identify Ptpn2 as a negative regulator of CD8+ T cell-mediated responses to LCMV Clone 13 viral infection. These findings indicate that this genetic platform can enable rapid target discovery through pooled screening in immune cells in vivo.


Conflict of interest statement

A.H.S. has patents on the PD-1 pathway licensed by Roche/Genentech and Novartis, and consults for Novartis. W.N.H. has a patent application on T cell exhaustion-specific enhancers. A.H.S. and W.N.H. have a patent application on PTPN2 as a therapeutic target held/submitted by Dana-Farber Cancer Institute. J.G.D. and W.N.H. consult for Tango Therapeutics. The remaining authors declare no competing interests.

Figures

Fig. 1
Fig. 1
CHIME enables deletion of genes without impairing immune homeostasis. a Schematic of chimeric CRISPR-Cas9 system. b CD20 (left), CD64 (middle), or DEC205 (right) expression on B cells, macrophages, or dendritic cells, respectively from chimeric animals following transduction with a non-targeting control sgRNA or targeting sgRNAs to Ms4a1, Fcgr1, or Ly75. c Quantification of CD20, CD64, and DEC205 expression on relevant lineages from (b). d Comparison of frequencies of major immune lineages (of CD45+) in chimera mice (WT: WT stem cells mock transduced, Cas9 + sgRNA: Cas9 stem cells transduced with the Vex sgRNA expression vector) at homeostasis. e, f Chimeric mice were infected with 4 × 106 plaque-forming units (PFU) LCMV Clone 13 and their weight loss (e) and serum viral titer (f) were determined. All experiments had at least three biological replicate animals per group and are representative of two independent experiments. Bar graphs represent mean and error bars represent standard deviation. Statistical significance was assessed among the replicate bone marrow chimeras by one-way ANOVA (c, d), or two-way ANOVA (e, f) (*p < .05, **p < .01, ***p < .001, ****p < .0001). See also Supplementary Fig. 1 and 2. Source data are provided as a source data file
Fig. 2
Fig. 2
Deletion of genes in naive T cells with minimal off-target editing using CHIME. a Quantification of thymic subsets (CD4 CD8, CD4 CD8+, CD4+ CD8, CD4+ CD8+) from WT or Cas9 + control sgRNA chimeric mice. b Representative flow cytometry plots of CD44, CD62L, and c CD69 from splenic CD8+ T cells. d Quantification of naïve status of CD8+ T cells in (b, c). e Flow cytometry plots of PD-1 expression in CD4+ T cells (top panel) and CD8+ T cells (bottom panel) from representative non-targeting control sgRNA or Pdcd1 sgRNA chimeras following αCD3/CD28 stimulation. f Quantification of PD-1 expression for two control and three Pdcd1 sgRNAs from (e). g TIDE assay on naïve CD4+ and CD8+ T cells for three Pdcd1 targeting sgRNAs. h, i TIDE assay on naïve (h) CD4+ and (i) CD8+ T cells designed to detect the top three predicted off-target sites (1st, 2nd, 3rd) for three Pdcd1 targeting sgRNAs. Dashed line represents the aberrant sequence (%) when comparing two non-targeting control sgRNAs (background aberrant sequence). All experiments had at least three biological replicate animals per group and are representative of two independent experiments. Bar graphs represent mean and error bars represent standard deviation. Statistical significance was assessed among the replicate bone marrow chimeras by one-way ANOVA (a, d, f) (*p < .05, **p < .01, ***p < .001, ****p < .0001). See also Supplementary Fig. 2. Source data are provided as a source data file
Fig. 3
Fig. 3
CHIME recovers known positive regulators of effector CD8+ T cell responses. a Schematic of competitive assays. b Representative input and output flow cytometry plots of P14 T cells containing control sgRNA vs. control or Batf sgRNAs in the spleen 8 days post LCMV Clone 13 viral infection. c Quantification of P14 T cells containing control or Batf sgRNAs from the spleen (left) and liver (right) in (b), normalizing the output flow cytometry plots to the input ratios at day 0 and log2 transforming the data. d Representative output flow cytometry plots of OT-1 T cells containing control sgRNA vs. control or Batf sgRNAs in MC38-OVA tumors on day 7 post injection. e Quantification of OT-1 T cells containing control or Batf sgRNAs in (d) with normalization of the output flow cytometry plots to the input ratios at day 0 and log2 transformation of the data. All experiments had three biological replicate animals per group and are representative of two independent experiments. Bar graphs represent mean and error bars represent standard deviation. Statistical significance was assessed among the replicate recipients of transferred T cells by one-way ANOVA (c, e) (*p < .05, **p < .01, ***p < .001, ****p < .0001). See also Supplementary Fig. 2. Source data are provided as a source data file
Fig. 4
Fig. 4
In vivo screening identifies regulators of CD8+ T cell responses to LCMV. a Schematic for in vivo screening. b Plot of Pearson R correlation vs. the number of replicate mice analyzed in the spleen from mice used in experiment in the screen. c Histogram depicting the distribution of the 110 sgRNAs relative to their log2 fold change (spleen/input). d Correlation of lung/input log2 fold change vs. spleen/input log2 fold change. Dotted line depicts a perfect correlation (y = x). e Plot of the STARS calculated FDR for depleted in the spleen at day 8 post LCMV infection compared with input (y-axis) vs. the genes in the screening library (x-axis). Labeled genes are genes called as hits based on the FDR distribution. f Z-score plots of genes identified as depleted hits. Grey represents the background distribution of the library and red lines represent the four individual sgRNAs for the given genes. g Plot of the STARS calculated FDR for enriched in the spleen at day 8 post LCMV infection compared with input (y-axis) vs. the genes in the screening library (x-axis). Labeled genes are genes called as hits based on the FDR distribution. h Z-score plots of genes identified as enriched hits. Grey represents the background distribution of the library and red lines represent the four individual sgRNAs for the given genes. The in vivo screen had thirty biological replicate animals per group and is representative of one experiment. False discovery rate was assessed by the STARS software. See also Supplementary Fig. 3. Source data are provided as a source data file
Fig. 5
Fig. 5
Pdcd1 and Ptpn2 are negative regulators of CD8+ T cell responses to LCMV. a Representative output flow cytometry plots of P14 T cells containing control sgRNA vs. control or Pdcd1 sgRNAs in the spleen day 8 post LCMV Clone 13 viral infection. b Quantification of (a) with normalization of the output flow cytometry plots to the input ratios at day 0 and log2 transformation of the data. c Quantification of PD-1 expression on P14 T cells containing control sgRNA or Pdcd1 sgRNAs in the spleen day 8 post LCMV Clone 13 viral infection. d TIDE assay on naive CD8+ T cells containing control sgRNA or Ptpn2 sgRNAs. e Cropped western blot of splenic CD8+ T cells from control sgRNA or Ptpn2 sgRNA-containing chimeras. f Representative output flow cytometry plots of P14 T cells containing control sgRNA vs. control or Ptpn2 sgRNAs in the spleen day 8 post LCMV Clone 13 viral infection. g Quantification of (f) with normalization of the output flow cytometry plots to the input ratios at day 0 and log2 transformation of the data. All experiments (except western blot) had five biological replicate animals per group and are representative of two independent experiments. Western blot had two pooled mice per group and is representative of three independent experiments. Bar graphs represent mean and error bars represent standard deviation. Statistical significance was assessed among the replicate recipients of transferred T cells by one-way ANOVA (b, c, g) (*p < .05, **p < .01, ***p < .001, ****p < .0001). Source data are provided as a source data file

References

    1. Rainsford KD. Anti-inflammatory drugs in the 21st century. Subcell. Biochem. 2007;42:3–27. doi: 10.1007/1-4020-5688-5_1. - DOI - PubMed
    1. Li P, Zheng Y, Chen X. Drugs for autoimmune inflammatory diseases: from small molecule compounds to anti-TNF biologics. Front. Pharmacol. 2017;8:460. doi: 10.3389/fphar.2017.00460. - DOI - PMC - PubMed
    1. LaFleur MW, Muroyama Y, Drake CG, Sharpe AH. Inhibitors of the PD-1 pathway in tumor therapy. J Immunol. 2018;200:375–383. doi: 10.4049/jimmunol.1701044. - DOI - PMC - PubMed
    1. Moody SE, Boehm JS, Barbie DA, Hahn WC. Functional genomics and cancer drug target discovery. Curr. Opin. Mol. Ther. 2010;12:284–293. - PubMed
    1. Westbrook TF, et al. A genetic screen for candidate tumor suppressors identifies REST. Cell. 2005;121:837–848. doi: 10.1016/j.cell.2005.03.033. - DOI - PubMed

Publication types

MeSH terms

Substances