. 2019 Apr 10;10(1):1660.
doi: 10.1038/s41467-019-09652-6.

Age-specific differences in the dynamics of protective immunity to influenza

Affiliations

Age-specific differences in the dynamics of protective immunity to influenza

Sylvia Ranjeva et al. Nat Commun. .

Abstract

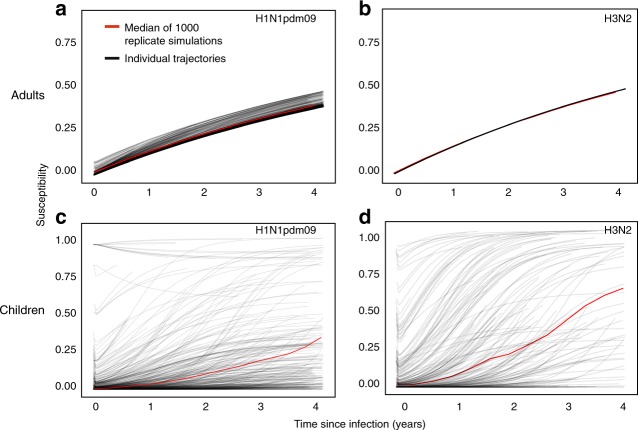
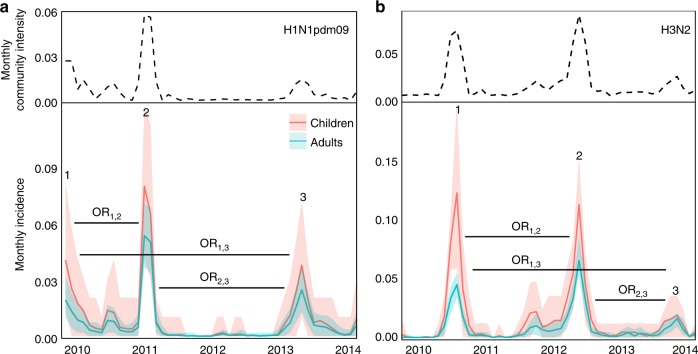
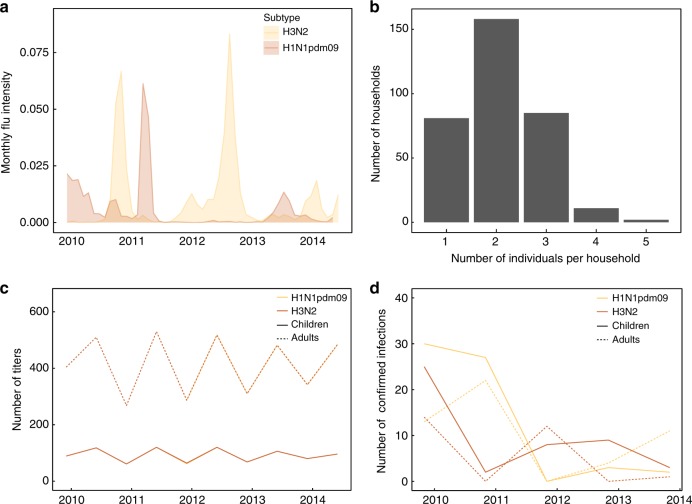
Influenza A viruses evolve rapidly to escape host immunity, causing reinfection. The form and duration of protection after each influenza virus infection are poorly understood. We quantify the dynamics of protective immunity by fitting individual-level mechanistic models to longitudinal serology from children and adults. We find that most protection in children but not adults correlates with antibody titers to the hemagglutinin surface protein. Protection against circulating strains wanes to half of peak levels 3.5-7 years after infection in both age groups, and wanes faster against influenza A(H3N2) than A(H1N1)pdm09. Protection against H3N2 lasts longer in adults than in children. Our results suggest that influenza antibody responses shift focus with age from the mutable hemagglutinin head to other epitopes, consistent with the theory of original antigenic sin, and might affect protection. Imprinting, or primary infection with a subtype, has modest to no effect on the risk of non-medically attended infections in adults.


Conflict of interest statement

B.J.C. has received research funding from Sanofi, and honoraria from Sanofi and Roche. The remaining authors declare no competing interests.

Figures

Fig. 1
Fig. 1
Schematic of modeling approach. Steps 1 and 2 are performed for each subtype. Step 1: Model fitting. a First, the sub-model of short-term post-infection titer dynamics is fitted to a subset of the data. This subset includes the time of PCR-confirmed infection and the immediate pre- and post-infection titers. The mean and standard deviation of the acute titer boost and the mean’s dependence on pre-infection titer (the antibody ceiling effect) are fitted. b Next, fixing the parameters associated with short-term titer dynamics (a), the full model is fitted to titers from the entire cohort. The contribution of HI-correlated and non-HI-correlated protection, the titer waning rate, the 50% protective titer, and the long-term boost after infection are estimated. Step 2: Model predictions and validation. c The duration of protection and inter-epidemic protection are estimated from simulating population-level dynamics from the best-fit model in b. From the latent infections and susceptibility for each individual, we track the loss of protection after infection. We also estimate the cumulative epidemic incidence and the odds ratios (OR) of protection between epidemics. d Simulation enables additional checks of the model. We compare the simulated and observed distributions of n-fold titer rises and coefficients of titer variation among individuals
Fig. 2
Fig. 2
Susceptibility after simulated infection with H1N1pdm09 and H3N2 in adults and children. Susceptibility is shown after simulated infection (at time t = 0) for adults with H1N1pdm09 (a) and H3N2 (b) and for children with H1N1pdm09 (c) and H3N2 (d). The black lines represent individual trajectories from one simulation, and the red line represents the median among individuals over 1000 replicate simulations. Curves from individual trajectories are truncated at points corresponding to the end of the study
Fig. 3
Fig. 3
Simulated monthly H1N1pdm09 and H3N2 incidence. Simulated monthly incidence for H1N1pdm09 (a, bottom) and H3N2 (b, bottom) in children and adults, averaged over 1000 simulations, contrasted with respective monthly community intensities (a, b, top). The shaded areas are bounded by the 2.5 and 97.5% quantiles from the simulations. Horizontal black bars denote inter-epidemic periods for odds ratios (OR)
Fig. 4
Fig. 4
Features of the data. a Community intensity of H3N2 and H1N1pdm09 (ILI × % influenza-positive) over the study. b Distribution of household sizes in the study cohort. c Number of titer samples for H3N2 and H1N1pdm09 in children and adults over the study. d Number of PCR-confirmed infections with H3N2 and H1N1pdm09 in children and adults over the study. The raw data are provided as a Data Source file

References

    1. Wiley DC, Wilson IA, Skehel JJ. Structural identification of the antibody-binding sites of Hong Kong influenza haemagglutinin and their involvement in antigenic variation. Nature. 1981;289:373–378. doi: 10.1038/289373a0. - DOI - PubMed
    1. Caton AJ, Brownlee GG, Yewdell JW, Gerhard W. The antigenic structure of the influenza virus A/PR/8/34 hemagglutinin (H1 subtype) Cell. 1982;31:417–427. doi: 10.1016/0092-8674(82)90135-0. - DOI - PubMed
    1. Yu X, et al. Neutralizing antibodies derived from the B cells of 1918 influenza pandemic survivors. Nature. 2008;455:532–536. doi: 10.1038/nature07231. - DOI - PMC - PubMed
    1. Hancock K, et al. Cross-reactive antibody responses to the 2009 pandemic H1N1 Influenza virus. N Engl. J. Med. 2009;361:1945–1952. doi: 10.1056/NEJMoa0906453. - DOI - PubMed
    1. Cobey S, Hensley SE. Immune history and influenza virus susceptibility. Curr. Opin. Virol. 2017;22:105–111. doi: 10.1016/j.coviro.2016.12.004. - DOI - PMC - PubMed

Publication types

MeSH terms