. 2019 Apr;3(4):383-392.
doi: 10.1038/s41562-019-0537-2. Epub 2019 Feb 25.

Amount and time exert independent influences on intertemporal choice

Affiliations

Amount and time exert independent influences on intertemporal choice

Dianna R Amasino et al. Nat Hum Behav. 2019 Apr.

Abstract

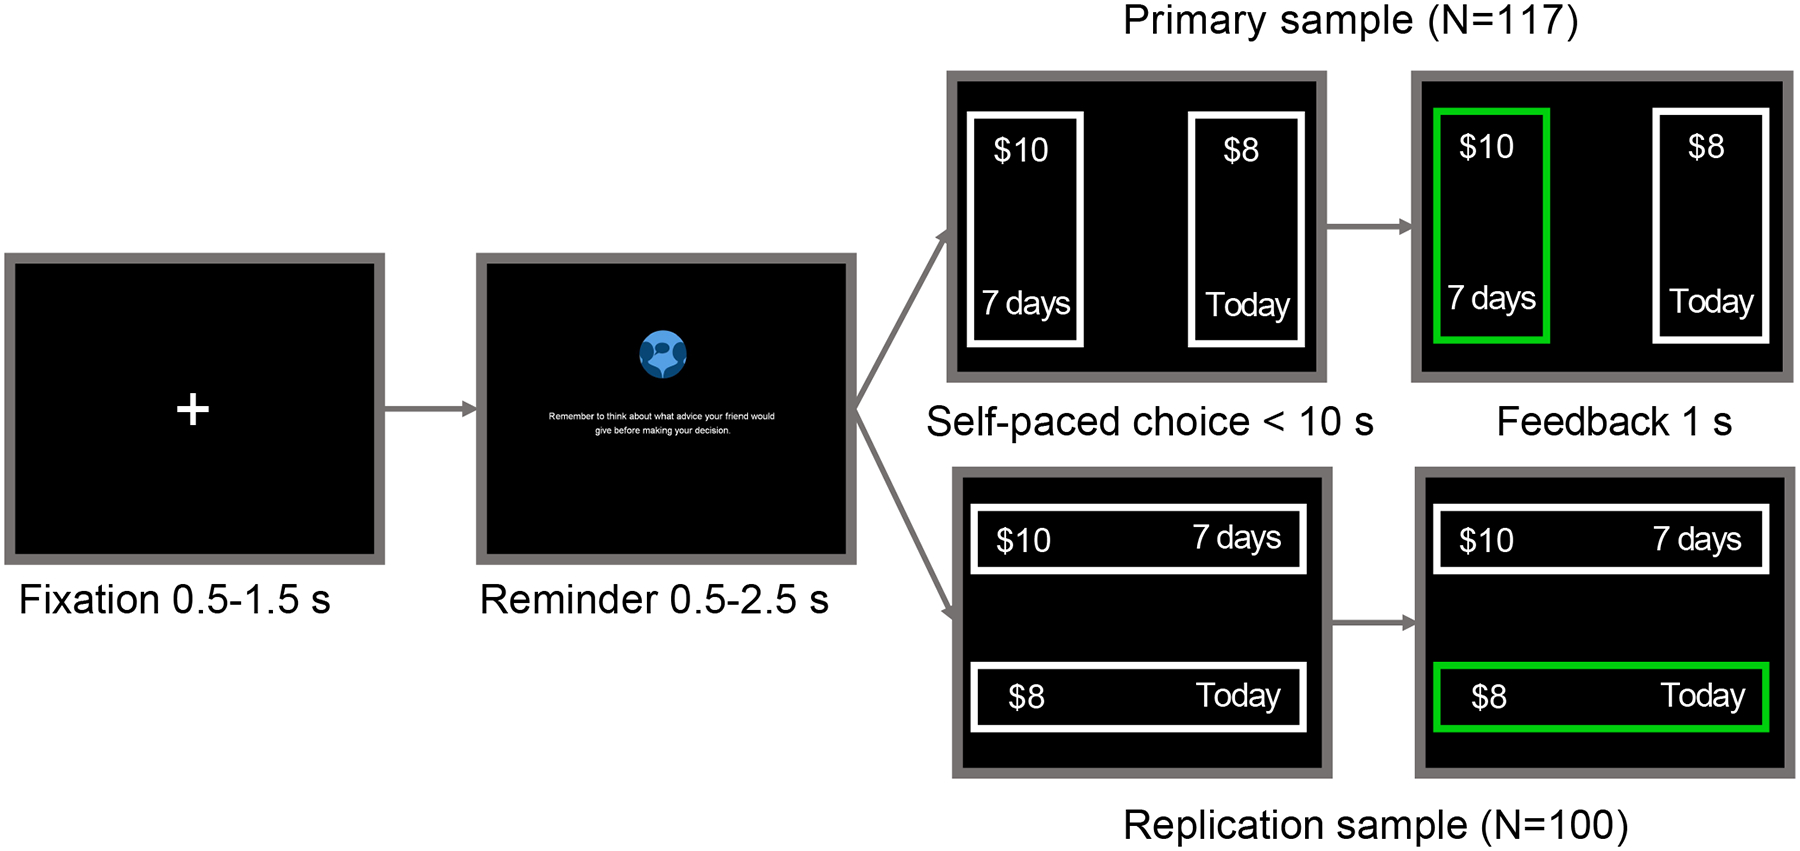
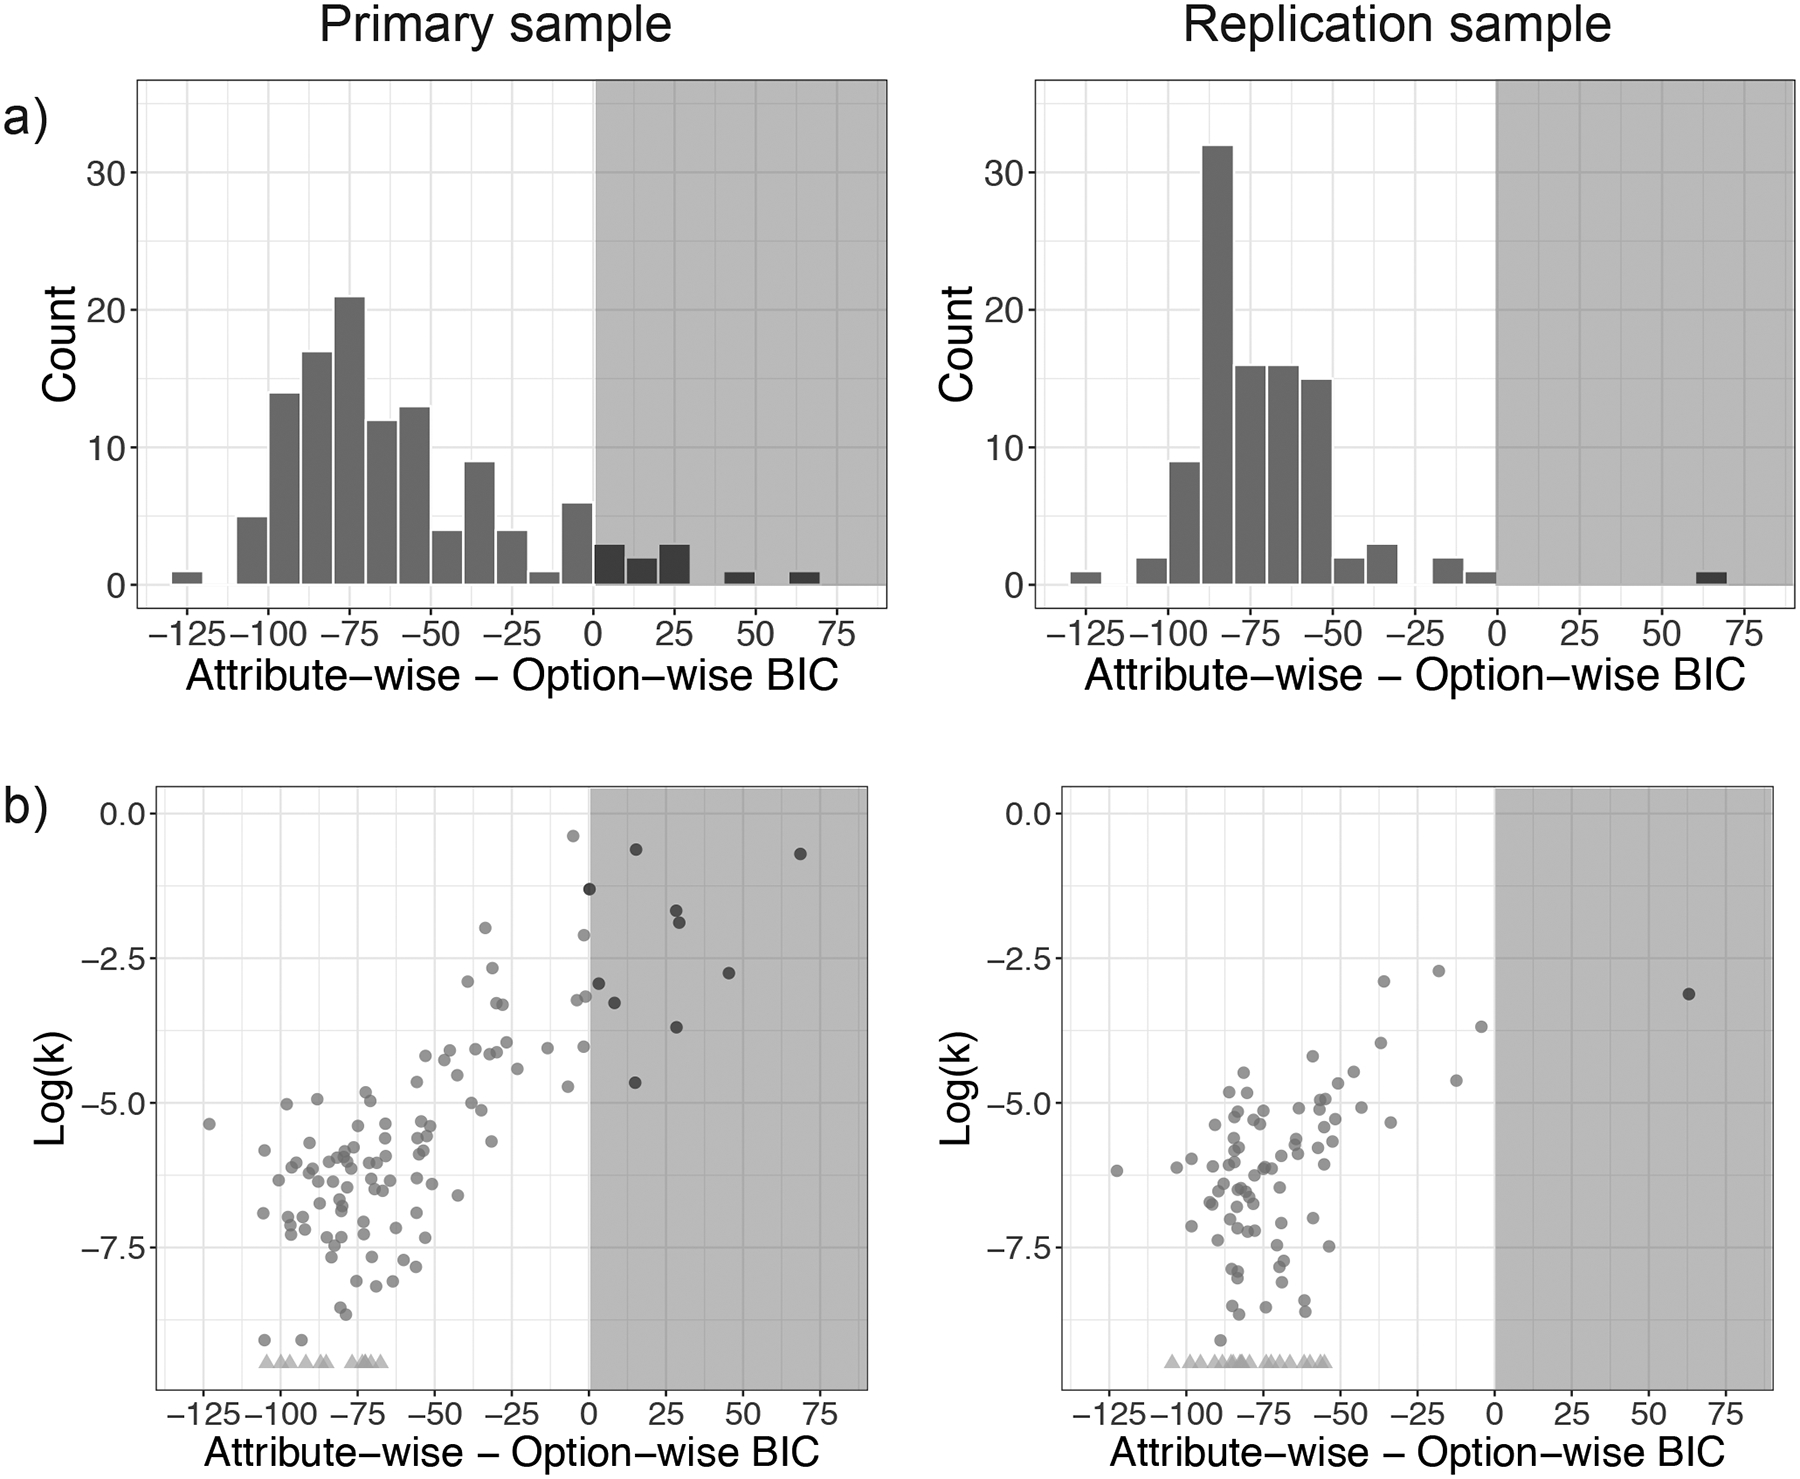
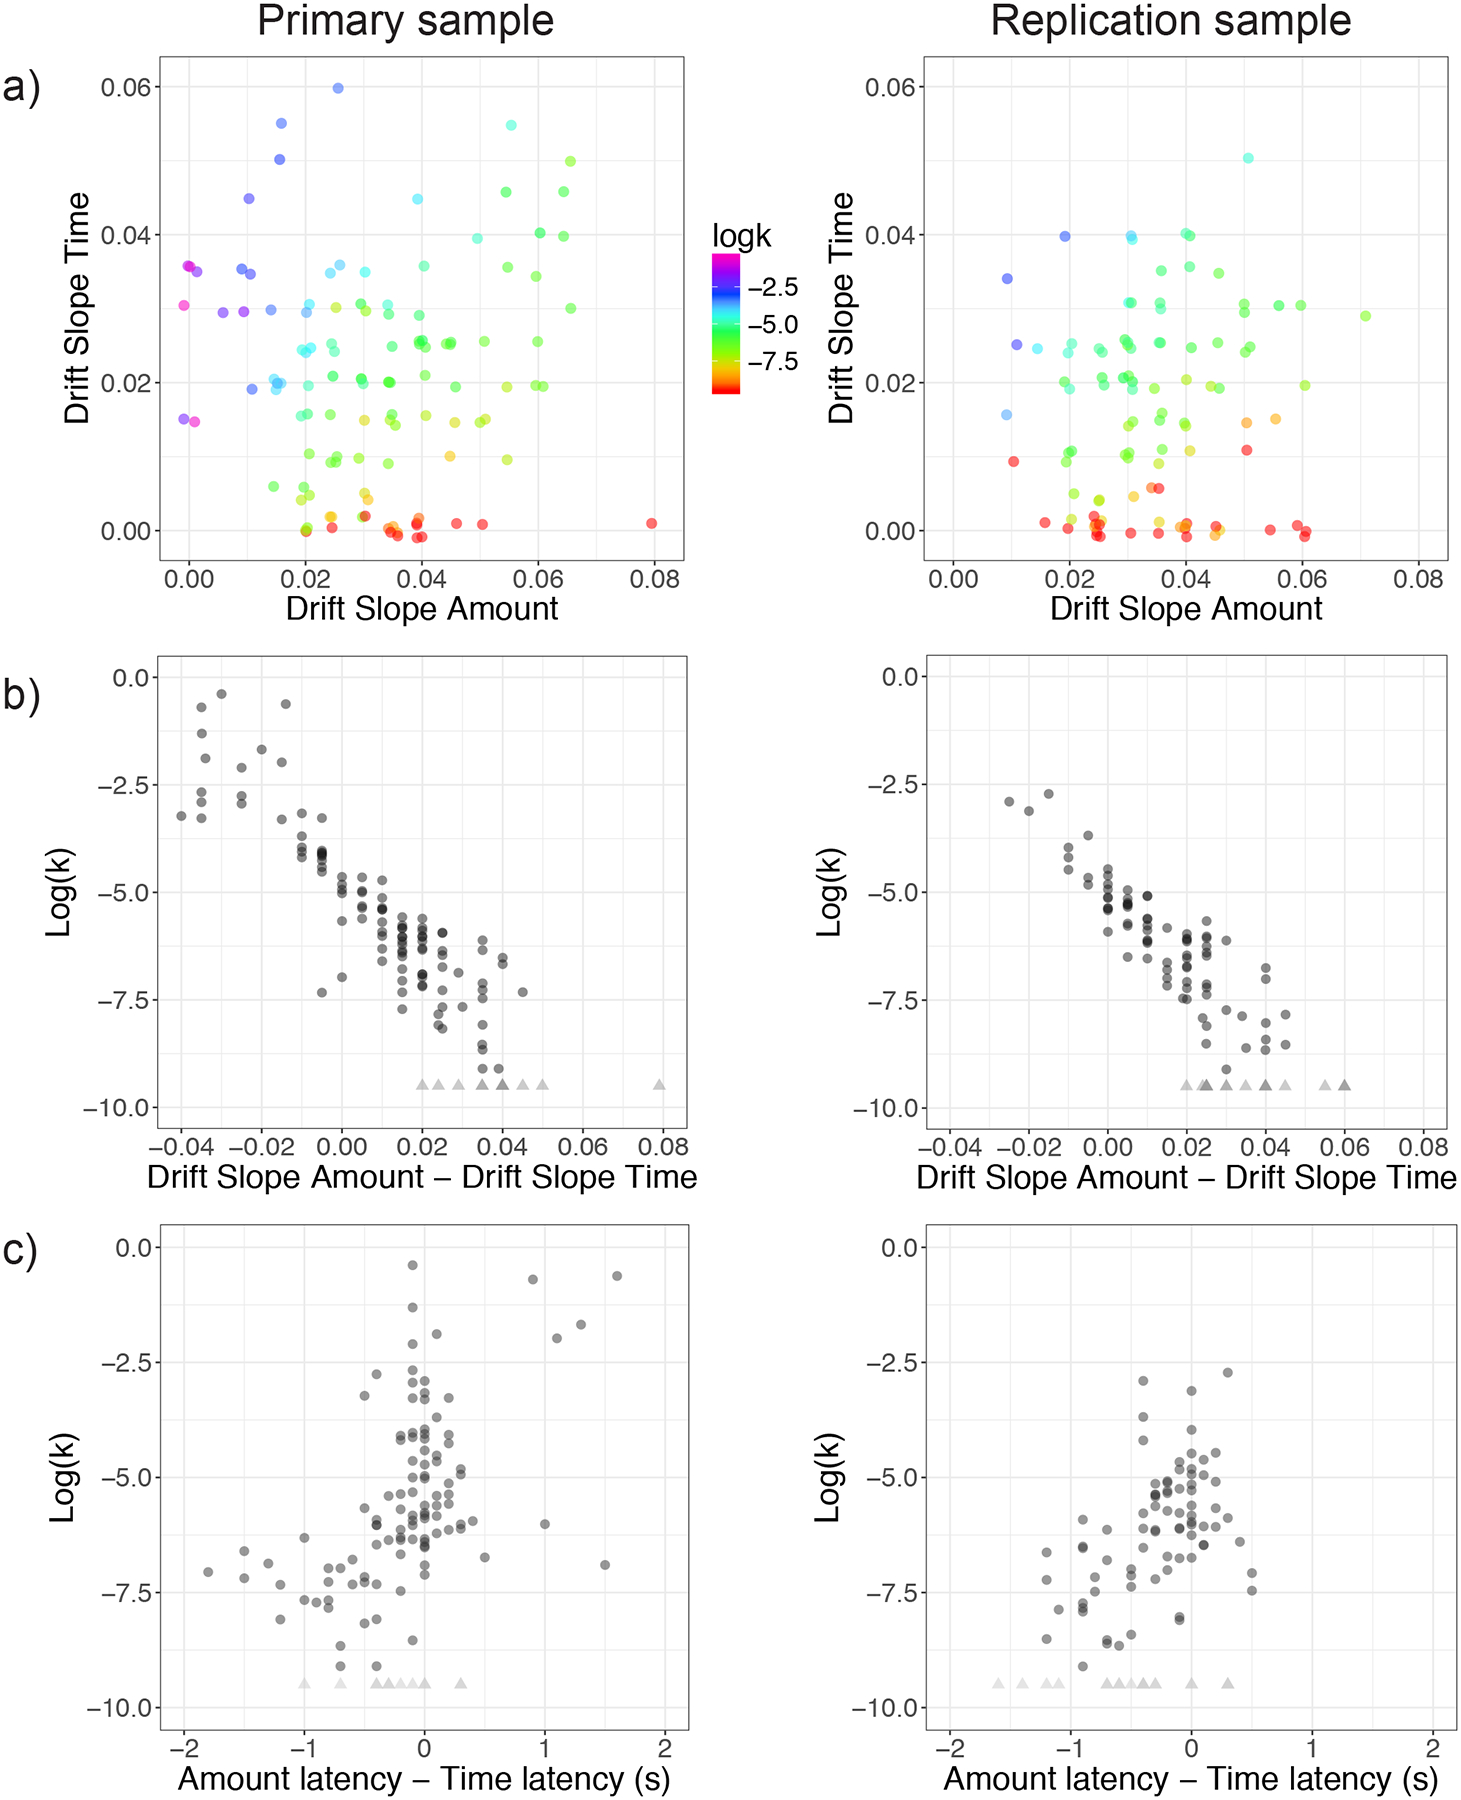
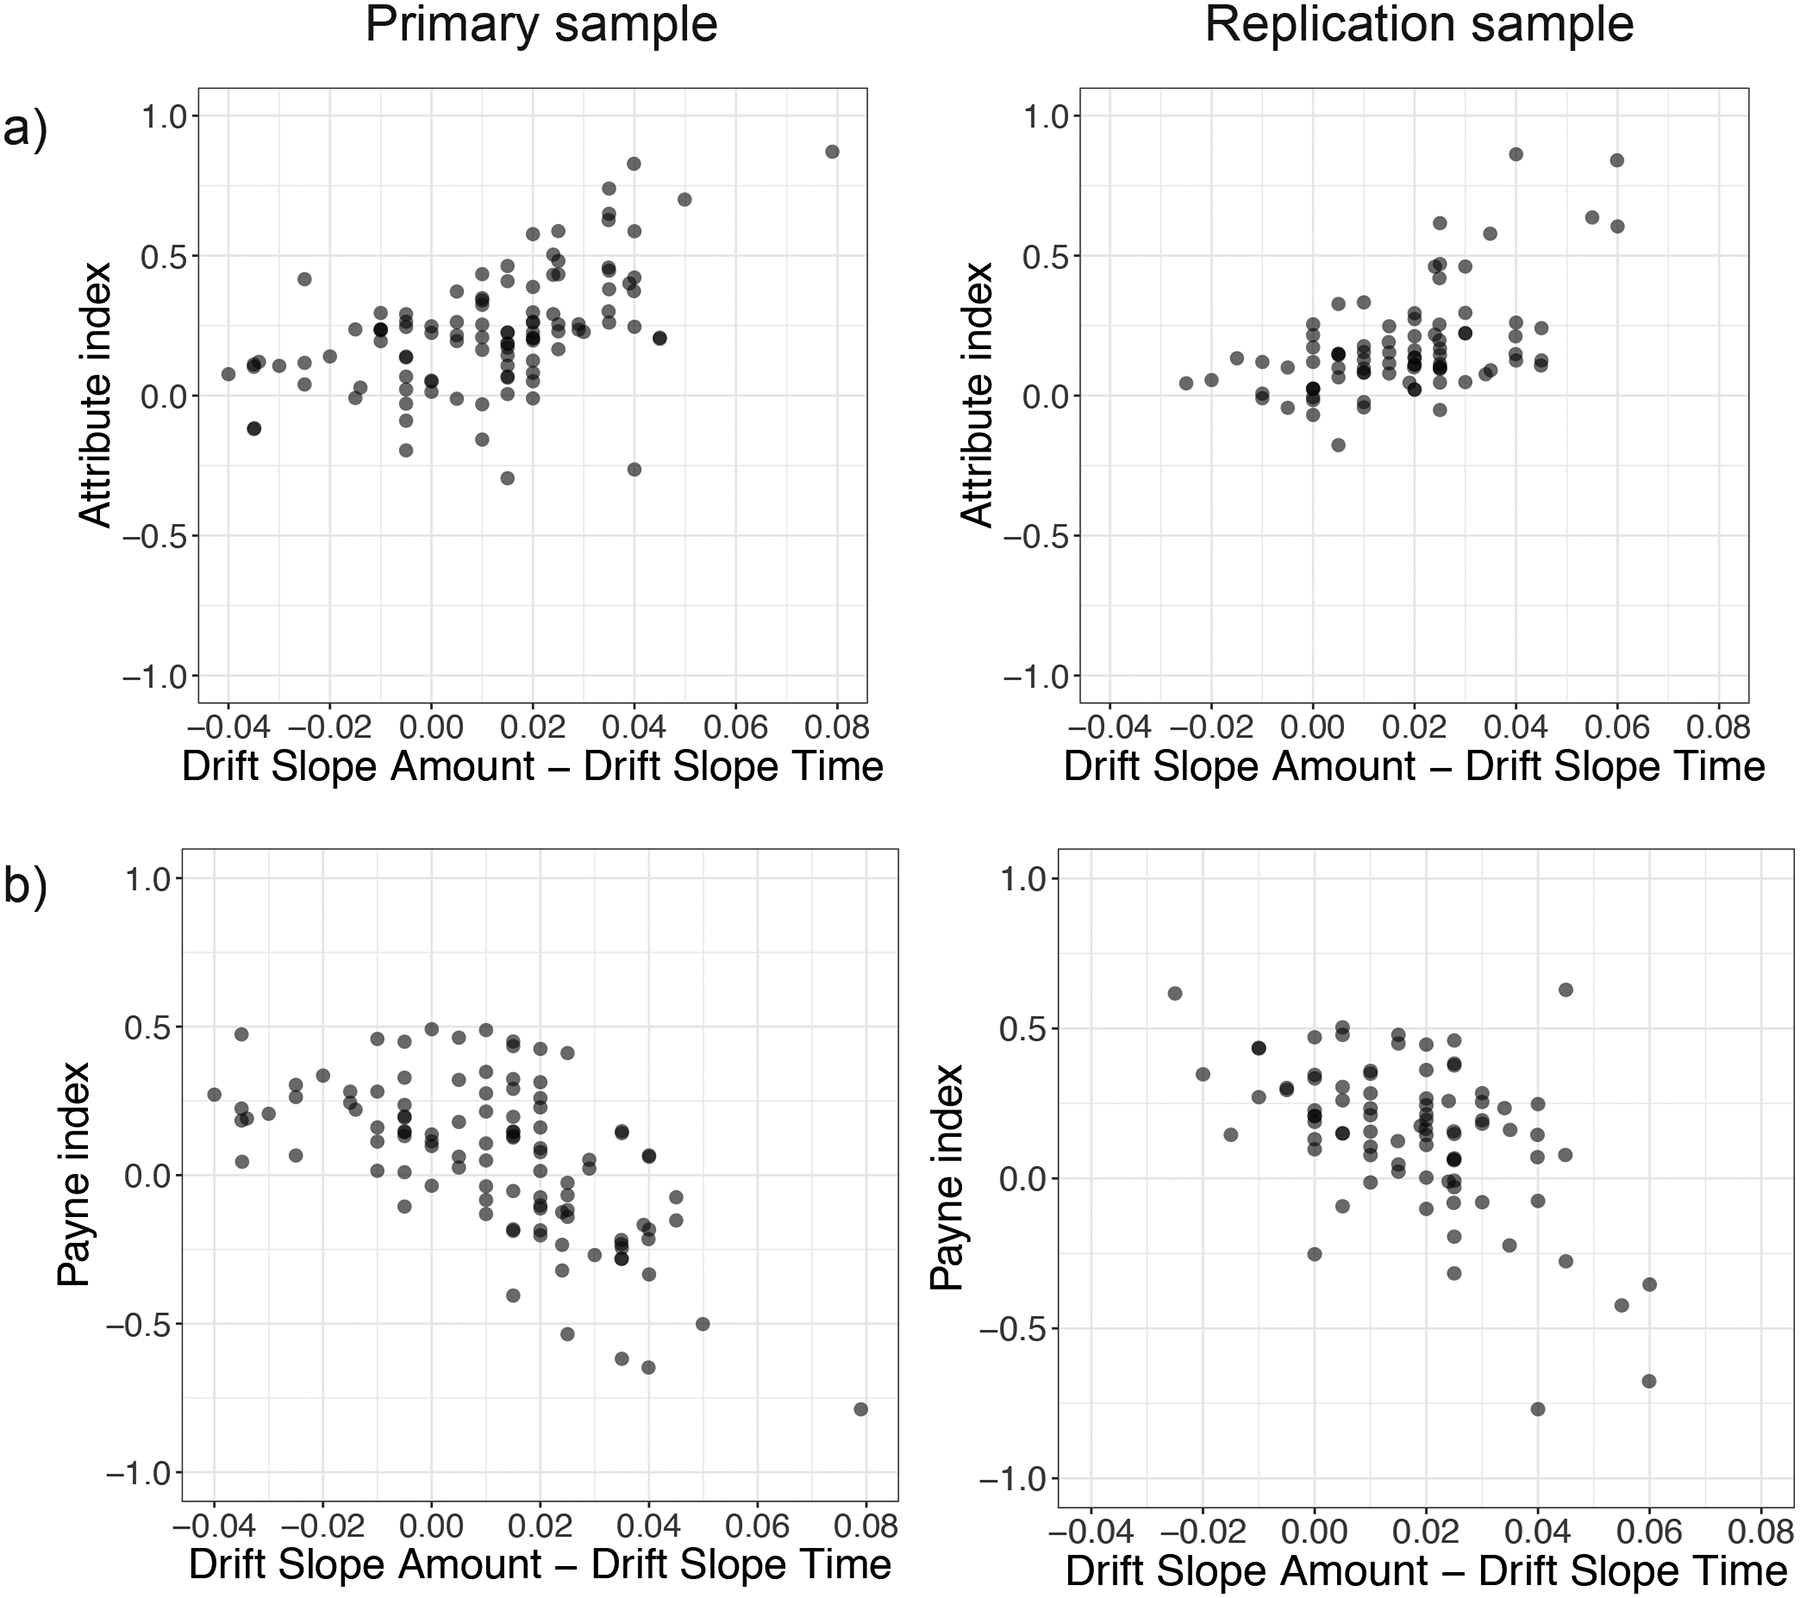
Intertemporal choices involve trade-offs between the value of rewards and the delay before those rewards are experienced. Canonical intertemporal choice models such as hyperbolic discounting assume that reward amount and time until delivery are integrated within each option prior to comparison1,2. An alternative view posits that intertemporal choice reflects attribute-wise processes in which amount and time attributes are compared separately3-6. Here, we use multi-attribute drift diffusion modelling (DDM) to show that attribute-wise comparison represents the choice process better than option-wise comparison for intertemporal choice in a young adult population. We find that, while accumulation rates for amount and time information are uncorrelated, the difference between those rates predicts individual differences in patience. Moreover, patient individuals incorporate amount earlier than time into the decision process. Using eye tracking, we link these modelling results to attention, showing that patience results from a rapid, attribute-wise process that prioritizes amount over time information. Thus, we find converging evidence that distinct evaluation processes for amount and time determine intertemporal financial choices. Because intertemporal decisions in the lab have been linked to failures of patience ranging from insufficient saving to addiction7-13, understanding individual differences in the choice process is important for developing more effective interventions.


Conflict of interest statement

COMPETING INTERESTS: The authors declare no competing interests.

COMPETING FINANCIAL INTERESTS: The authors declare no competing financial interests.

Figures

Figure 1.
Figure 1.
Intertemporal choice task. On every trial, participants saw a fixation cross followed by a reminder to follow the task instructions. Next, they viewed and made a choice between a LL and SS option and received 1s of feedback highlighting the choice made. The positions of the LL and SS options were randomized across trials. The orientation of amount and time information in the primary sample was rotated in the replication sample.
Figure 2.
Figure 2.
Attribute-wise vs. option-wise DDM model comparison using Bayesian Information Criterion (BIC). Shown are data from all participants (primary sample N = 117, replication sample N = 100); note that participants that could not be fit to a single discount rate (primary sample N = 12, replication sample N = 21) were excluded from subsequent statistical testing. a) A histogram of the difference in BIC for each participant across models showing that overall the attribute-wise model fit better. Two-sided exact binomial tests comparing model performance: primary sample: 107/117, p < 0.001 95% CI = 0.85 – 0.96; replication sample 99/100, p < 0.001, 95% CI = 0.95 − 1.0. b) The difference in BIC has a positive correlation with individual discount rate, log(k). Two-sided Pearson’s product-moment correlations primary sample: t(103) = 12.66, p < 0.001, r = 0.78, 95% CI = 0.69 – 0.85; replication sample: t(77) = 5.56, p < 0.001, r = 0.54, 95% CI = 0.36 – 0.68. Participants with all patient choices are displayed in light gray triangles at −9.5 on the y-axis for illustrative purposes. Gray shading indicates values better fit by the option-wise model, whereas no shading indicates values better fit by the attribute-wise model (lower BIC values indicate better fit). Because both models contain the same number of parameters this is a transformation of the difference in negative log likelihood.
Figure 3.
Figure 3.
Patience reflects the difference in drift slopes and latencies for amount and time. Primary sample N = 117, replication sample N = 100, participants not able to be fit to a single discount rate were excluded from analyses involving the discount rate (primary sample N = 12, replication sample N = 21). a) The drift slopes for amount (x-axes) and for time (y-axes) were uncorrelated across participants: Two-sided Pearson’s product-moment correlations: t(115) = 0.24, p = 0.81, r = 0.02, 95% CI = −0.16 – 0.20; replication sample: t(98) = 0.74, p = 0.46, r = 0.07, 95% CI = −0.12 – 0.27. Values are jittered (.001 horizontal and vertical jitter) to reduce over-plotting. The color-map indicates the log(k) value for each participant; note that participants with similar levels of patience had different combinations of drift slopes for the two attributes. b) The difference in drift slopes was related to patience, in both samples: Two-sided Pearson’s product-moment correlations primary sample, t(103) = −19.14, p < 0.001, r = −0.88, 95% CI = −0.92 – −0.83; replication sample t(77) = −16.22, p < 0.001, r = −0.88, 95% CI = −0.92 – −0.82. c) The relative attribute latency for amount and time also relates to patience: Two-sided Pearson’s product-moment correlations primary sample: t(103) = 6.21, p < 0.001, r = 0.52, 95% CI = 0.37 – 0.65; replication sample: t(77) = 4.86, p < 0.001, r = 0.48, 95% CI = 0.29 – 0.64. Participants with all patient choices are displayed in light gray triangles at −9.5 on the y-axis for illustration and were excluded from statistics.
Figure 4.
Figure 4.
Differences in drift slope between amount and time attributes are reflected in measures of attention. Primary sample N = 105, replication sample N = 85 which includes all participants with sufficient eye-tracking data. a) The Attribute Index measures relative looking at amounts (index>0) versus times (index<0). Across participants, a bias toward looking at amounts was associated with a greater drift slope for amount information: two-sided Pearson’s product-moment correlation primary sample: t(103) = 6.35, p < 0.001, r = 0.53, 95% CI = 0.38 – 0.66; replication sample: t(83) = 6.05, p < 0.001, r = 0.55, 95% CI = 0.39 – 0.69. b) The Payne Index measures the relative likelihood of gaze transitions within options (index>0) or between attributes (index<0). Participants who tended to make more attribute-wise transitions also showed a greater drift slope for amount information; two-sided Pearson’s product-moment correlation primary sample: t(103) = −7.60, p < 0.001, r = −0.60, 95% CI = −0.71 – −0.46; replication sample: t(83) = −5.51, p < 0.001, r = −0.52, 95% CI = −0.66 – −0.34.

References

    1. Samuelson PA A Note on Measurement of Utility. Rev. Econ. Stud 4, 155–161 (1937).
    1. Ainslie G Specious reward: a behavioral theory of impulsiveness and impulse control. Psychol. Bull 82, 463–496 (1975). - PubMed
    1. Roelofsma PHMP & Read D Intransitive intertemporal choice. J. Behav. Decis. Mak 13, 161–177 (2000).
    1. Read D, Frederick S & Scholten M DRIFT: an analysis of outcome framing in intertemporal choice. J. Exp. Psychol. Learn. Mem. Cogn 39, 573–88 (2013). - PubMed
    1. Dai J & Busemeyer JR A probabilistic, dynamic, and attribute-wise model of intertemporal choice. J. Exp. Psychol. Gen 143, 1489–1514 (2014). - PMC - PubMed

Publication types