. 2019 May;569(7754):79-84.
doi: 10.1038/s41586-019-1093-7. Epub 2019 Apr 10.

Transposon molecular domestication and the evolution of the RAG recombinase

Affiliations

Transposon molecular domestication and the evolution of the RAG recombinase

Yuhang Zhang et al. Nature. 2019 May.

Abstract

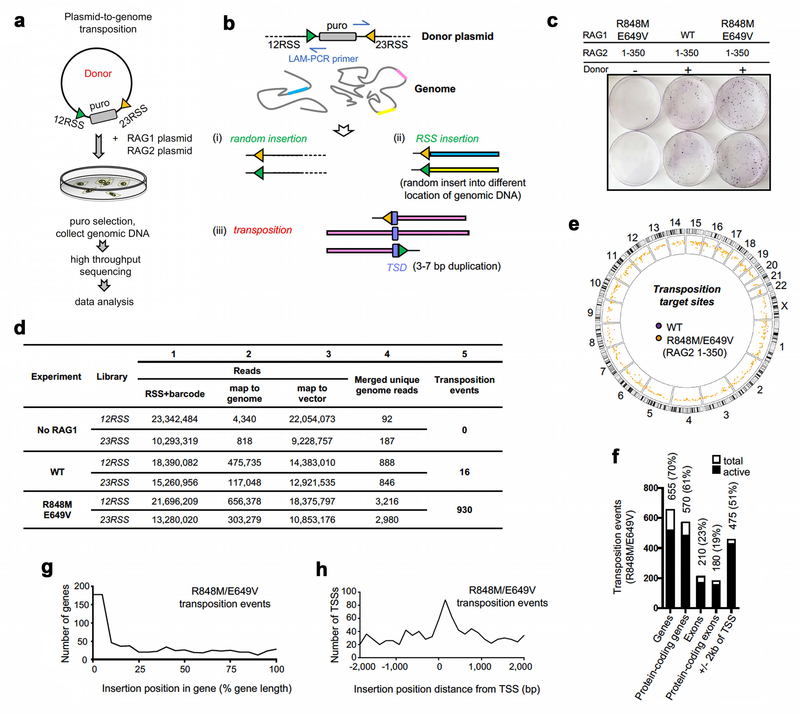
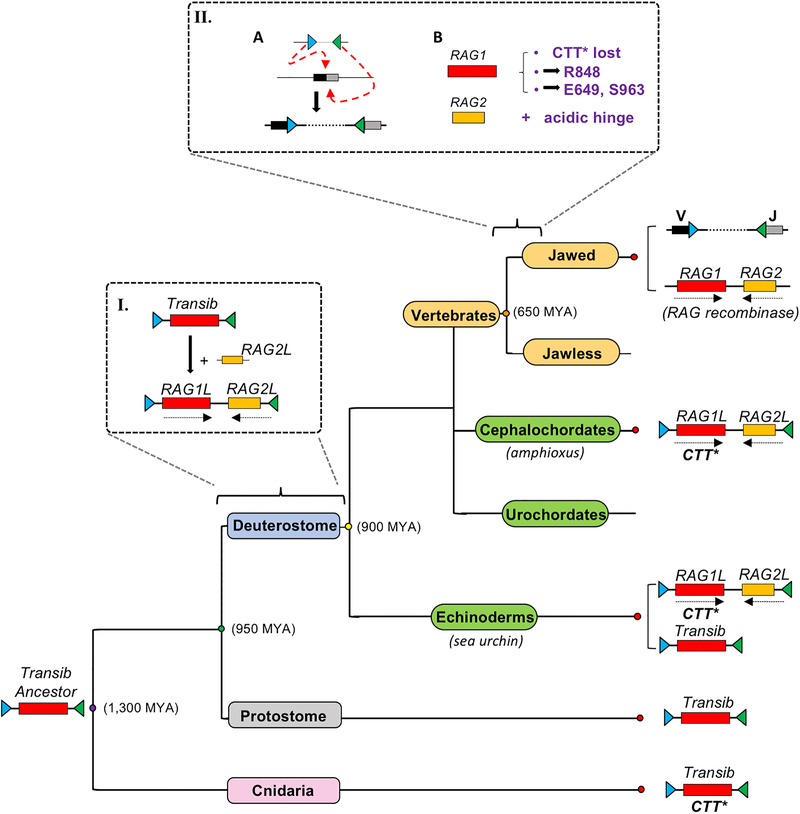
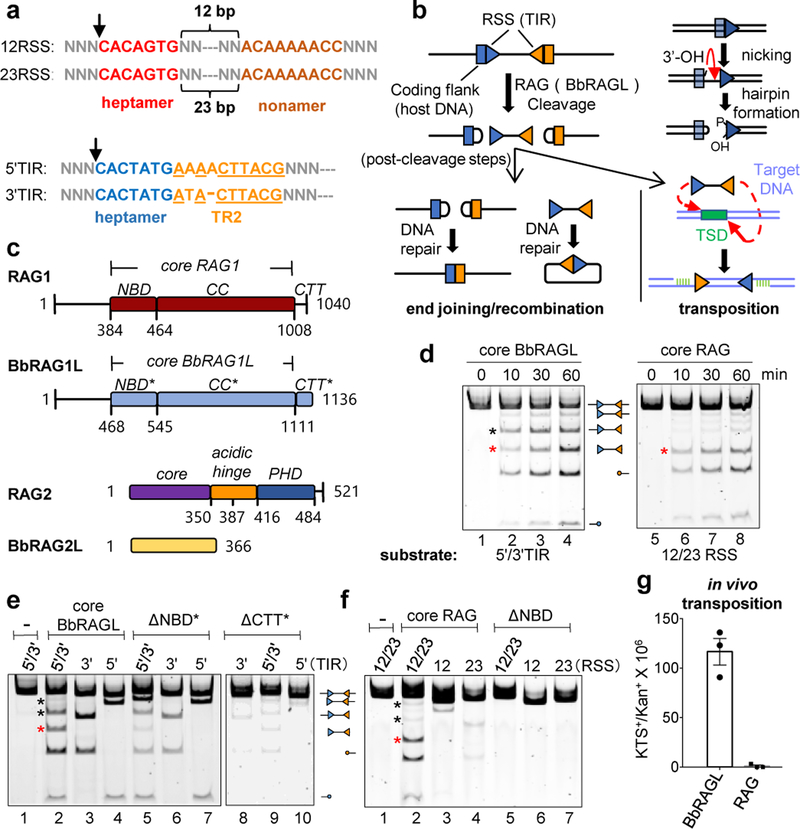
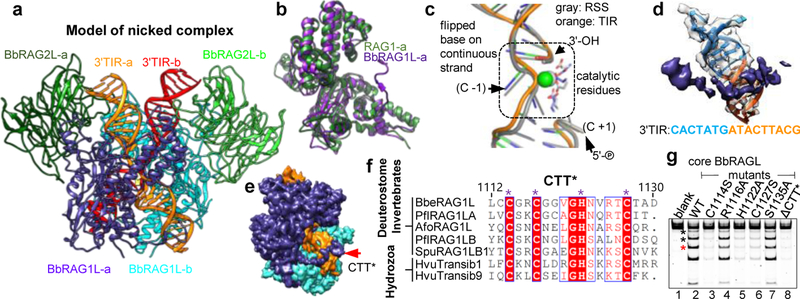
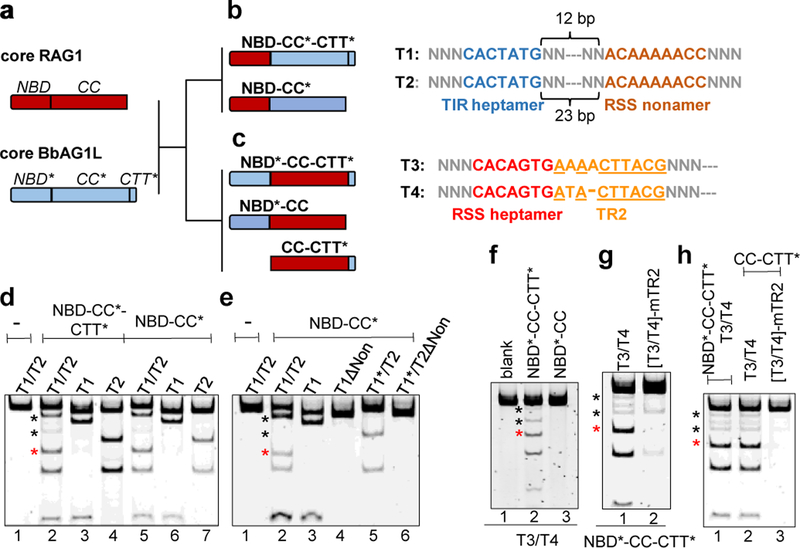
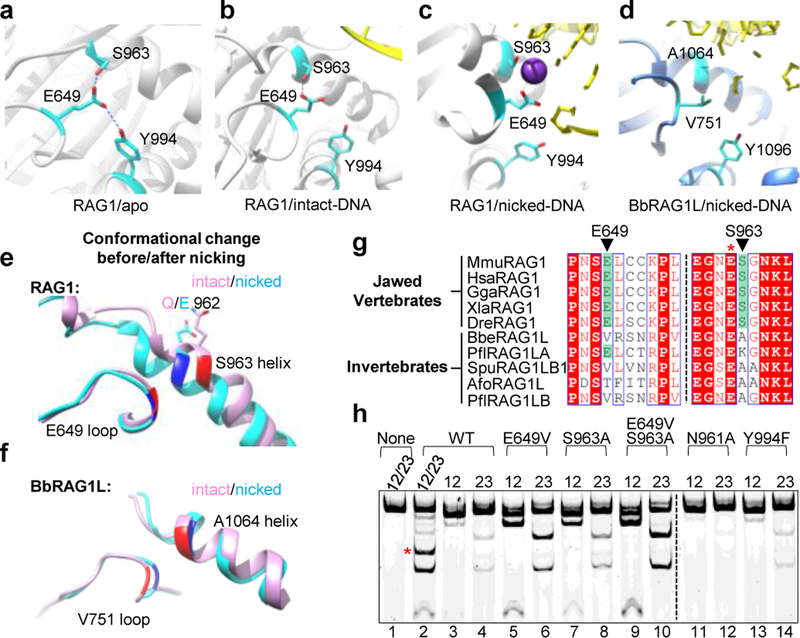
Domestication of a transposon (a DNA sequence that can change its position in a genome) to give rise to the RAG1-RAG2 recombinase (RAG) and V(D)J recombination, which produces the diverse repertoire of antibodies and T cell receptors, was a pivotal event in the evolution of the adaptive immune system of jawed vertebrates. The evolutionary adaptations that transformed the ancestral RAG transposase into a RAG recombinase with appropriately regulated DNA cleavage and transposition activities are not understood. Here, beginning with cryo-electron microscopy structures of the amphioxus ProtoRAG transposase (an evolutionary relative of RAG), we identify amino acid residues and domains the acquisition or loss of which underpins the propensity of RAG for coupled cleavage, its preference for asymmetric DNA substrates and its inability to perform transposition in cells. In particular, we identify two adaptations specific to jawed-vertebrates-arginine 848 in RAG1 and an acidic region in RAG2-that together suppress RAG-mediated transposition more than 1,000-fold. Our findings reveal a two-tiered mechanism for the suppression of RAG-mediated transposition, illuminate the evolution of V(D)J recombination and provide insight into the principles that govern the molecular domestication of transposons.


Conflict of interest statement

The authors declare no competing interests.

Figures

Extended Data Fig. 1.
Extended Data Fig. 1.. ProtoRAG transposon and analysis of the BbRAG1L NBD* domain.
a, Schematic diagram of the ProtoRAG transposon, and below it, the jawed-vertebrate RAG locus and prototypical antigen receptor gene (IGH). b, Schematic diagram of full length and truncated BbRAG1L proteins (top), and cleavage reactions performed with those proteins (plus BbRAG2L) and TIR substrates, as indicated above and below the lanes. Core BbRAG1L (aa 468–1136) retains the cleavage pattern of full length BbRAG1L, while full length BbRAG1L exhibits strong single TIR cleavage (lanes, 6, 7). Closed and open arrowheads, single 5’TIR and single 3’TIR cleavage products, respectively. For gel source data, see Supplementary Figure 1. c, Sequence alignment of BbRAG1L NBD* with RAG1 NBD showing divergent sequences with similar predicted secondary structure elements (alpha helices 1, 2 and 3). d, Size-exclusion chromatography-multiple angle light scattering (SEC-MALS) analysis of the purified NBD* protein, indicating that the protein is a dimer in solution.
Extended Data Fig. 2.
Extended Data Fig. 2.. Biochemical properties and cryo-EM structure of cBbRAGL-3’TIR synaptic complexes.
a, SEC-MALS of MBP-cBbRAGL, indicating that the complex is a heterotetramer with two subunits each of cBbRAG1L and BbRAG2L. b, c, SEC profiles of cBbRAGL incubated with intact (b) or nicked (c) 3’TIR, 5’TIR or 3’/5’TIRs showing resolution of protein-DNA complex from free DNA. Gels display the components of pooled column fractions containing the protein-DNA complex. d, Representative 2D class averages of cryo-EM particles of cBbRAGL bound to intact or nicked 3’TIRs. e, (Left) Fourier shell correlation (FSC) curves of the half maps from gold standard refinements of cBbRAGL-nicked 3’TIR complex with no symmetry applied (blue), cBbRAGL-intact 3’TIR complex with no symmetry applied (red), and with C2 symmetry applied (green). (Right) FSC curves of the gold standard refinement of cBbRAGL-nicked 3’TIR complex with C2 symmetry applied (blue) and of the C2 symmetrized map and model (green). Resolution of the maps are read by the cutoff values at FSC = 0.143. f, Color coded local resolution estimation of the C2 symmetrized map of cBbRAGL in complex with nicked 3’TIR, viewed from a perspective similar (with a 30 degree rotation) to that of (g). Resolution is in general better for cBbRAG1L than for BbRAG2L. g, h, Cryo-EM maps of cBbRAGL bound to intact 3’TIRs (5.3 Å overall resolution) (g) or nicked 3’TIRs (5.0 Å overall resolution) (h). One BbRAG1L subunit (gray) has been rendered partially transparent to allow visualization of DNAs inside the protein. Continuous DNA density running through the protein core is visible with nicked but not intact TIRs, arguing that the DNA in the vicinity of the active site becomes more rigidly constrained upon nicking. This is notable in light of the recent finding that DNA in the RAG active site melts and swivels in preparation for nicking. Clear differences between the two DNAs are visible in the bottom half of the structures, with 3’TIR-a (orange) protruding below the protein and density for 3’TIR-b (red) dissipating before the DNA emerges from the protein core. This argues that the two identical DNA molecules are engaged differently by cBbRAGL, with one (3’TIR-b) less rigidly constrained by its interactions with protein.
Extended Data Fig. 3.
Extended Data Fig. 3.. Structural features of cBbRAGL
a, Comparison of the models of cBbRAGL and cRAG (PDB 5ZDZ) bound to nicked DNA but with DNA removed, illustrating the absence of NBD* from the cBbRAGL structure. NBD is a dimer that can pivot on a flexible hinge to accommodate the different spacer lengths of a 12RSS and 23RSS, providing a structural explanation for the 12/23 rule–,. We speculate that NBD*, HMGB1, and distal TIR sequences constitute a flexible domain located below the main complex, by analogy with RAG-RSS complexes. b, Superimposition of cBbRAGL-nicked-3’TIR synaptic complex with RAG-nicked RSS synaptic complex (PDB 5ZDZ). c, BbRAG2L adopts a doughnut-shaped structure consistent with that of a 6-bladed β-propeller. Because of low resolution, some elements cannot be unambiguously modeled as β-strands. Putative β-propellers I-VI are labeled, as are the N- and C-termini of the protein, showing that, as with RAG2, propeller I is composed of both N- and C-terminal sequences. d, Color coded linear diagram of cBbRAG1L subdomains (top) and cartoon of the BbRAG1L dimer (bottom) with the subdomains of one subunit color coded as in the linear diagram. The other subunit is gray except for the preR subdomain. Stars indicate a gap in the BbRAG1L model spanning aa 603–630. Nomenclature and figure layout as in. DDBD, dimerization and DNA binding domain; PreR, pre-RNase H domain; RNH, RNase H domain; ZnC2 and ZnH2, domains that contribute two cysteines and two histidines, respectively, for zinc coordination; CTD, C-terminal domain; CTT*, C-terminal tail. e, Superimposition of cryo-EM map on the model of the nicked 3’TIR in the vicinity the flipped bases near the site of nicking. f, g, 3D classes of cryo-EM maps of cBbRAGL bound to intact (f) or nicked (g) 3’TIRs (DNA omitted). One class is enlarged and shown from two vantage points below. The arrow points to the cleft that narrows in the open-to-closed transition. With intact DNA, three distinct 3D classes are distinguishable that vary in the degree of closure of the two arms of the V. h, Superimposition of three forms of cBbRAGL illustrating the movement of a 3’TIR and BbRAG2L subunit (color coded as in e, f) that takes place during the open-to-closed transition. One cBbRAG1L/2L dimer has been aligned and movement is visualized in the other dimer.
Extended Data Fig. 4.
Extended Data Fig. 4.. Protein-DNA interactions in the cBbRAGL-nicked 3’TIR synaptic complex.
a, Schematic diagram of the detailed interactions between BbRAG1L and nicked 3’TIR DNA. Bold/underlined text, main chain interactions; regular text, side chain interactions; purple text, interactions involving BbRAG1L subunit a (defined as the subunit whose active site engages the TIR depicted); blue text, interactions involving symmetric BbRAG1L subunit b. BbRAG2L-DNA interactions could not be unambiguously assigned and are not depicted. b, c, Orthogonal views of the nicked 3’TIR-BbRAG1L subunit a interaction (b) and the nicked RSS-RAG1 subunit a interaction (c). Protein electrostatic surface potential is indicated with blue (positive charge) and red (negative charge) using the scale (KT/e) below panels d, e. d, BbRAG1L subunit b-nicked 3’TIR interaction. e, RAG1 subunit b-nicked RSS interaction.
Extended Data Fig. 5.
Extended Data Fig. 5.. CTT, CTT*, and mutational analysis of ProtoRAG TIRs.
a, Superimposition showing CTT* extending from a structurally conserved region at the C-terminus of the catalytic core regions of mouse RAG1 (mRAG1) , zebra fish RAG1 (zRAG1), and BbRAG1L. b, Sequence alignment of CTT from six vertebrate RAG1 proteins. Species name abbreviations used in this paper: Mmu, mus musculus (mouse); Hsa, homo sapien (man); Gag, Gallus gallus (chicken); Xla, Xenopus tropicalis (frog); Dre, Danio rerio (zebrafish); Bb, Branchiostoma belcheri (amphioxus); Pfl, Ptychodera flava (acorn worm); Spu, Strongylocentrotus purpuratus (purple sea urchin); Afo, Asterias forbesi (sea star); Etr, Eucidaris tribuloides (pencil urchin); Aga, Anopheles gambiae (mosquito); Aae, Aedes aegypti (mosquito); Dps, Drosophila pseudoobscura (fruit fly); Hze, Helicoverpa zea (corn earworm); Hvu, Hydra vulgaris (hydra). c, Schematic indicating sub-regions of TIRs. Region 1 contains the heptamer and one additional bp, which in Fig. 1a and throughout the paper is defined as part of TR2. Otherwise, region 2 (broken up into 2a and 2b for the 5’ TIR) corresponds to TR2. Poorly conserved regions 3 and 4 separate TR2 from a distal conserved 9 bp element (region 5). d-g, Cleavage of substrates containing a single 5’TIR (d, e) or a single 3’TIR (f, g), either intact (WT) or with the indicated region scrambled, by cBbRAGL (d, f) or the ΔNBD* cBbRAGL complex (e, g). Closed and open arrowheads, 5’TIR and 3’TIR cleavage products, respectively. Region 5 is completely dispensable for cleavage and regions 3 and 4 contribute modestly to 3’TIR but not 5’TIR cleavage. Upon deletion of NBD* from cBbRAG1L, 3’TIR cleavage loses all dependency on regions 3 and 4, consistent with the possibility that NBD* engages in functionally important interactions with regions 3 and 4 of the 3’TIR.
Extended Data Fig. 6.
Extended Data Fig. 6.. Activities of chimeric RAG1-BbRAG1L proteins and residues that influence coupled cleavage.
a, b, Cleavage by NBD-CC* is dependent on the length of the spacer between the TIR heptamer and the RSS nonamer. Substrates depicted schematically above the gel images. In (a), the substrates contain a single target based on T1 (Fig. 3b) whose spacer ranges in length from 10–14 bp. In (b), the substrate contains target T1 and a partner target based on T2 (Fig. 3b) whose spacer ranges in length from 20–25 bp. Dark arrowheads, T1 cleavage products; open arrowheads, T2 cleavage products. c, d, Cleavage reactions using the NBD*-CC-CTT* and CC-CTT* proteins and T3 and T4 substrates (all depicted schematically in Fig. 3c), as indicated above the lanes. T3* and T4*, T3 and T4 targets with a C-to-A mutation of heptamer position 1 which renders the target uncleavable; [T4/T4]H+TR2 and [T3/T3]H+TR2, substrates in which both targets have had all substrate sequences except the heptamer and TR2 deleted. Asterisks as in Fig. 2g. e, Cartoon depicting differences in the major protein-DNA interactions of BbRAGL and RAG. f, Superposition of RAG1 and BbRAG1L in the region containing E649 and S963 in complexes bound to nicked DNA substrates illustrating the similarity of positioning of the active site residues E962 and E1063 and flanking residues N961 and N1062. h, RAG1 N961 and BbRAG1L N1062 have the potential to participate in hydrogen bond networks after nicking and could thereby stabilize the hairpin-competent configuration of the enzyme. This is notable in light of the fact that N961A mutant RAG1 displays enhanced coupled cleavage compared to WT RAG1. i, Cleavage reactions using WT and mutant cBbRAG1L proteins (with BbRAG2L) and substrates containing one or two TIRs as indicated above and below the lanes (left). V751E cBbRAG1L, but not A1064S, reduces uncoupled single 3’TIR cleavage (lower black asterisk, lane 2; reduction also seen in lane 8) and single 5’TIR cleavage (seen most clearly in lane 5). The strong reduction in cleavage seen with the V751E/A1064S BbRAG1L double mutant suggests the possibility that hydrogen bonding between these two residues holds the active site in an inactive configuration. At right: quantitation of uncoupled cleavage as the ratio of the intensity of the 3’TIR single cleavage band (lower black asterisk) to that of the double cleavage band (red asterisk) as in lanes 1–3. Mean ± SEM. Two-tailed t-test: **, p<0.01, compared to WT cBbRAG1L.
Extended Data Fig. 7.
Extended Data Fig. 7.. In vitro transposition by WT and mutant RAG proteins.
a, Schematic of intramolecular transposition. If the 3’ OH nucleophiles attack the same strand as they are located on, the products are two deletion circles (top), but if they attack the opposite strands, a single inversion circle product is generated (bottom). Staggered attack on the target DNA backbone yields single stranded gaps in the products, represented as five short vertical lines. b, Inverse PCR reaction to amplify inversion circles from purified intramolecular transposition product as in Fig. 5d, third lane. The band indicated with an arrow was excised, cloned, and sequenced, yielding sites at which intramolecular transposition occurred to yield inversion circles, indicated in the map of the excised 12/23RSS central fragment (below). Half arrows indicate approximate location of PCR primers. The location of deletion circle joints detected by sequencing are not indicated. c, Schematic of intermolecular in vitro transposition assay. An RSS-flanked Tet gene is mobilized from a linear donor by RAG-mediated DNA cleavage and can transpose into a target plasmid, which is detected after bacterial transformation by the appearance of colonies on Kan/Tet/Str (KTS) plates (Streptomycin (Str) is not relevant in this assay). d, In vitro DNA cleavage and intramolecular transposition by position 848-mutant cRAG1 (with RAG2 1–383). Increased transposition compared to WT cRAG1 is revealed by diminished intensity of the double cleavage band and increased intensity of the slow-migrating intramolecular inversion circle transposition product band (red arrow). Note, however, that the intensity of the inversion circle band underestimates the efficiency of transposition because deletion circle transposition products, which are of heterogeneous size and hence not visible as a discrete band, are also produced. e, Quantitation of intramolecular transposition efficiency from three independent experiments as in (d), measured by ratio of double cleavage band to 23RSS cleavage band (the latter serving as an internal control for the total amount of cleavage). The ratio decreases as intramolecular transposition increases in efficiency, consuming the double cleavage band. Mean, with data range indicated by box. Two tailed t-test; p-values are indicated. f, Distribution of transposition target site duplication lengths determined by sequencing of plasmid transposition products or from high-throughput sequencing of plasmid-to-genome transposition products (Extended Data Fig. 9d), as indicated above the bars. The RAG1 protein used is indicated below the bars. In vitro reactions as in Fig. 5e using RAG2 1–383; in vivo plasmid target reactions as in Fig. 5g using RAG2 1–350; genome transposition products generated using RAG2 1–350. In a small fraction of plasmids, sequencing revealed deletions at the site of insertion of the RSSs (red; deletion). g, In vitro cleavage and intramolecular transposition reactions using RAG2 1–352 and RAG2 1–383 (as indicated above the lanes) and WT or mutant cRAG1 (as indicated below the lanes). Transposition is readily detected with both forms of RAG2 and is increased by the RAG1 R848M mutation. h, In vitro intermolecular transposition assays using RAG2 1–383 and RAG2 1–352 and WT or mutant cRAG1 (as indicated below the lanes). Deleting the RAG2 acidic hinge does not increase the efficiency of intermolecular transposition in vitro.
Extended Data Fig. 8.
Extended Data Fig. 8.. In vivo transposition by RAG and BbRAGL proteins.
a, Schematic of plasmid-to-plasmid in vivo transposition assay. An RSS-flanked Tet gene is mobilized from a donor plasmid by RAG-mediated DNA cleavage and can transpose into a target plasmid, which is detected after bacterial transformation by the appearance of colonies on Kan/Tet/Str (KTS) plates (Streptomycin (Str) reduces background in the assay by selecting against bacteria harboring the rpsL gene, present in the donor plasmid). b, Schematic of in vivo GFP fluorescence recombination assay, used to generate data of panels (c) (right), (e) (right) and (g). Excision of the polyadenylation sequence (Poly-A) together with its flanking RSSs or TIRs (triangles) by RAG or BbRAGL and resealing of the plasmid allows for expression of GFP. c, In vivo transposition (left) and recombination (right) activity in HEK293T cells of WT and M949R BbRAG1L (together with BbRAG2L). Mean ± SEM. Two-tailed t-test: ***, p<0.005, compared to WT BbRAG1L. d, In vivo transposition activity assayed in human colon cancer cell line HCT116 with full length RAG1 R848M/E649V and either RAG2 1–350 or 1–383. As in HEK293T cells, transposition is strongly inhibited by the RAG2 acidic hinge. Mean ± SEM. e, In vivo transposition (left) and recombination (right) activity in HEK293T cells of WT and R851M human RAG1 together with different forms of human RAG2, beginning at amino acid 1 and ending with the amino acid indicated below the bars. Mean ± SEM. Two-tailed t-test: ***, p<0.005; ****, p<0.001 compared to WT human RAG1. f, g, Protein expression (f) and recombination activity (g) in HEK293T cells of WT and mutant mouse RAG1 and RAG2 proteins used in the in vivo transposition assays in this study. The data demonstrate that the large increases in transposition activity observed with some proteins (e.g., RAG2 1–350 and 1–352, and RAG1 R848M) are not due to large increases in protein expression or cleavage/recombination activity. h, i, In vivo transposition activity assayed in HEK293T cells with full length RAG1 R848M (h) or R848M/E649V (i) and various forms of RAG2, beginning at amino acid 1 and ending with the amino acid indicated below the bars. FL, full length RAG2.
Extended Data Fig. 9.
Extended Data Fig. 9.. Transposition into the human genome by mutant RAG proteins.
a, Schematic of plasmid-to-genome in vivo transposition assay. An RSS-flanked Puro expression cassette is mobilized from a plasmid donor by RAG-mediated DNA cleavage and can transpose into the genome, which is detected by selection with puromycin and high-throughput sequencing. b, Schematic illustrating detection of bone fide transposition events into the genome by LAM-PCR and high-throughput sequencing. LAM-PCR is performed on genomic DNA with biotinylated primers (half arrows) that extend into the DNA flanking either the 12RSS or 23RSS; thereafter, independent libraries are prepared and sequenced for the 12RSS and 23RSS flanks. If the donor plasmid randomly inserts into the genome (i), then the RSS is flanked by donor plasmid sequences. If the RSS fragment is cleaved at one or both RSSs and randomly inserted into genome (ii), then a match with an appropriate sequence duplication (indicative of a TSD) will not be found between the 12RSS and 23RSS libraries. Finally, if the RSS fragment is inserted into the genome by transposition (iii), a match with a 3–7 bp TSD will be found in the 12RSS and 23RSS libraries. c, Tissue culture plates stained with crystal violet showing puromycin-resistant colonies for experiments using RAG2 1–350 and either WT or R848M/E649V RAG1. Colony numbers increase about two-fold with the mutant RAG1 protein but many colonies are seen with WT RAG1 due to random integration of the donor plasmid. Essentially no colonies are seen if the donor plasmid is omitted (first column of plates) d, Summary of sequence data obtained from the plasmid-to-genome transposition experiments. For each of the six libraries, column 1 shows the total number of reads with a barcode and RSS, columns 2 and 3 show a breakdown of number of reads in which RSS flanking sequences map to the human genome or the donor plasmid (a small fraction of reads do map to either genome or plasmid due to poor read quality), column 4 shows the number of unique reads that map to the genome (after elimination of duplicates), and column 5 shows the number of bone fide transposition events detected. e, Rainfall circos plot of transposition events into chromosomes of HEK293T cells. f-h, Genome features of transposon integration sites mediated by R848M/E649V RAG1 and RAG2 1–350. f, Number (percent) of transposition events into the genome features indicated. TSS, transcription start site. One-tailed Fisher’s exact test was used to determine whether the frequency of transposition events was greater than that expected by chance: genes (p=9e-30); protein coding genes (p=5e-35); exons (p=6e-86); protein coding exons (p=4e-82) and within 2 kb of a TSSs (p=5e-180). g, h, Meta-analysis of integration sites within gene bodies (g) and flanking TSSs (h).
Extended Data Fig. 10.
Extended Data Fig. 10.. Model for RAG evolution in metazoans.
Steps leading from the ancestral Transib transposon, consisting of a RAG1-like open reading frame flanked by RSS-like TIRs, to the RAG recombinase and “split” antigen receptor genes of jawed vertebrates. Box I. Capture of a RAG2-like open reading frame by a Transib transposon to generate the ancestral RAG transposon in an early deuterostome. Box II. Key events in the evolution of RAG1/RAG2 and antigen receptor genes of jawed vertebrates: (A) Insertion of the RAG transposon into the exon of a gene encoding an immunoglobulin-domain receptor protein to generate the ancestral antigen receptor gene and (B) Loss of CTT* and acquisition of E649 and S963 by RAG1 facilitated evolution of the 12/23 rule and coupled cleavage, respectively, while acquisition of RAG1 R848 and the RAG2 acidic hinge powerfully suppressed RAG transposition activity. The order of events depicted in box II is not known. RAG-related elements, if found in members of a given lineage, are indicated at right, as is the presence of the CTT* domain. Protostome lineages have been collapsed into a single branch. While vertical transmission is consistent with the distribution of RAG1/RAG2 transposon/recombinase elements in deuterostomes, horizontal transmission might have contributed to the spread of Transib elements.
Fig. 1 ∣
Fig. 1 ∣. Uncoupled DNA cleavage by BbRAGL
a, RSS and TIR substrates. Underlining indicates sequence identity in TR2 and arrows the site of cleavage. The TIR heptamer sequence can be found in endogenous human RSS sequences. b, Schematic of DNA cleavage, recombination, and transposition by RAG/BbRAGL. Inset, Nick-hairpin mechanism of DNA cleavage. Triangle indicates an RSS or TIR in this and other figures (wide side of triangle is the heptamer end). c, Domain diagrams of the RAG and BbRAGL proteins. CC, catalytic core; NBD, nonamer binding domain; CTT, C-terminal tail; PHD, plant homeodomain finger. Numbers indicate amino acid domain boundaries (mouse RAG is depicted and used in all experiments except where indicated). NBD* is named for consistency and not to imply function. d, Time course of DNA cleavage by cRAG and cBbRAGL with substrates containing a pair of TIRs or RSSs. Red asterisk, double cleavage band; black asterisk, single 3’TIR cleavage band. Cleavage products were resolved on acrylamide gels and are indicated schematically (circles indicating hairpin ends). For gel source data, see Supplementary Figure 1. e, f, Cleavage of substrates containing two or one TIRs or RSSs as indicated above the lanes, by cBbRAGL, cRAG, or complexes in which cBbRAG1L/cRAG1 lack the indicated domain. Black asterisks mark the two single cleavage products. Reaction time of 60 min was used here and in other cleavage reactions unless otherwise specified. g, Transposition frequency measured in HEK293T cells using the assay of Extended Data Fig. 8a.
Fig. 2 ∣
Fig. 2 ∣. Cryo-EM structure of cBbRAGL-nicked 3’TIR complex
a, Symmetrized cryo-EM structure at 4.3 Å resolution of the cBbRAGL/HMGB1-nicked 3’TIR complex. b, Superimposition of one subunit of cBbRAG1L (nicked-3’TIR complex) with cRAG1 (nicked RSS complex; PDB 5ZDZ). c, Superimposition of nicked RSS (PDB 5ZDZ) with nicked 3’TIR showing flipped bases and three catalytic residues and calcium ions (spheres) in the RAG/BbRAGL active site. d, e, The additional density at the C-terminus of BbRAG1L is in close proximity to TR2 (orange) (d) and together with the opposite subunit of BbRAG1L largely encircles the DNA (e). f, Sequence alignment of CTT* from deuterostome invertebrate RAG1L and cnidarian (hydra) Transib proteins. Species name abbreviations are defined in the legend of Extended Data Fig. 5b. Asterisks, conserved residues with Zn2+ coordination potential. g, Cleavage reactions using CTT* mutants of BbRAG1L. Red asterisk, double cleavage band; black asterisks, single TIR cleavage bands.
Fig. 3 ∣
Fig. 3 ∣. DNA cleavage properties of chimeric RAG1-BbRAG1L proteins
a-c, Schematic diagrams of cBbRAG1L and cRAG1 (a), and chimeric proteins containing the catalytic core of BbRAG1L (b) or RAG1 (c) with matching chimeric cleavage targets. In targets T1 and T2, the heptamer derives from the TIR and the remainder from the 12/23RSS while in T3 and T4, the heptamer derives from the RSS and the remainder from the 5’/3’TIR. d-h, Cleavage reactions using chimeric proteins and substrates containing one or two targets as indicated above and below the lanes. ΔNon, nonamer region deleted; T1*, T1 with a C-to-A mutation of heptamer position 1 which renders the target uncleavable; mTR2, scrambling of TR2 in both target sites. Asterisks as in Fig. 2g.
Fig. 4 ∣
Fig. 4 ∣. Residues that control coupled cleavage
a-c, Structure of region surrounding RAG1 E649/S963 before RSS binding (PDB 4WWX) (a), bound to intact RSS (PDB 6CIK) (b), and bound to two nicked RSSs with base flipping (PDB 5ZE1) (c). In (c), E649-S963 hydrogen bond potential is disrupted due to a change in the relative orientation of the residues and acquisition of a potassium ion (K+) d, Structure of region surrounding BbRAG1L V751/A1064 bound to nicked TIR. e, f, Superimposition of protein structural elements containing RAG1 E649/S963 (e) or BbRAG1L V751/A1064 (f) bound to intact or nicked DNA. E649, S963, V751, and A1064 are highlighted with dark colors. In (e), the intact DNA structure was obtained with a RAG1 E962Q mutant. g, Sequence alignments of RAG1, RAG1-like, and Transib proteins in the vicinity of RAG1 E649 and S963. Species name abbreviations are defined in the legend of Extended Data Fig. 5b. h, Cleavage reactions using cRAG with RAG1 mutations and DNA substrates containing one or two RSSs as indicated above the lanes. Asterisks as in Fig. 2g.
Fig. 5 ∣
Fig. 5 ∣. Reawakening the RAG transposon in vivo
a, Structure of region surrounding RAG1 R848 after hairpin formation (PDB 5ZE2). b, Structure of region surrounding RAG1 R848 (PDB 5ZDZ) or BbRAG1L M949 after nicking. c, Sequence alignments of RAG1, RAG1-like, and Transib proteins in the vicinity of RAG1 R848. Red-shaded residues, highly-conserved binding surface for adenine base of heptamer adjacent to flipped C +1. d, Cleavage reactions comparing intramolecular transposition by WT and R848M RAG1. The intramolecular transposition product was confirmed to contain inversion circles by inverse PCR DNA sequencing. e, Results of in vitro transposition reactions with WT or R848M RAG1 (mean ± SEM). Two-tailed t-test: **, p<0.01. f, g, Results of in vivo plasmid-to-plasmid transposition assays with RAG2 1–383 (f) or 1–350 (g) and the indicated full length WT or mutant RAG1 protein, and with full length BbRAGL (mean ± SEM). Total antibiotic resistant colony numbers (gray bars) were corrected (black bars) for the fraction of colonies found to harbor plasmids with bone fide transposition events. Two-tailed t-test: *, p<0.05; **, p<0.01; ***, p<0.005 compared to WT RAG1. h, Number of bone fide transposition events (3–7 bp target site duplication) identified in plasmid-to-genome transposition experiment.

Comment in

References

    1. Gellert M V(D)J recombination: RAG proteins, repair factors, and regulation. Annu. Rev. Biochem 71, 101–132, (2002). - PubMed
    1. Schatz DG & Swanson PC V(D)J recombination: mechanisms of initiation. Annu. Rev. Genet 45, 167–202, (2011). - PubMed
    1. Lewis SM The mechanism of V(D)J joining: lessons from molecular, immunological, and comparative analyses. Adv. Immunol 56, 27–150, (1994). - PubMed
    1. Sinzelle L, Izsvak Z & Ivics Z Molecular domestication of transposable elements: from detrimental parasites to useful host genes. Cell. Mol. Life Sci 66, 1073–1093, (2009). - PMC - PubMed
    1. Levin HL & Moran JV Dynamic interactions between transposable elements and their hosts. Nat. Rev. Genet 12, 615–627, (2011). - PMC - PubMed