. 2019 May;569(7755):280-283.
doi: 10.1038/s41586-019-1089-3. Epub 2019 Apr 10.

Visualization of clustered protocadherin neuronal self-recognition complexes

Affiliations

Visualization of clustered protocadherin neuronal self-recognition complexes

Julia Brasch et al. Nature. 2019 May.

Abstract

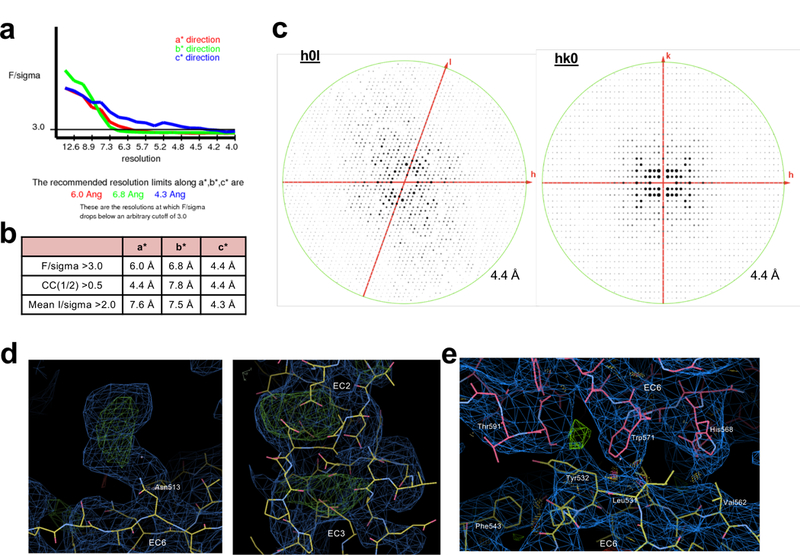
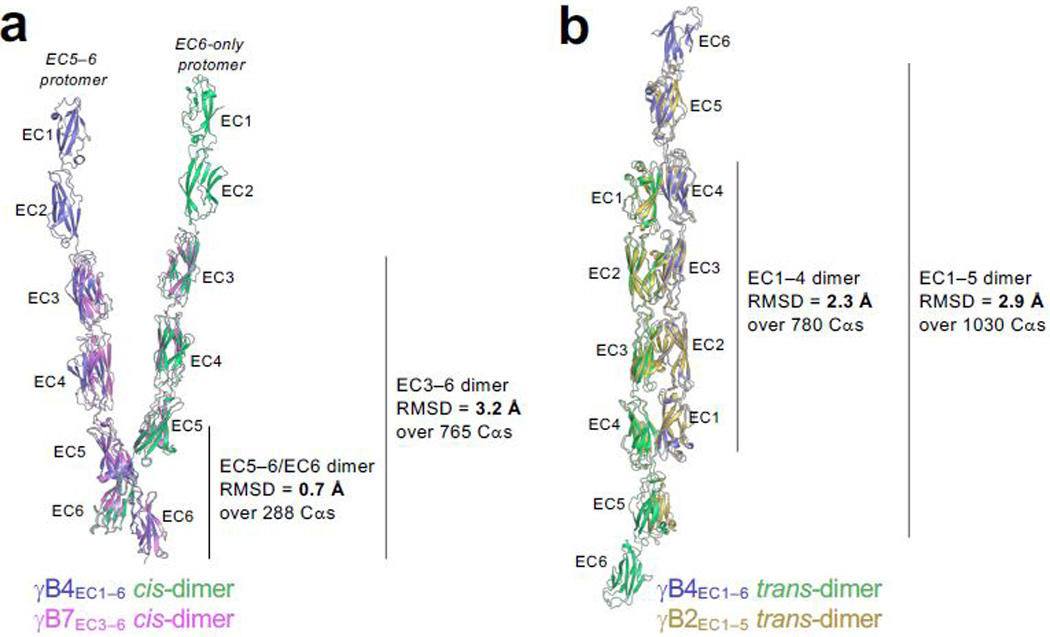
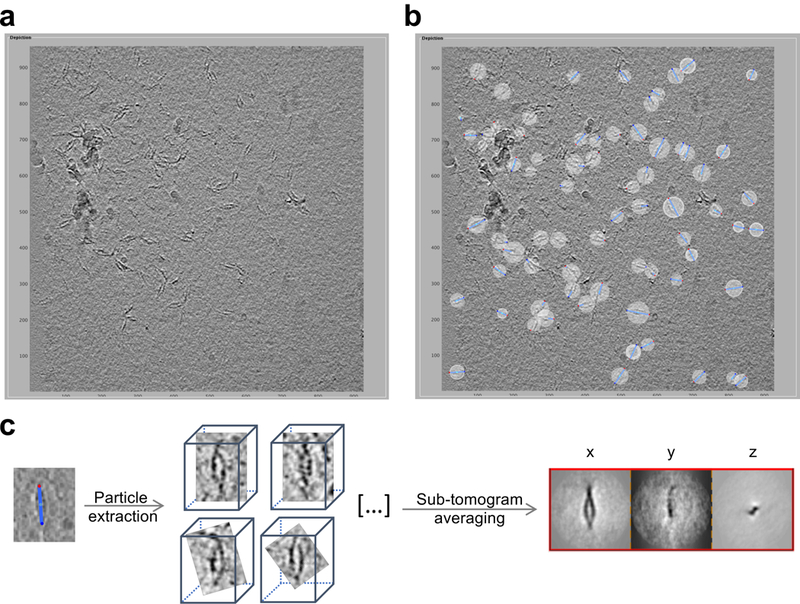
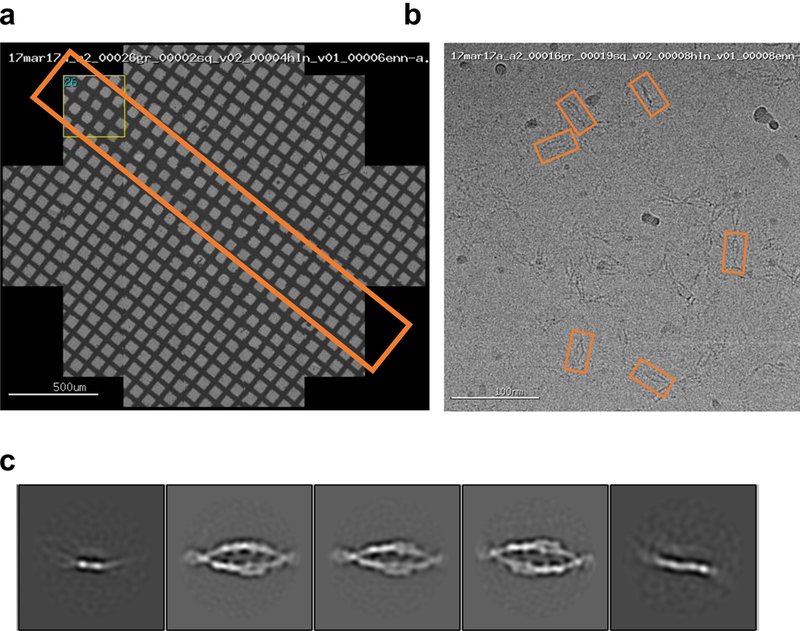
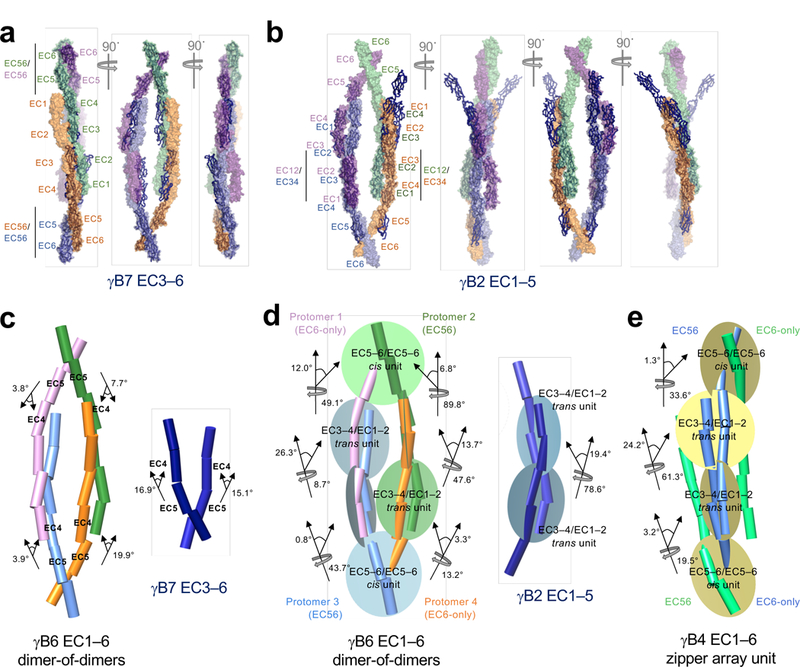
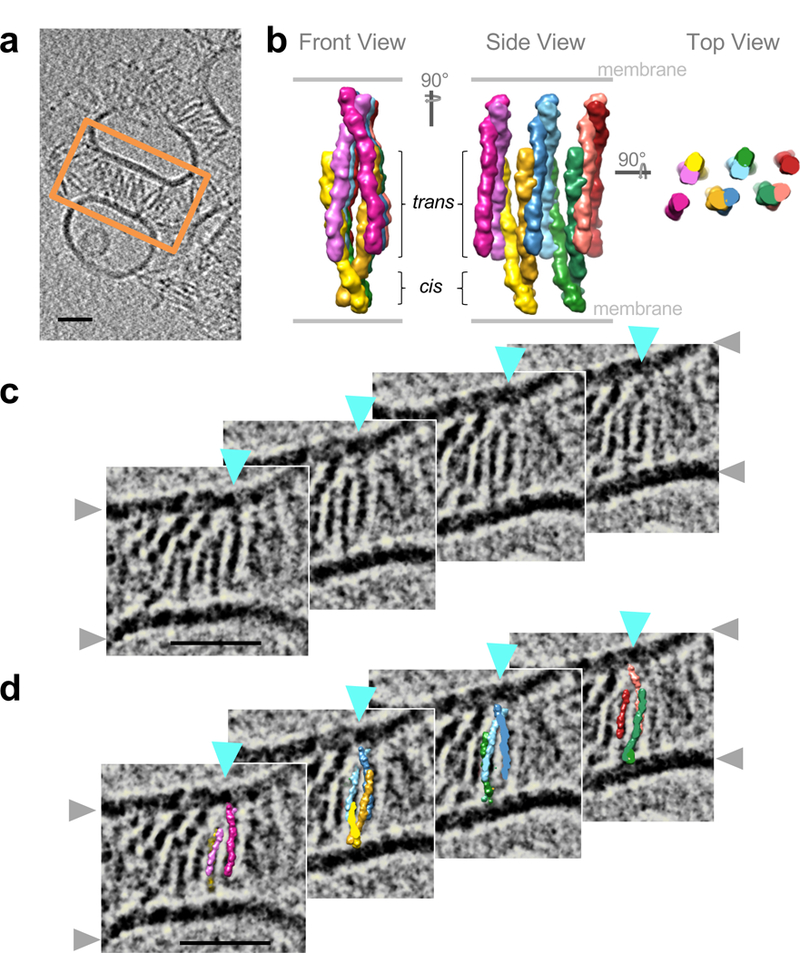
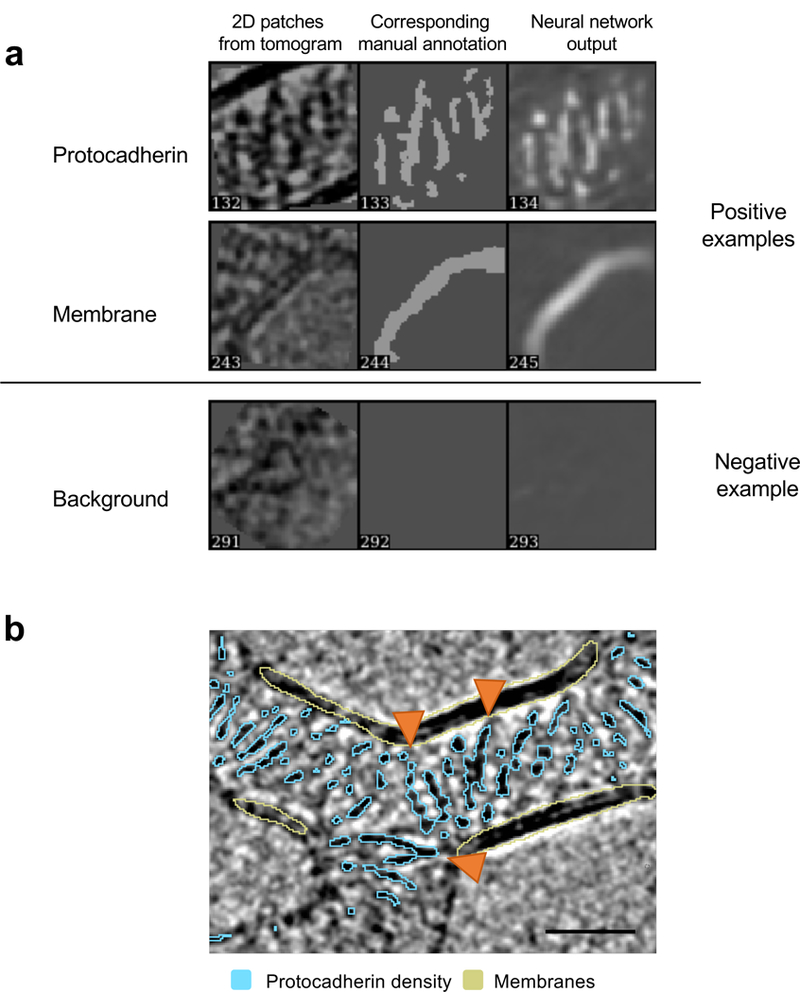
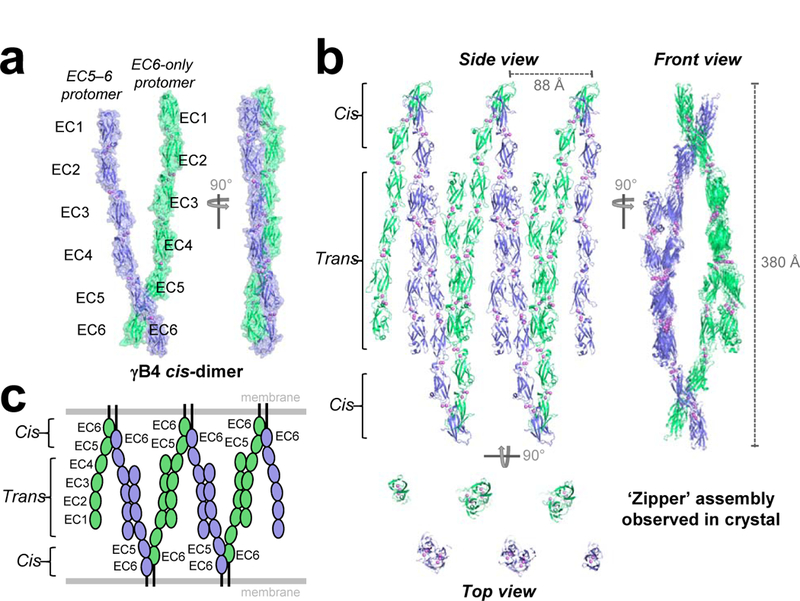
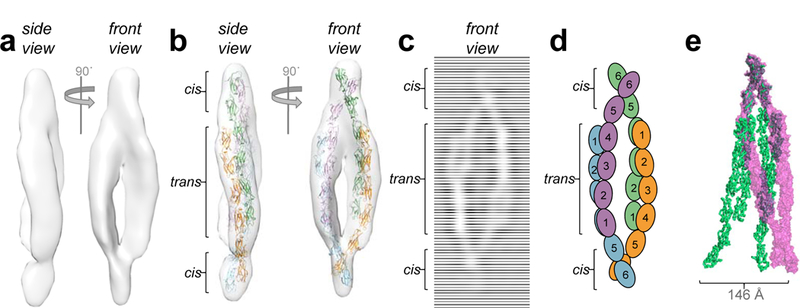
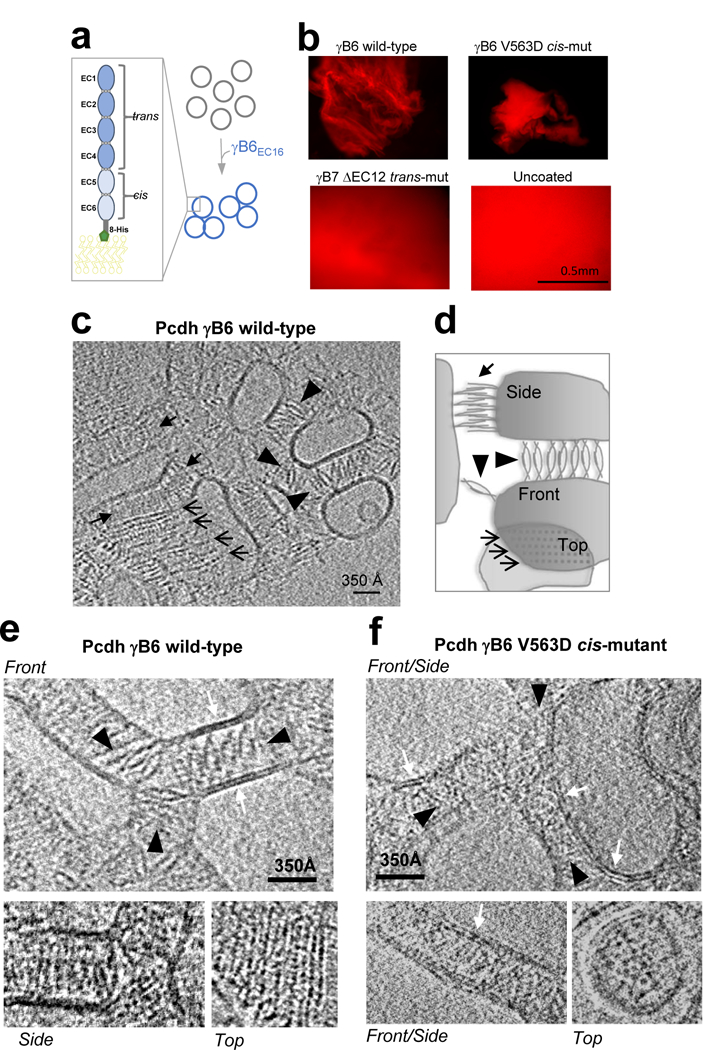
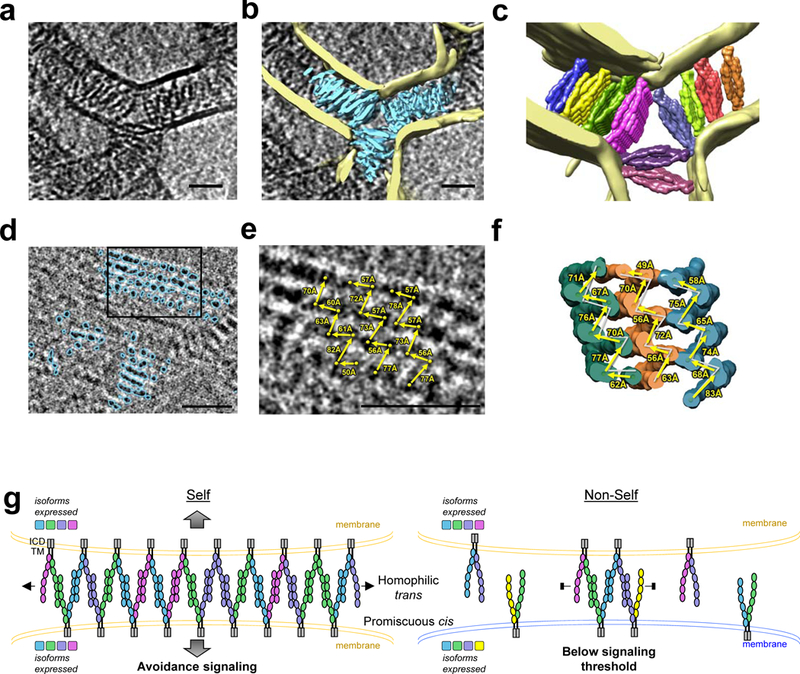
Neurite self-recognition and avoidance are fundamental properties of all nervous systems1. These processes facilitate dendritic arborization2,3, prevent formation of autapses4 and allow free interaction among non-self neurons1,2,4,5. Avoidance among self neurites is mediated by stochastic cell-surface expression of combinations of about 60 isoforms of α-, β- and γ-clustered protocadherin that provide mammalian neurons with single-cell identities1,2,4-13. Avoidance is observed between neurons that express identical protocadherin repertoires2,5, and single-isoform differences are sufficient to prevent self-recognition10. Protocadherins form isoform-promiscuous cis dimers and isoform-specific homophilic trans dimers10,14-20. Although these interactions have previously been characterized in isolation15,17-20, structures of full-length protocadherin ectodomains have not been determined, and how these two interfaces engage in self-recognition between neuronal surfaces remains unknown. Here we determine the molecular arrangement of full-length clustered protocadherin ectodomains in single-isoform self-recognition complexes, using X-ray crystallography and cryo-electron tomography. We determine the crystal structure of the clustered protocadherin γB4 ectodomain, which reveals a zipper-like lattice that is formed by alternating cis and trans interactions. Using cryo-electron tomography, we show that clustered protocadherin γB6 ectodomains tethered to liposomes spontaneously assemble into linear arrays at membrane contact sites, in a configuration that is consistent with the assembly observed in the crystal structure. These linear assemblies pack against each other as parallel arrays to form larger two-dimensional structures between membranes. Our results suggest that the formation of ordered linear assemblies by clustered protocadherins represents the initial self-recognition step in neuronal avoidance, and thus provide support for the isoform-mismatch chain-termination model of protocadherin-mediated self-recognition, which depends on these linear chains11.


Figures

Extended Data Figure 1:
Extended Data Figure 1:. X-ray diffraction anisotropy and electron density map quality for the low-resolution γB4EC1–6 crystal structure.
a, UCLA Diffraction Anisotropy Server (Strong et al., 2006) output showing the data strength as measured by F/sigma along the a*, b* and c* axes. b, The diffraction limits along the a*, b* and c* axes determined by three different methods: F/sigma from (a), and the correlation coefficient (CC) and I/sigma limits calculated by Aimless (Evans et al., 2006; Evans and Murshudov, 2013). c, Synthetic precession photographs of the X-ray diffraction in the k=0 plane (left) and the l=0 plane (right) showing the comparatively stronger/weaker diffraction. d, Exemplar electron density images of the γB4EC1–6 crystal structure highlighting the difference density observed for ligand molecules following placement of all protein domains and one round of rigid body refinement. The left hand panel shows difference density for a glycosylated asparagine residue (Asn513 chain B) and the right hand panel shows difference density for the three calcium ions coordinated between EC domains (EC2–EC3 chain B). 2Fo-Fc (blue) and Fo-Fc maps (green/red) are shown contoured at 1.0 and ±3.0 sigma, respectively. e, Exemplar electron density image of the γB4EC1–6 crystal structure after refinement showing the cis-interface (EC5–6 protomer is colored pink, EC6-only protomer is colored yellow). 2Fo-Fc (blue) and Fo-Fc maps (green/red) are shown contoured at 1.0 and ±3.0 sigma, respectively.
Extended Data Figure 2:
Extended Data Figure 2:. Comparison between the γB4EC1–6 crystal structure and γB-Pcdh fragment structures reveals formation of the zipper-assembly does not require large conformational changes.
a, Structural superposition of the γB4EC1–6 cis-dimer from the crystal structure (one protomer in slate ribbon, the other green) with the γB7EC3–6 fragment cis-dimer structure (PDB: 5V5X; pink ribbon) showing the overall similarity between the two structures particularly in the EC5–6/EC6 cis-interacting regions. b, Structural superposition of the γB4EC1–6 trans-dimer from the crystal structure (slate/green ribbon) with the γB2EC1–5 fragment trans-dimer structure (PDB: 5T9T; gold ribbon) showing the overall similarity between the trans-dimers.
Extended Data Figure 3:
Extended Data Figure 3:. Particle selection and subtomogram averaging of Pcdh γB6 complexes in solution.
a, Representative tomographic slice showing orientation of γB6EC1–6 complexes in vitreous ice. Note that ‘front views’ are predominant, and represent a preferred orientation. Scale indicates nm. b, Complexes in the ice are selected as dipole sets (blue sticks). For each particle ‘north’, ‘center’ and ‘south’ points are marked as blue, cyan and red spheres, respectively. Scale indicates nm. c, Sub-volumes of pre-oriented particles were extracted from tomograms, sub-tomogram averaging converged and projections of last iteration are shown on the right.
Extended Data Figure 4:
Extended Data Figure 4:. 2D cryo-electron microscopy of γB6EC1–6 in solution.
a, Representative grid atlas of a grid prepared using spot-it-on. Orange box highlights the path of sample deposition. b, Representative micrograph of γB6EC1–6 in vitreous ice. Individual EC domains are distinguishable within the ellipsoid particles. Orange boxes indicate presentative particles. c, 2D class averages calculated using Relion show highly preferred orientation of γB6EC1–6 in the ice. Five separate class averages are shown.
Extended Data Figure 5:
Extended Data Figure 5:. Structural comparisons of the dimer-of-dimers model from single particle cryo-EM with crystallographic cis and trans dimers.
a, Crystallographic cis dimers of γB7EC3–6 (blue ribbon) were aligned with the dimer-of-dimers model (space fill, colors as shown in Fig.1) over the EC5–6 cis-dimer regions derived from γB7EC3–6 (black bars). The EC4/EC5 linker regions appear to accommodate a high degree of structural variation. b, Crystallographic γB2EC1–5 trans dimers (blue ribbon) were aligned with the manually positioned EC1–2:EC3–4 dimer fragments (black bars) in the dimer-of-dimers density. Deviations derive from differences in rotation and bend at the EC2–3 and EC3–4 linker regions within the antiparallel EC1–4 trans dimers. c, Comparison of the EC4:5 interdomain deflection angles between the dimer-of-dimers model (left) and the crystallographic γB7EC3–6 cis dimer (right), highlighting the variations between them. Individual EC domains were defined as axes in UCSF chimera and are shown as cylinders. All interdomain deflection angles are listed in Extended Data Table 2. d, The dimer-of-dimers model was assembled by rigid-body fitting into cryo-ET density of four-domain trans (EC1–2/EC3–4) and cis (EC5–6/EC5–6) units from the γB2EC1–5 and γB7EC3–6 crystal structures, respectively. The figure depicts the deflection and rotational angles between these docked units in the final dimer-of-dimers model (left) compared with those in the γB2EC1–5 trans dimer (right), highlighting the conformational change required within the EC1–4 trans interaction to facilitate formation of the dimer-of-dimers. e, Deflection and rotational angles between EC5–6/EC5–6 cis-interaction and the EC3–4/EC1–2 trans-interaction units in the repeating unit of the crystallographic γB4EC1–6 zipper array for comparison to the dimer-of-dimers model.
Extended Data Figure 6:
Extended Data Figure 6:. Data collection strategy for assessing protein assemblies formed by clustered protocadherins between liposomes.
a, Grid-view of protein-liposome aggregates (dark shadows) deposited on lacey carbon grids, 300 copper mesh. b, Hole-view of the boxed area shown in a. Protein-liposome aggregates can be seen as dark shadows. Tilt-series collection of liposome aggregates over lacey carbon holes in thin ice (orange square). White crosses represent other data collection sites, cyan cross represents focus target. c, Tilt image collected at the region highlighted in b. A single layer of liposomes coated in protocadherin density (black arrow head), liposomes stacked on top of each other (white arrow head), and, in addition, thick layers of stacked liposomes (asterisk) are visible in the image. Note that membranes at liposome contact sites appear parallel, and Pcdh density appears to be ordered. See Supplementary Video 2 for the reconstructed tomogram.
Extended Data Figure 7:
Extended Data Figure 7:. Pcdh zippers from the γB4EC1–6 crystal structure match the ordered linear arrays observed for γB6EC1–6 on membranes.
a, Tomographic slice through a reconstructed tomogram of adherent γB6EC1–6-coated liposomes. Region of tomographic slices shown as close-up views in c and d is highlighted by an orange box. b, Molecular surface views of the γB4EC1–6 crystal lattice arrangement in three orientations. Each protomer is colored in a different color. c, Tomographic slices spanning 143 Å into the depth of the tomogram, one linear array progressing into the plane of the tomogram is indicated by cyan arrow heads. Grey arrowheads indicate lipid bilayers. d, Crystallographic γB4EC1–6 zipper fitted consisting of five consecutive cis dimers into the cryo-ET density of the marked γB6EC1–6 array (cyan arrow heads) observed between membranes. Compare density and structure fit between panels in c and d. Protomers colored as in b.Scale bars: 350 Å
Extended Data Figure 8:
Extended Data Figure 8:. Automated tomogram annotation of Pcdh density and membranes.
a, Training and annotation of protein density and lipid bilayers. Examples of representative 2D positive (top two panels) and negative (bottom panel) annotations are shown. Regions of interest on a tomographic slice are shown on the left and manual annotation in middle panels identify positive (white particles on black background) features (top two panels). Output after the training is shown on the right. Representative negative example shown in the bottom panel, in which no features are annotated by the trained neural network. b, Annotated tomographic slice. Pcdh density is shown in cyan, membranes in pastel yellow. Orange arrow heads indicate single protomers to highlight examples for domain level resolution of annotation. Scale bar: 350 Å.
Figure 1:
Figure 1:. Crystal structure of the Pcdh γB4 ectodomain reveals a zipper-like assembly
a, Asymmetric unit of the γB4 crystal structure containing two γB4EC1–6 protomers (green and blue) engaged in the asymmetrical cis-dimer interaction. b, Zipper-like array of γB4 through EC1–4-mediated trans interactions between two-fold related cis dimers. Three orthogonal views shown with bound calcium ions (violet spheres). γB4 molecules interacting in trans are shown in identical colors. Top view shows a slice through the midsection. c, Schematic of the zipper-like assembly depicted in b arranged as if between two membranes.
Figure 2:
Figure 2:. Pcdh γB6 ectodomains in solution assemble as a dimer-of-dimers through cis and trans interfaces.
a, Subtomogram averaged density map of γB6EC1–6 particles from reconstructed tomograms reveals an asymmetric ellipsoidal complex. b, Fit of γB-Pcdh trans and cis dimer crystal structures into the cryo-ET map. c, 2D-class average of γB6EC1–6 particles in ice. Compare to b. d, Schematic model of γB6EC1–6 ectodomains in the dimer-of-dimers. e, Overlay of γB6EC1–6 dimer-of-dimers (magenta volume) with γB4EC1–6 zipper from the crystal structure (green ribbon). Distance between EC6 domains of equivalent protomers in each model indicated by an arrow.
Figure 3:
Figure 3:. Pcdh γB6 forms continuous ordered assemblies between liposome membranes.
a, γB6EC1–6 ectodomains tethered to liposomes facilitate aggregation. b, Liposome aggregates visualized by fluorescence microscopy. Wild-type and V563D cis-mutant γB6EC1–6 form single large aggregates (shown), while trans-mutant γB7EC1–6 ΔEC1–2 fails to aggregate liposomes. Negative control shows uncoated liposomes. c, Slice of a tomogram showing aggregates of liposomes coated with wild-type γB6EC1–6 ectodomains. Different views of ordered assemblies indicated by arrows. d, Schematic of lattice orientations corresponding to views in c. e and f, Close up views of individual slices of tomograms showing front (top panel), side (bottom left) and top (bottom right) views of assemblies formed by ectodomains of wild-type (e) and V563D cis-mutant (f) γB6EC1–6. Note that ordered assemblies are absent in the mutant. White arrows indicate lipid bilayers.
Figure 4:
Figure 4:. Pcdh γB6 forms extended parallel zipper arrays on membranes consistent with the chain-termination model.
a, Close up view of a single tomographic slice showing γB6EC1–6 assemblies between liposome membranes. Parallel zipper arrays appear as front views extending into the plane (orthogonal to zipper side view shown schematically in g). Scale bar: 350Å. b, Annotated maps of lipid bilayers (yellow) and γB6EC1–6 (cyan) overlaid as a slab on a. c, Ten linear arrays of cis/trans interactions from the γB4EC1–6 crystal lattice (surfaces) fitted into the protein density. Lipid bilayers shown in yellow. See also Supplementary Video 5. d, Tomogram slice showing annotated ‘top views’ of parallel Pcdh zipper arrays (cyan) formed between membranes of vertically stacked liposomes. e, Magnification of the region boxed in d. Distances (arrows) between protomers (spheres) in three separate zipper arrays are given. f, Distances analogous to those in e, measured from zipper array crystal structures fitted into the protein density. For comparison distances from e are included as grey lines. g, Schematic model of the chain-termination model of Pcdh function in neuronal self-avoidance. See text.

References

    1. Zipursky SL & Grueber WB in Annual Review of Neuroscience, Vol 36 Vol. 36 Annual Review of Neuroscience; (ed Hyman SE) 547–568 (2013). - PubMed
    1. Lefebvre JL, Kostadinov D, Chen WV, Maniatis T & Sanes JR Protocadherins mediate dendritic self-avoidance in the mammalian nervous system. Nature 488, 517–521, doi:10.1038/nature11305 (2012). - DOI - PMC - PubMed
    1. Molumby MJ, Keeler AB & Weiner JA Homophilic Protocadherin Cell-Cell Interactions Promote Dendrite Complexity. Cell Reports 15, 1037–1050, doi:10.1016/j.celrep.2016.03.093 (2016). - DOI - PMC - PubMed
    1. Kostadinov D & Sanes JR Protocadherin-dependent dendritic self-avoidance regulates neural connectivity and circuit function. Elife 4, doi:10.7554/eLife.08964 (2015). - DOI - PMC - PubMed
    1. Mountoufaris G et al. Multicluster Pcdh diversity is required for mouse olfactory neural circuit assembly. Science 356, 411–414, doi:10.1126/science.aai8801 (2017). - DOI - PMC - PubMed

Publication types