. 2019 Mar 26:12:66.
doi: 10.3389/fnmol.2019.00066. eCollection 2019.

Construction of Potential Glioblastoma Multiforme-Related miRNA-mRNA Regulatory Network

Affiliations

Construction of Potential Glioblastoma Multiforme-Related miRNA-mRNA Regulatory Network

Weiyang Lou et al. Front Mol Neurosci. .

Abstract

Background: Glioblastoma multiforme (GBM), the most common and aggressive human malignant brain tumor, is notorious for its limited treatment options and poor prognosis. MicroRNAs (miRNAs) are found to be involved in tumorigenesis of GBM. However, a comprehensive miRNA-mRNA regulatory network has still not been established. Methods: A miRNA microarray dataset (GSE90603) was obtained from GEO database. Then, we employed GEO2R tool to perform differential expression analysis. Potential transcription factors and target genes of screened differentially expressed miRNAs (DE-miRNAs) were predicted. The GBM mRNA dataset were downloaded from TCGA database for identifying differentially expressed genes (DEGs). Next, GO annotation and KEGG pathway enrichment analysis was conducted. PPI network was then established, and hub genes were identified via Cytoscape software. The expression and prognostic roles of hub genes was further evaluated. Results: Total 33 DE-miRNAs, consisting of 10 upregulated DE-miRNAs and 23 downregulated DE-miRNAs, were screened. SP1 was predicted to potentially regulate most of screened DE-miRNAs. Three thousand and twenty seven and 3,879 predicted target genes were obtained for upregulated and downregulated DE-miRNAs, respectively. Subsequently, 1,715 upregulated DEGs and 1,259 downregulated DEGs were identified. Then, 149 and 295 potential downregulated and upregulated genes commonly appeared in target genes of DE-miRNAs and DEGs were selected for GO annotation and KEGG pathway enrichment analysis. The downregulated genes were significantly enriched in cGMP-PKG signaling pathway and calcium signaling pathway whereas the upregulated genes were enriched in pathways in cancer and PI3K-Akt signaling pathway. Construction and analysis of PPI network showed that STXBP1 and TP53 were recognized as hub genes with the highest connectivity degrees. Expression analytic result of the top 20 hub genes in GBM using GEPIA database was generally identical with previous differential expression analysis for TCGA data. EGFR, PPP3CB, and MYO5A expression was significantly associated with patients' OS. Conclusions: In this study, we established a potential GBM-related miRNA-mRNA regulatory network, which explores a comprehensive understanding of the molecular mechanisms and provides key clues in seeking novel therapeutic targets for GBM. In the future, more experiments need to be performed to validate our current findings.

Keywords: GEO; TCGA; bioinformatic analysis; glioblastoma multiform (GBM); microRNAs (miRNAs).


Figures

Figure 1
Figure 1
Identification of differentially expressed miRNAs (DE-miRNAs). (A) DE-miRNAs between group A and group B; (B) DE-miRNAs between group A and group C; (C) DE-miRNAs between group A and group D; (D) intersection of upregulated DE-miRNAs in three compared sets; (E) intersection of downregulated DE-miRNAs in three compared sets. Group A contained GBM tumor tissue samples (n = 16); group B contained adjacent normal brain tissue samples from GBM patients (n = 4); group C contained normal brain tissue samples from healthy volunteer (n = 3); group D contained normal samples from group B and C (n = 7). |log2FC| > 2 and adj P < 0.05 were set as the thresholds for identifying DE-miRNAs. Red dots and green dots represent the upregulated and downregulated miRNAs in GBM tumor samples, respectively; black dots represent miRNAs that are not differentially expressed between tumor samples and normal samples.
Figure 2
Figure 2
Predicted transcription factors of DE-miRNAs. (A) Transcription factors of upregulated DE-miRNAs; (B) transcription factors of downregulated DE-miRNAs.
Figure 3
Figure 3
Potential target genes of DE-miRNAs predicted by miRNet database. (A) Upregulated DE-miRNAs-target genes network constructed using miRNet; (B) downregulated DE-miRNAs-target genes network constructed using miRNet; (C) target gene count for each upregulated DE-miRNA; (D) target gene count for each downregulated DE-miRNA.
Figure 4
Figure 4
Normalization of TCGA data. (A) Data before normalization; (B) data after normalization.
Figure 5
Figure 5
The differentially expressed genes (DEGs) between GBM samples and normal samples from TCGA database. The red and green dots represent significantly upregulated and downregulated DEGs, respectively. The black dots represent genes that are not differentially expressed tumor samples and normal samples.
Figure 6
Figure 6
Screen of candidate genes. (A) The intersection of target genes of upregulated DE-miRNAs and downregulated DEGs; (B) the intersection of target genes of downregulated DE-miRNAs and upregulated DEGs.
Figure 7
Figure 7
GO functional annotation of candidate genes. (A) The top 10 enriched BP items of downregulated candidate genes; (B) the top 10 enriched BP items of upregulated candidate genes; (C) the top 10 enriched CC items of downregulated candidate genes; (D) the top 10 enriched CC items of upregulated candidate genes; (E) the top 10 enriched MF items of downregulated candidate genes; (F) the top 10 enriched MF items of upregulated candidate genes.
Figure 8
Figure 8
The candidate miRNA-hub gene regulatory network in GBM.
Figure 9
Figure 9
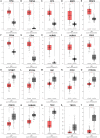
The expression levels of 20 hub genes from the GEPIA database. *P < 0.05.

References

    1. Adlakha Y. K., Saini N. (2014). Brain microRNAs and insights into biological functions and therapeutic potential of brain enriched miRNA-128. Mol. Cancer. 13:33. 10.1186/1476-4598-13-33 - DOI - PMC - PubMed
    1. Bekris L. M., Leverenz J. B. (2015). The biomarker and therapeutic potential of miRNA in Alzheimer's disease. Neurodegener. Dis. Manag. 5, 61–74. 10.2217/nmt.14.52 - DOI - PubMed
    1. Bekris L. M., Lutz F., Montine T. J., Yu C. E., Tsuang D., Peskind E. R., et al. . (2013). MicroRNA in Alzheimer's disease: an exploratory study in brain, cerebrospinal fluid and plasma. Biomarkers 18, 455–466. 10.3109/1354750X.2013.814073 - DOI - PMC - PubMed
    1. Bier A., Giladi N., Kronfeld N., Lee H. K., Cazacu S., Finniss S., et al. . (2013). MicroRNA-137 is downregulated in glioblastoma and inhibits the stemness of glioma stem cells by targeting RTVP-1. Oncotarget 4, 665–676. 10.18632/oncotarget.928 - DOI - PMC - PubMed
    1. Burgos K., Malenica I., Metpally R., Courtright A., Rakela B., Beach T., et al. . (2014). Profiles of extracellular miRNA in cerebrospinal fluid and serum from patients with Alzheimer's and Parkinson's diseases correlate with disease status and features of pathology. PLoS ONE 9:e94839. 10.1371/journal.pone.0094839 - DOI - PMC - PubMed