. 2019 Mar 27:13:36.
doi: 10.3389/fnana.2019.00036. eCollection 2019.

Cyto- and Myelo-Architecture of the Amygdaloid Complex of the Common Marmoset Monkey (Callithrix jacchus)

Affiliations

Cyto- and Myelo-Architecture of the Amygdaloid Complex of the Common Marmoset Monkey (Callithrix jacchus)

Paulo Leonardo Araújo Góis Morais et al. Front Neuroanat. .

Abstract

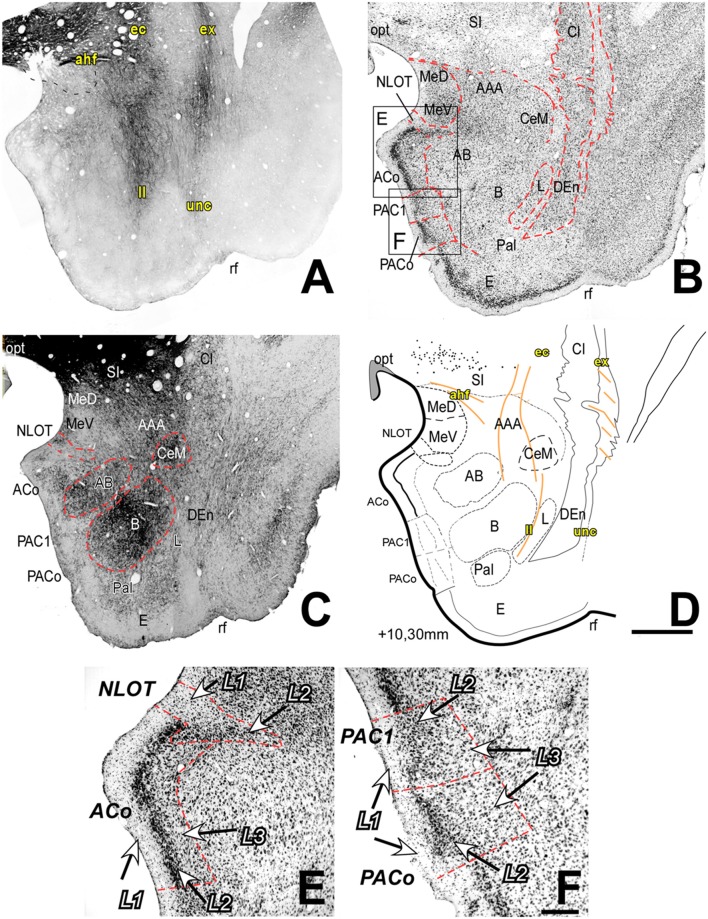
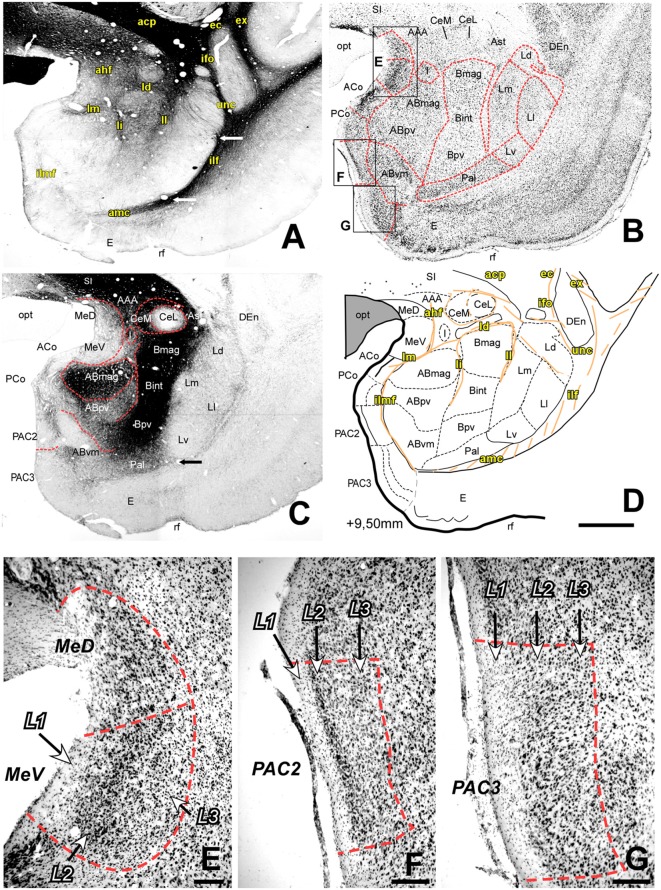
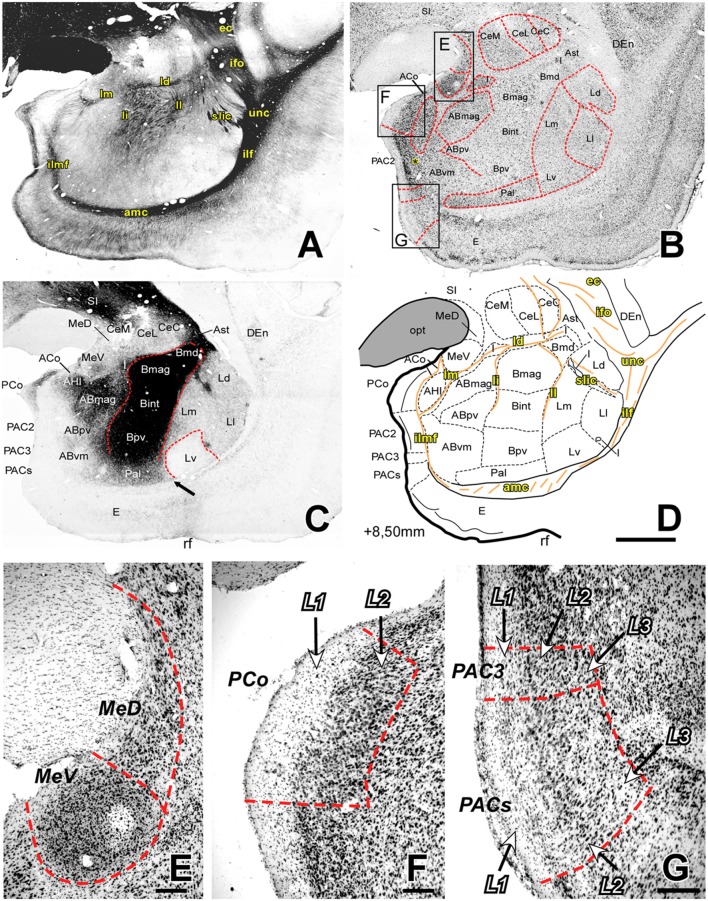
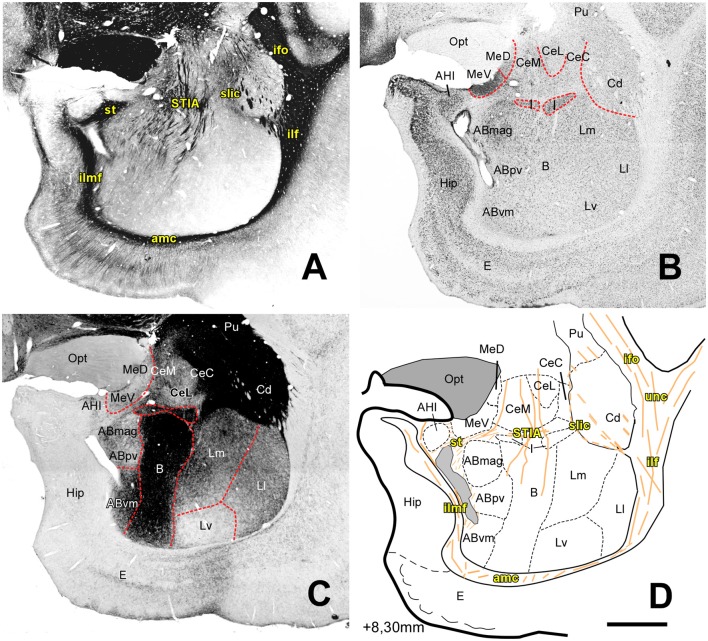
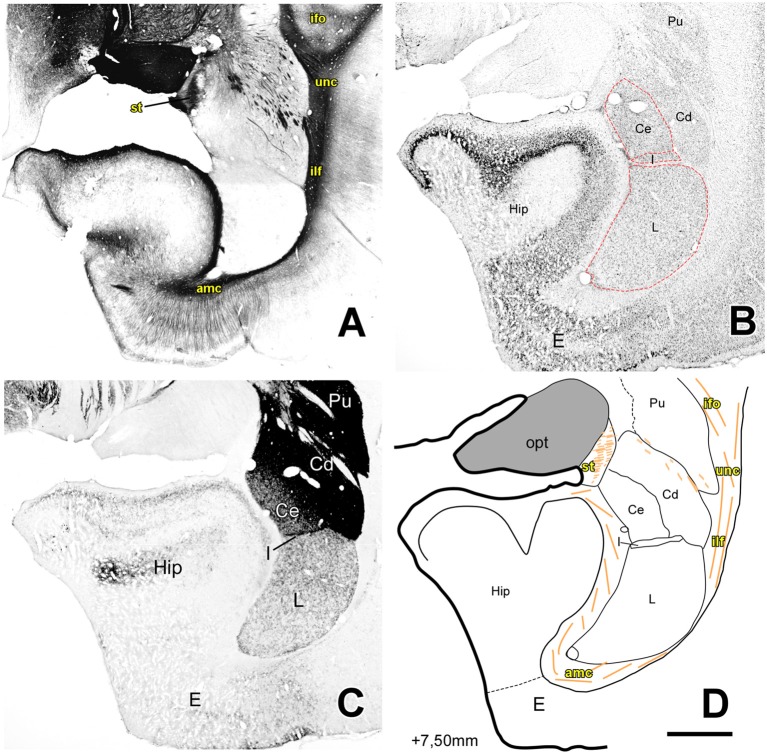
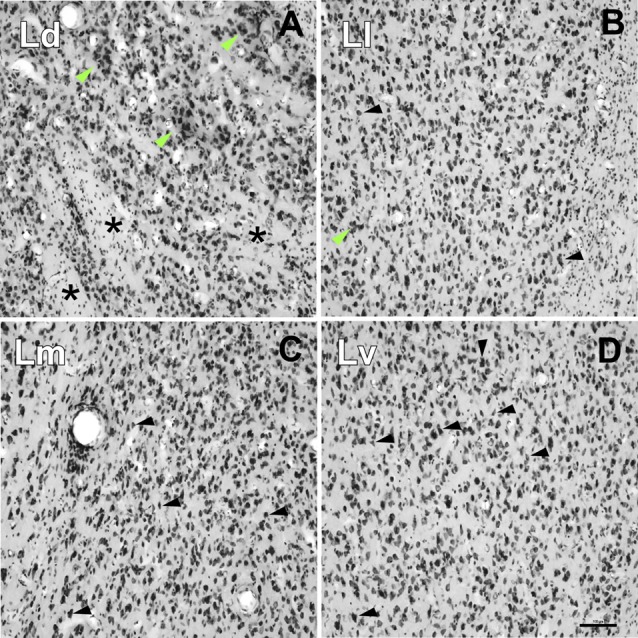
The amygdaloid complex (AC) is a heterogeneous aggregate of nuclei located in the rostromedial region of the temporal lobe. In addition to being partly connected among themselves, the AC nuclei are strongly interconnected with the cerebral cortex, striatum, basal forebrain, hypothalamus and brainstem. Animal and human functional studies have established that the AC is a central hub of the neuronal networks supporting emotional responsivity, particularly its negative/aversive components. Dysfunction of AC circuits in humans has been implicated in anxiety, depression, schizophrenia and bipolar disorder. The small New-World marmoset monkey (Callithrix jacchus) has recently become a key model for neuroscience research. However, the nuclear and fiber tract organization of marmoset AC has not been examined in detail. Thus, the extent to which it can be compared to the AC of Old-World (human and macaque) primates is yet unclear. Here, using Nissl and acetylcholinesterase (AChE) histochemical stains as a reference, we analyzed the cytoarchitecture and nuclear parcellation of the marmoset AC. In addition, given the increasing relevance of tractographic localization for high-resolution in vivo imaging studies in non-human primates, we also identified the myelin fiber tracts present within and around the AC as revealed by the Gallyas method. The present study provides a detailed atlas of marmoset AC. Moreover, it reveals that, despite phylogenetic distance and brain size differences, every nucleus and myelinated axon bundle described in human and macaque studies can be confidently recognized in marmosets.

Keywords: amygdaloid complex; marmoset Callithrix jacchus; myelin staining; nuclear division; tractography.


Figures

Figure 1
Figure 1
Myelo- and cytoarchitecture of the amygdaloid complex (AC), level 1 (Interaural 10.30 mm). Series of adjacent coronal sections stained for Gallyas (A), Nissl (B) and acetylcholinesterase (AChE) (C) and the corresponding drawing showing in black the territories of the AC and in orange the myelinic bundles schematically (D). At this level, it is already possible to identify the deep nuclei, and some of the superficial nuclei and myelin tracts located around and within the nuclei and helping in their delimitation. Unambiguous nuclear boundaries are drawn with a red dashed line in (B,C). (C) Note the intense staining of AChE in the Basal nucleus (B) and, although heterogeneous, in the accessory basal (AB); CeM showed a markedly high AChE staining level. Panels (E,F) are high magnification bright-field photomicrographs from Nissl-stained sections in the superficial areas of the AC [corresponding to the black squares in (B)]; the layers are indicated in each region. (E) The anterior cortical nucleus (ACo) contains a densely stained and cell-packed L2; the nucleus of the lateral olfactory tract (NLOT) shows a large L1. (F) PACo (inferior) and periamygdaloid cortex (PAC) 1 (superior). Note the different cell compaction of L2 between these two regions. Scale: 1 mm in (A–D) and 200 μm in (E,F).
Figure 2
Figure 2
Myelo- and cytoarchitecture, level 2 (Interaural 9.50 mm). Series of adjacent coronal sections stained for Gallyas (A), Nissl (B) and AChE (C) and the corresponding drawing showing in black the territories of the AC and in orange the myelinic bundles schematically (D). Unambiguous nuclear boundaries are drawn with a red dashed line. The divisions of the Ce showed huge differences in AChE staining intensity at this level (C). In (A), white arrows indicate the boundaries between the L and the Pal (bottom) and between the Ld and Ll subdivisions (top). Also, interesting is the presence of highly AChE stained I between the Ce and AB (C,D). Myelin fibers help in the delimitation of the Ce and are abundant in the Bmag and Bint (A). Panels (E–G) are high magnification bright-field photomicrographs of Nissl-stained sections in different portions of the superficial areas of the AC [corresponding to black squares in (B)]; the layers are indicated in each region. In (E), the rostral level of the Me shows three obvious layers in the ventral division which were not visible in the dorsal division. At this level, there are two subdivisions of the PAC, each of them showing a characteristic layer pattern: (F) In the PAC2 subdivision, L2 is thin and has densely packed cells; (G) PAC 3 has a large L2 formed by big and highly stained cells. Scale: 1 mm in (A–D) and 200 μm in (E–G).
Figure 3
Figure 3
Myelo- and cytoarchitecture, level 3 (Interaural 8.50 mm). Series of adjacent coronal sections stained for Gallyas (A), Nissl (B) and AChE (C) and the corresponding drawing showing in black the territories of the AC and in orange the myelinic bundles schematically (D). Unambiguous nuclear boundaries are drawn with a red dashed line. The divisions of the Ce showed no difference in AChE at this level (C). The presence of heavily AChE stained I within the L, separating its subdivisions (C,D) is also distinctive in this level. Myelin fibers clearly demarcate the ventral border of the Ce and are very abundant in the B (A). Panels (E–G) are high magnification bright-field photomicrographs from Nissl-stained sections in different portions of the superficial areas of the AC (corresponding to the black squares in B); the layers are indicated in each region. In (E), the most caudal level of the Me, the MeV has lost the layered pattern and contains highly compacted cells; (F) posterior cortical nucleus (PCo) is characterized by only two layers. (G) Two of the three PAC subdivisions present at this level are shown: PAC 3 (superior) and PACs (inferior), both containing lightly stained neurons in L1. Scale: 1 mm in (A–D) and 200 μm in (E–G). The asterisk in panel B is located in L3 of PAC2, which contains more scattered Nissl-stained cells than L2.
Figure 4
Figure 4
Myelo- and cytoarchitecture, level 4 (Interaural 8.30 mm). Series of adjacent coronal sections stained for Gallyas (A), Nissl (B) and AChE (C) and the corresponding drawing showing in black the territories of the AC and in orange the myelinic bundles schematically (D). Unambiguous nuclear boundaries are drawn with a red dashed line. At this level, the Hip appears medial to the AC, the cytoarchitectonic profile of the B and AB nuclei becomes diffuse, and the Ld subdivision is not distinguishable in the L. The divisions of the Ce show differences in the AChE staining at this level, with the capsular subdivision being more intensely stained (C). The location of the I coincides with an intense myelin stained region and with an appearance of the st and its intraamygdaloid component (STIA). Scale: 1 mm.
Figure 5
Figure 5
Myelo- and cytoarchitecture, level 5 (Interaural 7.50 mm). Series of adjacent coronal sections stained for Gallyas (A), Nissl (B) and AChE (C) and the corresponding drawing showing in black the territories of the AC and in orange the myelinic bundles schematically (D). Unambiguous nuclear boundaries are drawn with a red dashed line. At this level, the Hip shows a bigger volume than the AC and only the L, Ce, I and Me nuclei were present. At this level, STIA is adjacent to the opt and a strongly AChE stained I separated the Me and Ce nuclei from the L. Scale: 1 mm.
Figure 6
Figure 6
High-power photomicrographs showing the cytoarchitecture of the lateral nucleus subdivisions. (A) Ld neurons are medium to large sized and clustered (green arrows). Asterisks indicate accumulations of small areas of white matter. (B) Neurons in the Ll have different shapes (black arrows) and are less densely packed than in the Ld (A) and Lm (C), and more densely than in the Lv (D); neuron clusters are rare (green arrow). (C) Neurons in the Lm have a variety of shapes and sizes (black arrows). (D) The Lv is characterized by a relatively low neuronal density with great variability in their sizes and shapes and poorly stained. Scale bar: 100 μm.

References

    1. Aggleton J. P., Burton M. J., Passingham R. E. (1980). Cortical and subcortical afferents to the amygdala of the rhesus monkey (Macaca mulatta). Brain Res. 190, 347–368. 10.1016/0006-8993(80)90279-6 - DOI - PubMed
    1. Amaral D. G., Bassett J. L. (1989). Cholinergic innervation of the monkey amygdala: an immunohistochemical analysis with antisera to choline acetyltransferase. J. Comp. Neurol. 281, 337–361. 10.1002/cne.902810303 - DOI - PubMed
    1. Amaral D. G., Insausti R. (1992). Retrograde transport of D-[3H]-aspartate injected into the monkey amygdaloid complex. Exp. Brain Res. 88, 375–388. 10.1007/bf02259113 - DOI - PubMed
    1. Amaral D. G., Price J. L., Pitkanen A., Carmichael S. T. (1992). “Anatomical organization of the primate amygdaloid complex,” in The Amygdala: Neurobiological Aspects of Emotion, Memory and Mental Dysfunction, ed. Aggleton J. P. (New York, NY: Wiley-Liss; ), 1–66.
    1. Avendaño C., Reinoso-Suarez F. (1975). Atlas Estereotáxico de la Amígdala, el Hipotálamo y la Región Preóptica del Gato. Servicio de publicaciones de la Universidad Autónoma de Madrid.

LinkOut - more resources