

Motometrics: A Toolbox for Annotation and Efficient Analysis of Motor Evoked Potentials
- PMID: 30971908
- PMCID: PMC6444173
- DOI: 10.3389/fninf.2019.00008
Motometrics: A Toolbox for Annotation and Efficient Analysis of Motor Evoked Potentials
Abstract
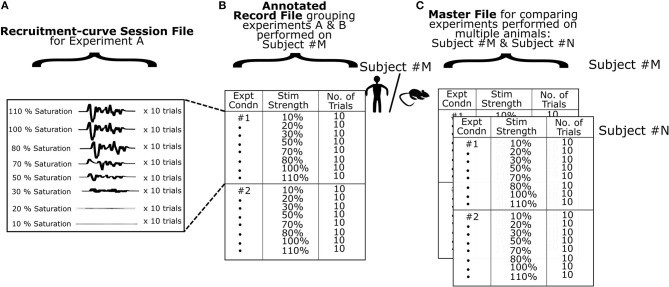
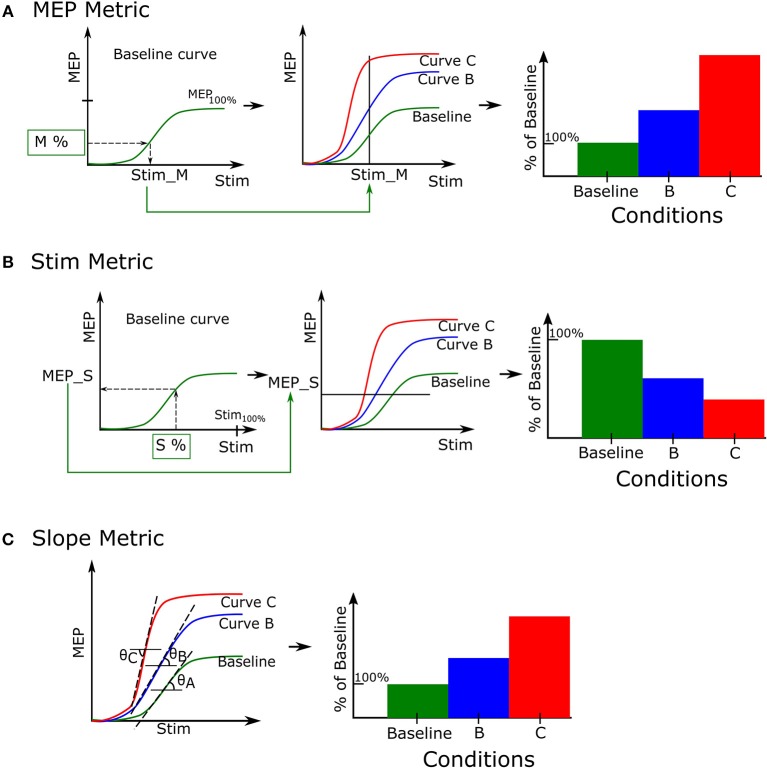
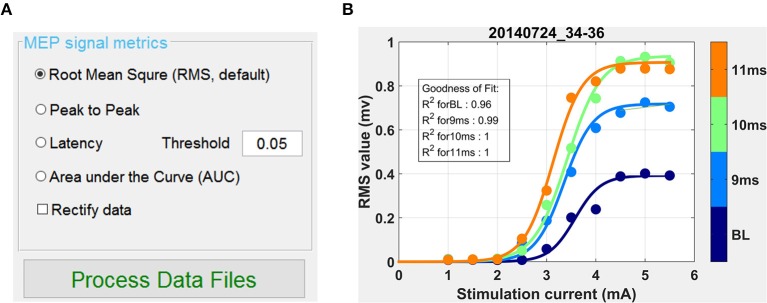
Stimulating the nervous system and measuring muscle response offers a unique opportunity to interrogate motor system function. Often, this is performed by stimulating motor cortex and recording muscle activity with electromyography; the evoked response is called the motor evoked potential (MEP). To understand system dynamics, MEPs are typically recorded through a range of motor cortex stimulation intensities. The MEPs increase with increasing stimulation intensities, and these typically produce a sigmoidal response curve. Analysis of MEPs is often complex and analysis of response curves is time-consuming. We created an MEP analysis software, called Motometrics, to facilitate analysis of MEPs and response curves. The goal is to combine robust signal processing algorithms with a simple user interface. Motometrics first enables the user to annotate data files acquired from the recording system so that the responses can be extracted and labeled with the correct subject and experimental condition. The software enables quick visual representations of entire datasets, to ensure uniform quality of the signal. It then enables the user to choose a variety of response curve analyses and to perform near real time quantification of the MEPs for quick feedback during experimental procedures. This is a modular open source tool that is compatible with several popular electrophysiological systems. Initial use indicates that Motometrics enables rapid, robust, and intuitive analysis of MEP response curves by neuroscientists without programming or signal processing expertise.
Keywords: EMG; MEP; analysis; evoked; motor; recruitment; software.
Figures


Similar articles
-
Effect of isoflurane on motor-evoked potentials induced by direct electrical stimulation of the exposed motor cortex with single, double, and triple stimuli in rats.Anesthesiology. 1996 Nov;85(5):1176-83. doi: 10.1097/00000542-199611000-00027. Anesthesiology. 1996. PMID: 8916836
-
EEG-triggered TMS reveals stronger brain state-dependent modulation of motor evoked potentials at weaker stimulation intensities.Brain Stimul. 2019 Jan-Feb;12(1):110-118. doi: 10.1016/j.brs.2018.09.009. Epub 2018 Sep 21. Brain Stimul. 2019. PMID: 30268710
-
Intraoperative myogenic motor evoked potentials induced by direct electrical stimulation of the exposed motor cortex under isoflurane and sevoflurane.Anesth Analg. 1996 Mar;82(3):593-9. doi: 10.1097/00000539-199603000-00029. Anesth Analg. 1996. PMID: 8623967
-
Differentiation of motor evoked potentials elicited from multiple forearm muscles: An investigation with high-density surface electromyography.Brain Res. 2017 Dec 1;1676:91-99. doi: 10.1016/j.brainres.2017.09.017. Epub 2017 Sep 18. Brain Res. 2017. PMID: 28935187
-
Intraoperative monitoring of motor evoked potentials: a review of 116 cases.Neurology. 1996 Oct;47(4):999-1004. doi: 10.1212/wnl.47.4.999. Neurology. 1996. PMID: 8857734 Review.
Cited by
-
Assessment of Motor Evoked Potentials in Multiple Sclerosis.Sensors (Basel). 2023 Jan 2;23(1):497. doi: 10.3390/s23010497. Sensors (Basel). 2023. PMID: 36617096 Free PMC article. Review.
-
MEPFeatX-automated feature extraction of motor-evoked potentials in transcranial magnetic stimulation.Front Neurosci. 2025 Jan 14;18:1415257. doi: 10.3389/fnins.2024.1415257. eCollection 2024. Front Neurosci. 2025. PMID: 39877658 Free PMC article.
-
Input-output slope curve estimation in neural stimulation based on optimal sampling principles.J Neural Eng. 2021 May 28;18(4):10.1088/1741-2552/abffe5. doi: 10.1088/1741-2552/abffe5. J Neural Eng. 2021. PMID: 33975287 Free PMC article.
-
DELMEP: a deep learning algorithm for automated annotation of motor evoked potential latencies.Sci Rep. 2023 May 22;13(1):8225. doi: 10.1038/s41598-023-34801-9. Sci Rep. 2023. PMID: 37217502 Free PMC article.
-
Closed-loop optimal and automatic tuning of pulse amplitude and width in EMG-guided controllable transcranial magnetic stimulation.Biomed Eng Lett. 2022 Dec 30;13(2):119-127. doi: 10.1007/s13534-022-00259-3. eCollection 2023 May. Biomed Eng Lett. 2022. PMID: 37124104 Free PMC article.
References
-
- Biabani M., Farrell M., Zoghi M., Egan G., Jaberzadeh S. (2018). The minimal number of TMS trials required for the reliable assessment of corticospinal excitability, short interval intracortical inhibition, and intracortical facilitation. Neurosci. Lett. 674, 94–100. 10.1016/j.neulet.2018.03.026 - DOI - PubMed
LinkOut - more resources
Full Text Sources