. 2019 Mar 26:11:8.
doi: 10.3389/fnsyn.2019.00008. eCollection 2019.

Optical Quantal Analysis

Affiliations

Optical Quantal Analysis

Matthew J MacDougall et al. Front Synaptic Neurosci. .

Abstract

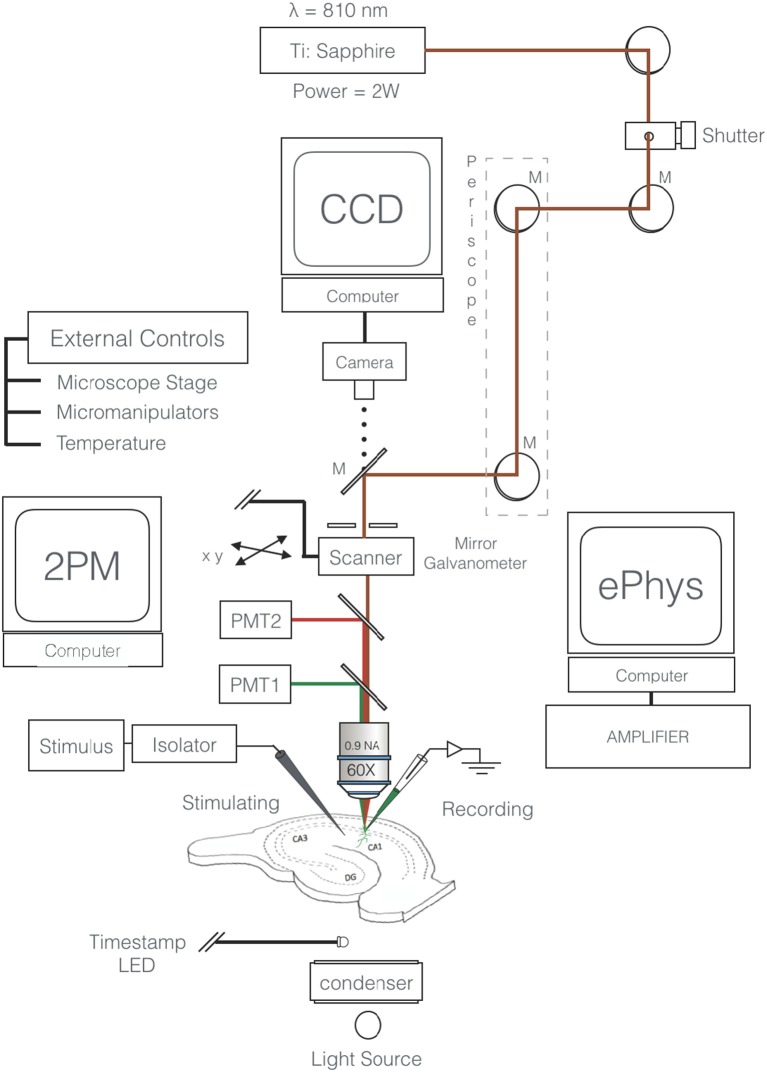
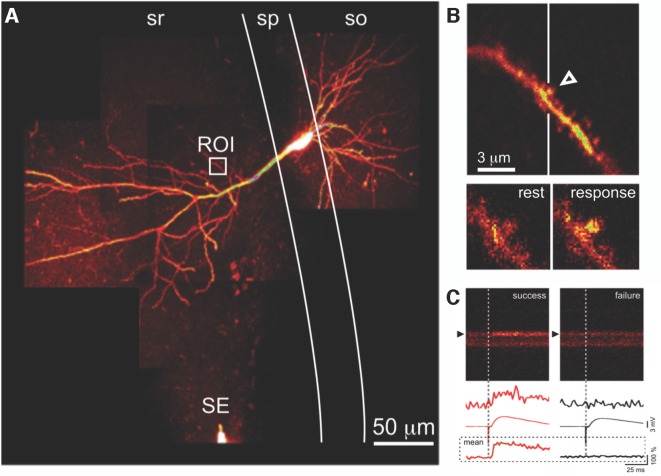
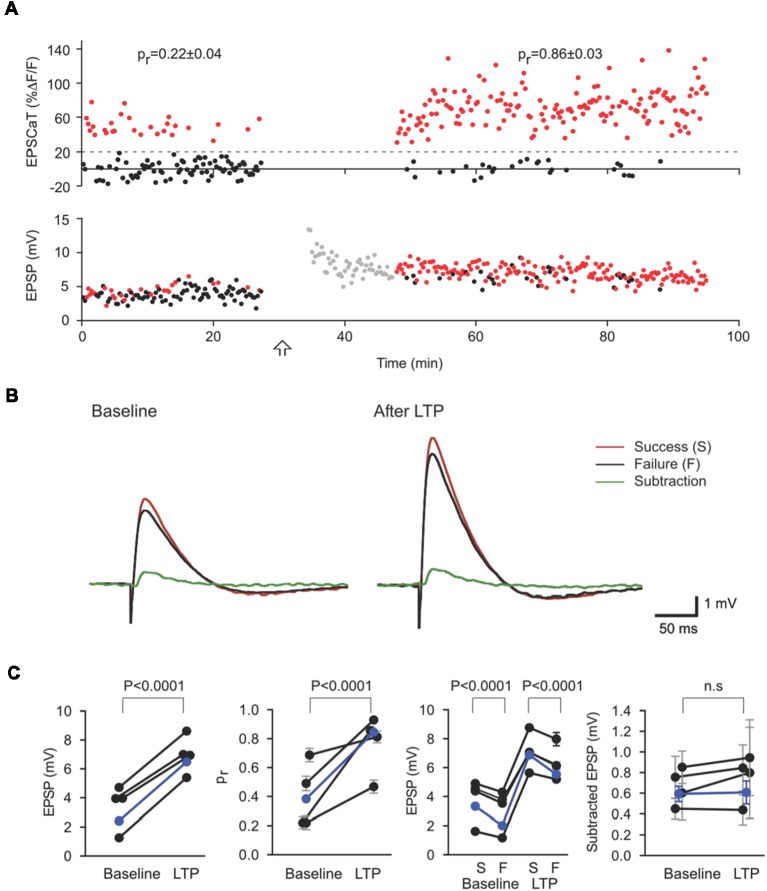
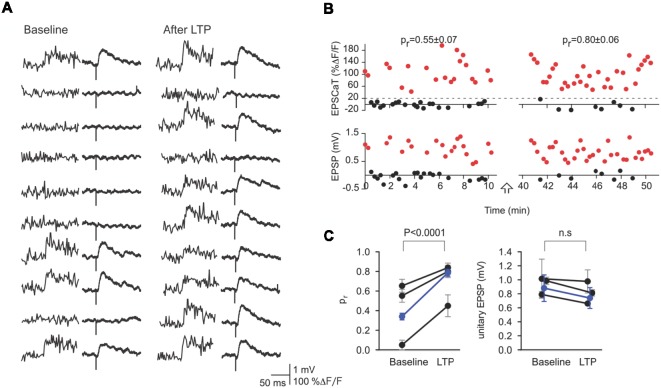
Understanding the mechanisms by which long-term synaptic plasticity is expressed remains an important objective in neuroscience. From a physiological perspective, the strength of a synapse can be considered a consequence of several parameters including the probability that a presynaptic action potential (AP) evokes the release of neurotransmitter, the mean number of quanta of transmitter released when release is evoked, and the mean amplitude of a postsynaptic response to a single quantum. Various methods have been employed to estimate these quantal parameters from electrophysiological recordings; such "quantal analysis" has been used to support competing accounts of mechanisms of expression of long-term plasticity. Because electrophysiological recordings, even with minimal presynaptic stimulation, can reflect responses arising at multiple synaptic sites, these methods are open to alternative interpretations. By combining intracellular electrical recording with optical detection of transmission at individual synapses, however, it is possible to eliminate such ambiguity. Here, we describe methods for such combined optical and electrical monitoring of synaptic transmission in brain slice preparations and illustrate how quantal analyses thereby obtained permit more definitive conclusions about the physiological changes that underlie long-term synaptic plasticity.

Keywords: LTP (long-term potentiation); synaptic plasticity; synaptic potency; synaptic reliability; two photon microscopy.


Figures

Figure 1
Figure 1
Schematic of two-photon excitation microscopy imaging and recording configuration. Excitation beam (red) is focused by a 60×, NA 0.9 objective to a diffraction limited spot that excites the fluorescent intracellular calcium indicator (e.g., Oregon Green 488 BAPTA-1). The target neuron’s membrane potential is constantly monitored through a somatic microelectrode. Excitation of inputs to the cell is achieved via a remote extracellular stimulating electrode (SE). Fluorescence is detected by a photomultiplier tube (PMT). A second fluorophore and secondary detector (PMT2 and dichroic) can be employed depending on the experiment. External control units for the micromanipulators, stage, and temperature are necessary components.
Figure 2
Figure 2
Optical detection of synaptic transmission. (A) CA1 pyramidal neuron, filled with fluorescent Ca2+ indicator. Presynaptic axons are activated by a SE in stratum radiatum (sr); evoked excitatory postsynaptic potentials (EPSPs) are recorded via a somatic microelectrode (not visible). Fluorescence changes due to calcium transients evoked by the same stimulus in an apical dendritic segment (region of interest indicated by the white box) are seen at higher magnification in (B). (B) Evoked postsynaptic calcium transients (EPSCaTs) are restricted to an individual dendritic spine (arrowhead), seen below at higher magnification in video frames at rest (bottom left) and immediately after synaptic activation (bottom right). (C) EPSCaTs monitored via line-scan (x-t) imaging across the spine (black arrowhead) and adjacent dendritic shaft. Successful synaptic transmission (left), visible as a fluorescence increase, can be clearly distinguished from transmission failure (right). EPSPs during transmission failure at this synapse are due to successful transmission at some of the other synapses activated by the same extracellular stimulus. Traces show (top to bottom) single-trial fluorescence from the spine, averaged EPSP, and averaged fluorescence from the spine, during success (red, left) and failure (black, right). sp, stratum pyramidale; so, stratum oriens. Figure adapted from Enoki et al. (2009).
Figure 3
Figure 3
Subtractive analysis of unitary EPSP as an estimate of quantal size. (A) EPSCaT amplitudes (above) and EPSP amplitudes (below) recorded before and after long-term potentiation (LTP) induction. Corresponding EPSP and EPSCaT amplitudes are color-coded on the basis of EPSCaTs, with successes in red and failures in black. (B) Mean EPSP traces corresponding to EPSCaT successes (red) and failures (black). The difference between these averages (Subtraction, green) represents the mean contribution to the EPSP (i.e., the unitary EPSP) from the imaged active synapse. Traces shown are means before (Baseline; left) and 20–60 min after (right) LTP induction. LTP results in large increases in the overall mean EPSP and pr at the imaged synapse. The unitary EPSP amplitude from this imaged synapse, however, does not significantly change. (C) Values of compound EPSP, pr, EPSPs grouped according to success (S) or failure (F), and unitary EPSP amplitude from the imaged synapse. As revealed by such subtractive analysis, LTP induction in these experiments led to significant and corresponding increases in pr at the imaged synapse and in the (multi-synaptic) EPSP, with no significant change in the unitary EPSP from the imaged synapse. Figure adapted from Enoki et al. (2009).
Figure 4
Figure 4
Minimal stimulation and optical quantal analysis. (A) Representative sequential traces showing the perfect correspondence between success or failure of EPSCaTs (left) and EPSPs (right) before (Baseline) and After LTP. This constant correspondence provides strong evidence that the stimulus in this experiment activated only the imaged synapse and that EPSCaTs are reliable reporters of transmitter release. (B) EPSCaT (above) and EPSP amplitudes (below) recorded from this synapse before and after LTP induction. LTP induction increased pr but not the unitary EPSP amplitude. (C) Values of pr (left) and unitary EPSP (right) from the imaged synapse for this and two other experiments (black) are shown before and after LTP (weighted means shown in blue). Such optically confirmed minimal stimulation demonstrates that LTP induction leads to significant increases in pr, with no significant change in unitary EPSP amplitude. Figure adapted from Enoki et al. (2009).

References

    1. Aitken P. G., Breese G. R., Dudek F. F., Edwards F., Espanol M. T., Larkman P. M., et al. . (1995). Preparative methods for brain slices: a discussion. J. Neurosci. Methods 59, 139–149. 10.1016/0165-0270(94)00204-t - DOI - PubMed
    1. Akerboom J., Calderon Carreras N., Tian L., Wabnig S., Prigge M., Tolo J., et al. . (2013). Genetically encoded calcium indicators for multi-color neural activity imaging and combination with optogenetics. Front. Mol. Neurosci. 6:2. 10.3389/fnmol.2013.00002 - DOI - PMC - PubMed
    1. Andermann M. L., Gilfoy N. B., Goldey G. J., Sachdev R. N., Wolfel M., McCormick D. A., et al. . (2013). Chronic cellular imaging of entire cortical columns in awake mice using microprisms. Neuron 80, 900–913. 10.1016/j.neuron.2013.07.052 - DOI - PMC - PubMed
    1. Bear M. F., Abraham W. C. (1996). Long-term depression in hippocampus. Annu. Rev. Neurosci. 19, 437–462. 10.1146/annurev.neuro.19.1.437 - DOI - PubMed
    1. Bekkers J. M., Stevens C. F. (1990). Presynaptic mechanism for long-term potentiation in the hippocampus. Nature 346, 724–729. 10.1038/346724a0 - DOI - PubMed

LinkOut - more resources