. 2019 Mar 27:10:200.
doi: 10.3389/fphar.2019.00200. eCollection 2019.

The Coincidence Between Increasing Age, Immunosuppression, and the Incidence of Patients With Glioblastoma

Affiliations

The Coincidence Between Increasing Age, Immunosuppression, and the Incidence of Patients With Glioblastoma

Erik Ladomersky et al. Front Pharmacol. .

Abstract

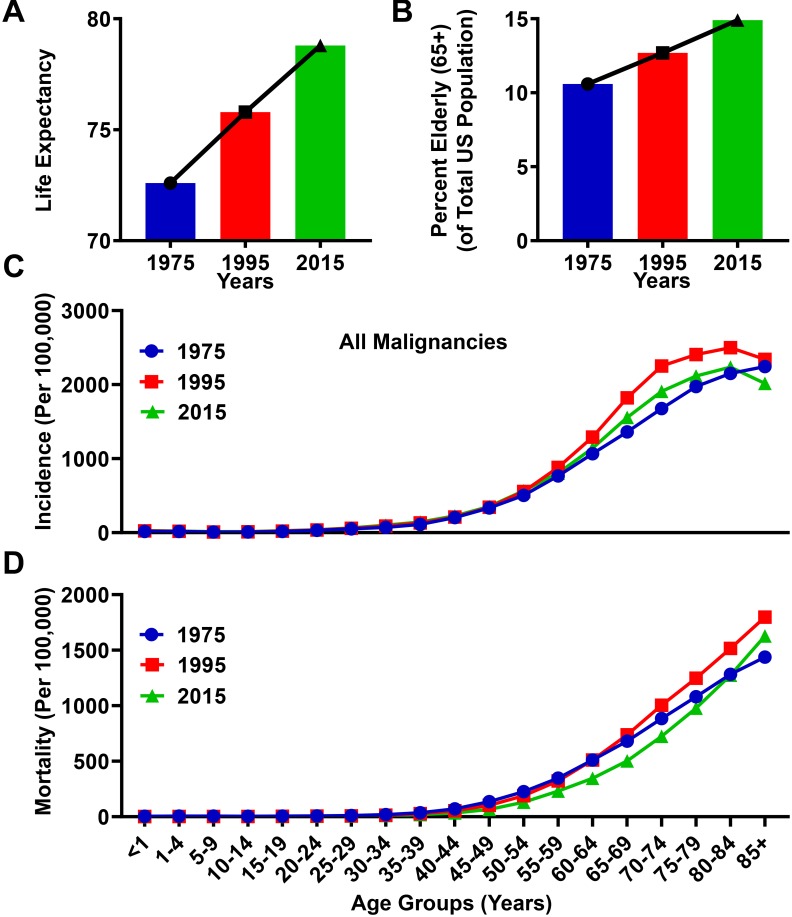
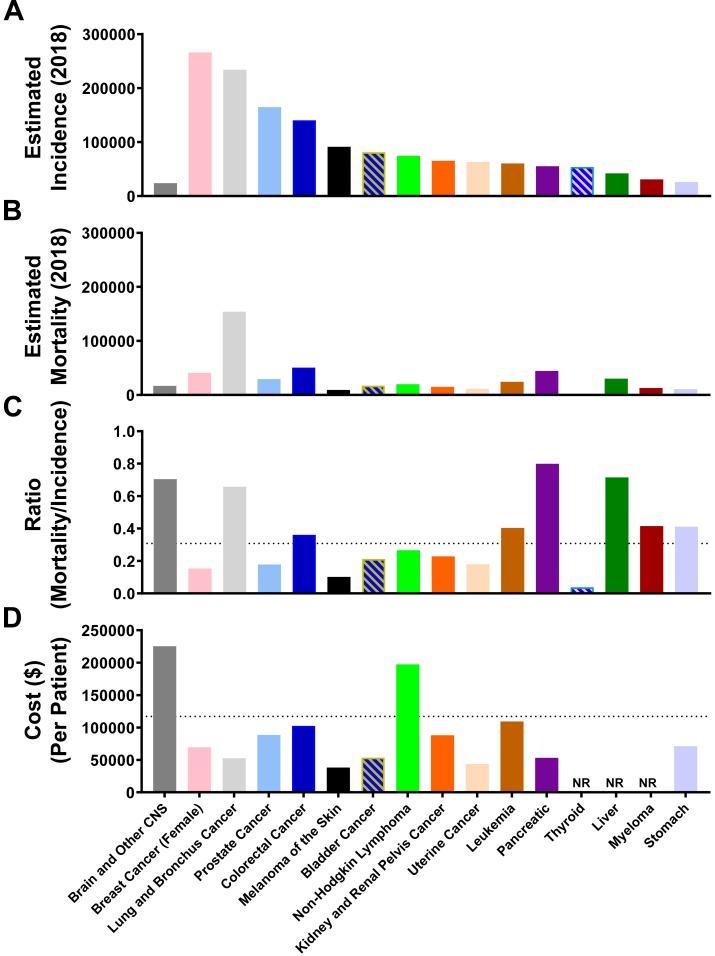
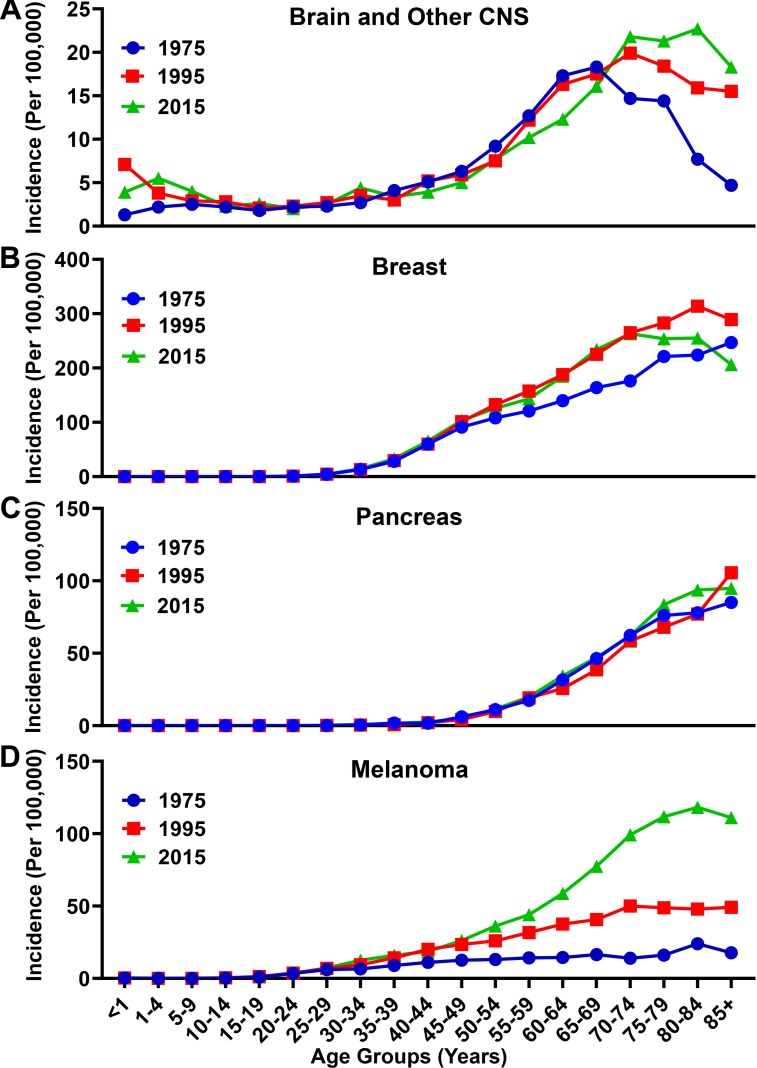
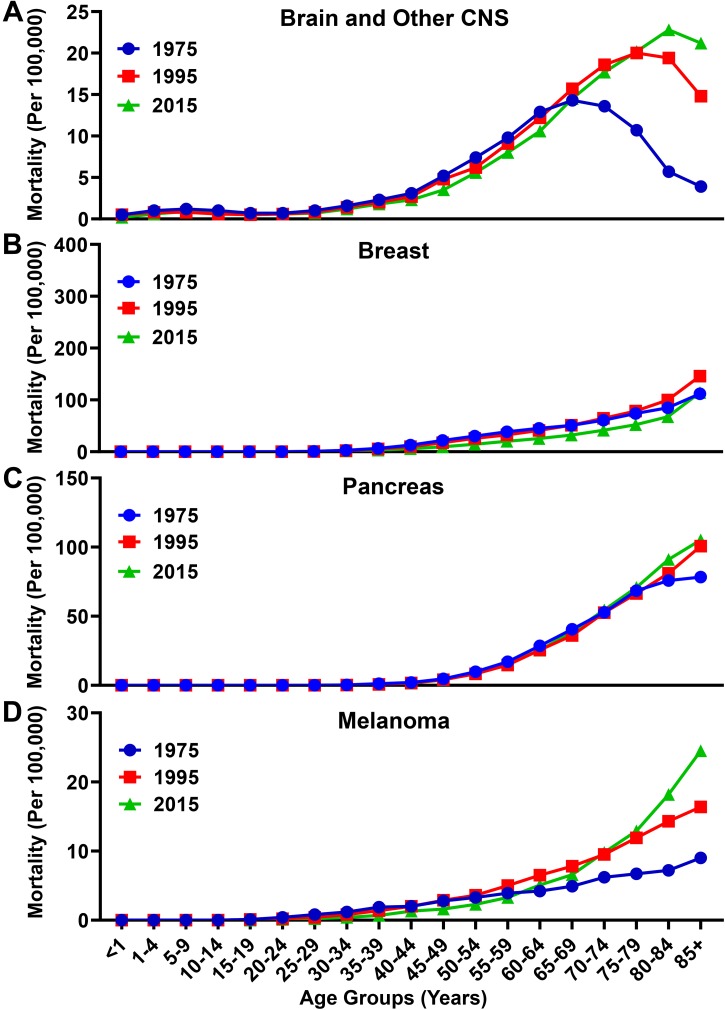
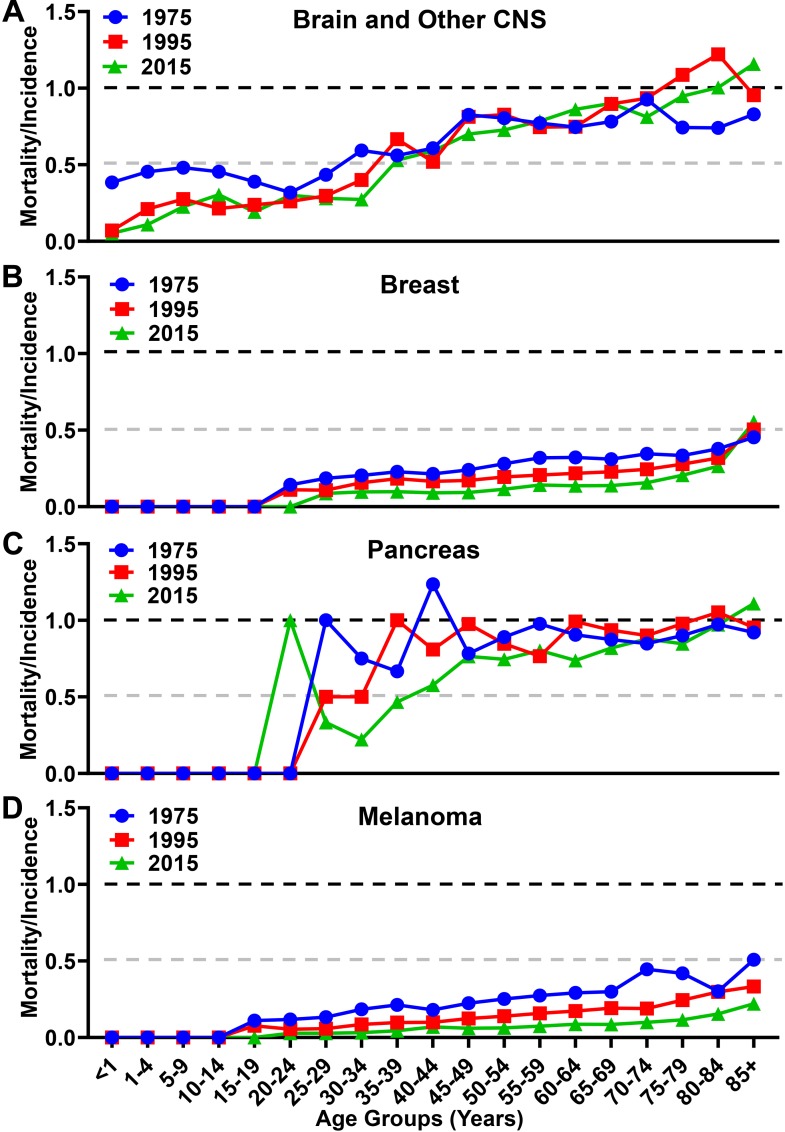
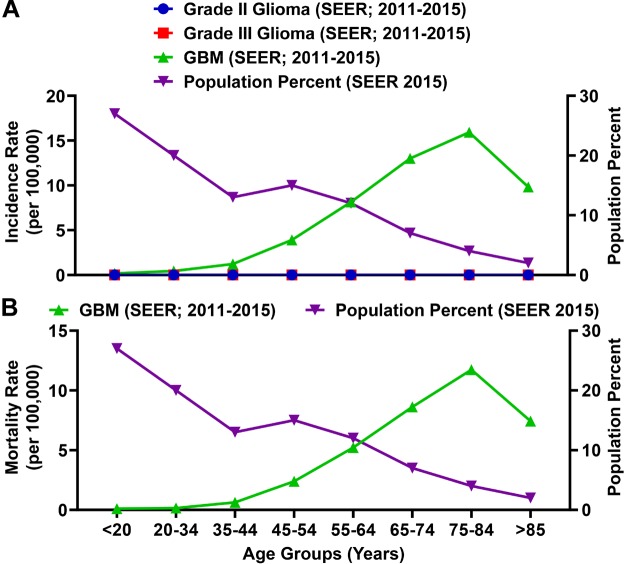
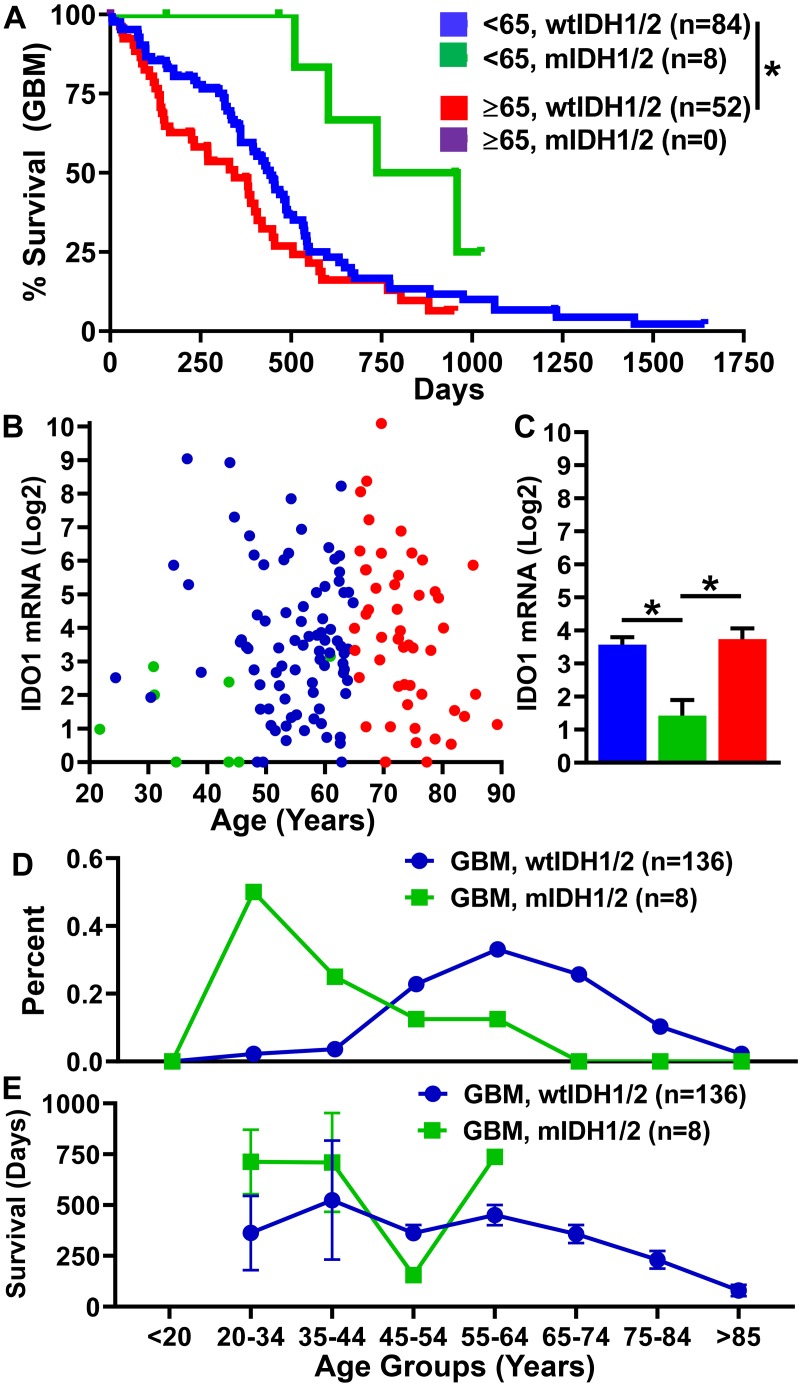
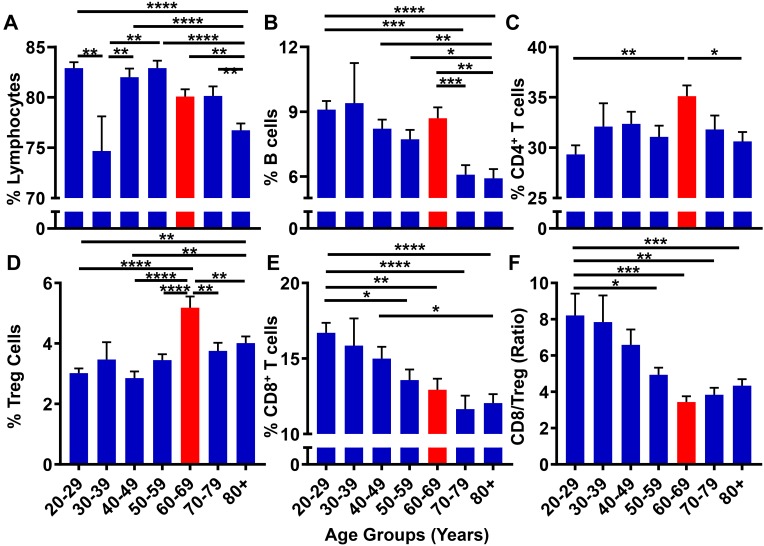
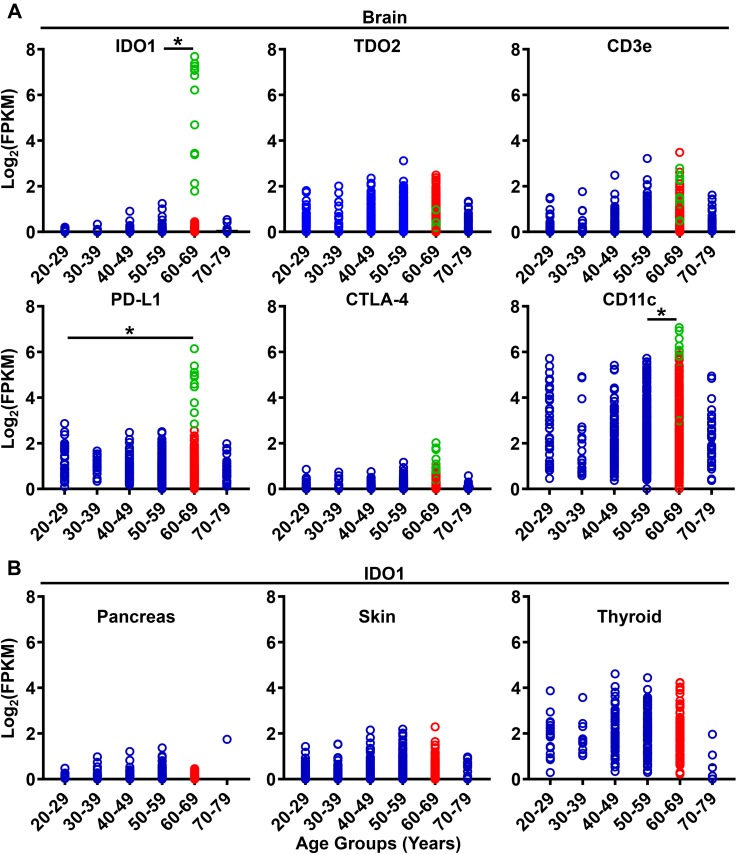
Background: Glioblastoma (GBM) is the most aggressive primary brain tumor in adults and is associated with a median overall survival (mOS) of 16-21 months. Our previous work found a negative association between advanced aging and the survival benefit after treatment with immunotherapy in an experimental brain tumor model. Given the recent phase III clinical success of immunotherapy in patients with many types of cancer, but not for patients with GBM, we hypothesize that aging enhances immunosuppression in the brain and contributes to the lack of efficacy for immunotherapy to improve mOS in patients with malignant glioma. Herein, we compare epidemiological data for the incidence and mortality of patients with central nervous system (CNS) cancers, in addition to immune-related gene expression in the normal human brain, as well as peripheral blood immunological changes across the adult lifespan. Methods: Data were extracted from the National Cancer Institute's surveillance, epidemiology, and end results (SEER)-, the Broad Institute's Genotype Tissue Expression project (GTEx)-, and the University of California San Francisco's 10k Immunomes-databases and analyzed for associations with aging. Results: The proportion of elderly individuals, defined as ≥65 years of age, has predominantly increased for more than 100 years in the United States. Over time, the rise in elderly United States citizens has correlated with an increased incidence and mortality rate associated with primary brain and other CNS cancer. With advanced aging, human mRNA expression for factors associated with immunoregulation including immunosuppressive indoleamine 2,3 dioxygenase 1 (IDO) and programmed death-ligand 1 (PD-L1), as well as the dendritic cell surface marker, CD11c, increase in the brain of normal human subjects, coincident with increased circulating immunosuppressive Tregs and decreased cytolytic CD8+ T cells in the peripheral blood. Strikingly, these changes are maximally pronounced in the 60-69 year old group; consistent with the median age of a diagnosis for GBM. Conclusion: These data demonstrate a significant association between normal human aging and increased immunosuppression in the circulation and CNS; particularly late in life. Our data raise several hypotheses including that, aging: (i) progressively suppresses normal immunosurveillance and thereby contributes to GBM cell initiation and/or outgrowth; (ii) decreases immunotherapeutic efficacy against malignant glioma.

Keywords: IDH; IDO; PD-L1; Treg; aging; biomarker; immunosuppression; immunotherapy.


Figures

FIGURE 1
FIGURE 1
Progressive aging is associated with an increased rate of cancer incidence and mortality. (A) Life expectancy from the Center for Disease Control and Prevention (CDC) database for an average lifespan in the United States between the years 1975 and 2015. (B) Population data from the Surveillance, Epidemiology, and Ends Results (SEER) database representing the total number of elderly human subjects (ages ≥65) divided by the total population in the United States for the years 1975, 1995, and 2015. (C) Incidence and (D) mortality rates from the SEER database for all malignancies in the years 1975, 1995, and 2015. Rates are defined as number of cases and deaths, respectively, divided by the population in each age category and multiplied by 100,000 people (per 100,000).
FIGURE 2
FIGURE 2
Brain and other CNS cancer is associated with a high mortality/incidence ratio and is expensive to treat. The estimated total (A) incidence and (B) mortality rate for the top 16 cancer types according to NCI Cancer Stat Facts. (C) The calculated mortality to incidence ratio (estimated mortality/estimated incidence) for the top 16 cancer sites according to NCI Cancer Stat Facts. The dotted line represents an average across all 16 cancer types. (D) Cost (United States dollars) per patient for each of the top 16 cancer types. Dotted line represents the average for all 16 cancer types. NR, Not reported.
FIGURE 3
FIGURE 3
Incidence rate for brain, breast, pancreatic, and melanoma malignancies over time. Incidence rates for (A) brain and other CNS, (B) breast, (C) pancreatic, and (D) melanoma malignancies analyzed from the SEER database for the years 1975, 1995, and 2015. Rates defined as number of cases divided by the population in each age category multiplied by 100,000 people (per 100,000).
FIGURE 4
FIGURE 4
Mortality rate for brain, breast, pancreatic, and melanoma malignancies over time. Mortality rates for (A) brain and other CNS, (B) breast, (C) pancreatic, and (D) melanoma malignancies analyzed from the SEER database for the years 1975, 1995, and 2015. Rates defined as number of deaths divided by the population in each age category multiplied by 100,000 people (per 100,000).
FIGURE 5
FIGURE 5
Mortality to incidence ratio for brain, breast, pancreatic, and melanoma malignancies over time. The calculated mortality to incidence ratio of (A) brain and other CNS, (B) breast, (C) pancreatic, and (D) melanoma malignancies for each year calculated from SEER incidence and mortality data. Instances where the ratio is over 1.0 are due to the lag time between diagnosis and mortality in GBM and pancreatic cancer.
FIGURE 6
FIGURE 6
The incidence and mortality rates for glioblastoma (GBM) patients are enriched among the elderly population. (A) SEER incidence rates (per 100,000) for grade II glioma, grade III glioma, and GBM (grade IV glioma; all left axis) compared to the percent of the total population represented for each age group. Grade II and III glioma incidence rates calculated by SEER were >0.015 (per 100,000) for each age category. (B) The SEER mortality rate for GBM as compared to the percent of the total population represented for each age group. Incidence and mortality data is represented as a summation for the years 2011–2015.
FIGURE 7
FIGURE 7
Prognosis is worse for individuals with GBM ≥65. Analysis of GBM data for individuals with corresponding patient data, gene expression (HiSeq) data, and a reported mIDH1/2 status from the TCGA. (A) Survival data of individuals with wild-type IDH1/2 <65 (n = 84), ≥65 (n = 52), and those with mIDH1/2 (n = 8). IDO1 gene expression (B) dot plot and (C) bar graph of individuals with wild-type IDH1/2 <65 (blue), ≥65 (red), and those with mIDH1/2 (green). (D) The percentage of GBM diagnoses within each age category for individuals with wtIDH1/2 (blue) and mIDH1/2 (green). (E) Survival time in days of individuals diagnosed in each age category. P < 0.05.
FIGURE 8
FIGURE 8
The peripheral blood CD8+ T/Treg ratio decreases with progressive aging in healthy human subjects. 10k immunomes CyTOF data from the peripheral blood of healthy patients analyzed for (A) total lymphocytes, (B) B cells, (C) CD4+ T cells, (D) CD8+ T cells, (E) Tregs (CD4+CD25+FoxP3+), and (F) CD8+ T/Treg ratio. Data was analyzed among age groups including 20–29 (n = 110), 30–39 (n = 14), 40–49 (n = 76), 50–59 (n = 78), 60–69 (n = 72), 70–79 (n = 57), 80+ (n = 127). P < 0.05; ∗∗P < 0.01; ∗∗∗P < 0.001; ∗∗∗∗P < 0.0001.
FIGURE 9
FIGURE 9
Gene expression for immunosuppressive and immunoregulatory factors increase in the normal human brain with aging. (A) GTEx gene expression analysis of IDO1, TDO2, CD3ε, PD-L1, CTLA-4, and CD11c in the brain. Data was analyzed among age groups including 20–29 (n = 38), 30–39 (n = 19), 40–49 (n = 123), 50–59 (n = 386), 60–69 (n = 549), 70–79 (n = 37). Green circles across gene panels share the same sample IDs. (B) GTEx gene expression analysis of IDO1 in the normal human pancreas (n = 167), skin (n = 812), and thyroid (n = 280). P < 0.05.

References

    1. Adachi K., Davis M. M. (2011). T-cell receptor ligation induces distinct signaling pathways in naive vs. antigen-experienced T cells. Proc. Natl. Acad. Sci. U.S.A. 108 1549–1554. 10.1073/pnas.1017340108 - DOI - PMC - PubMed
    1. Antonia S. J., Lopez Martin J. A., Bendell J., Ott P. A., Taylor M., Eder J. P., et al. (2016). Nivolumab alone and nivolumab plus ipilimumab in recurrent small-cell lung cancer (CheckMate 032): a multicentre, open-label, phase 1/2 trial. Lancet Oncol. 17 883–895. 10.1016/S1470-2045(16)30098-5 - DOI - PubMed
    1. Aprahamian T., Takemura Y., Goukassian D., Walsh K. (2008). Ageing is associated with diminished apoptotic cell clearance in vivo. Clin. Exp. Immunol. 152 448–455. 10.1111/j.1365-2249.2008.03658.x - DOI - PMC - PubMed
    1. Beatty G. L., Gladney W. L. (2015). Immune escape mechanisms as a guide for cancer immunotherapy. Clin. Cancer Res. 21 687–692. 10.1158/1078-0432.CCR-14-1860 - DOI - PMC - PubMed
    1. Berger N. A., Savvides P., Koroukian S. M., Kahana E. F., Deimling G. T., Rose J. H., et al. (2006). Cancer in the elderly. Trans. Am. Clin. Climatol. Assoc. 117 147–55; discussion 155–156. - PMC - PubMed