. 2019 Mar 27:10:303.
doi: 10.3389/fphar.2019.00303. eCollection 2019.

Transcriptome-Wide Effects of Sphingosine Kinases Knockdown in Metastatic Prostate and Breast Cancer Cells: Implications for Therapeutic Targeting

Affiliations

Transcriptome-Wide Effects of Sphingosine Kinases Knockdown in Metastatic Prostate and Breast Cancer Cells: Implications for Therapeutic Targeting

Heba Alshaker et al. Front Pharmacol. .

Abstract

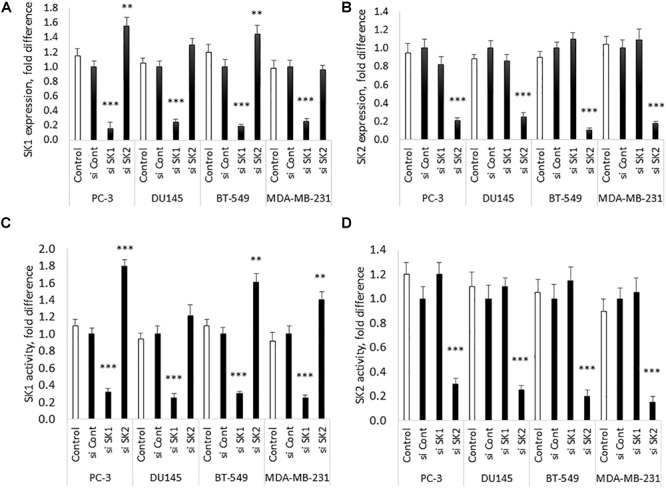
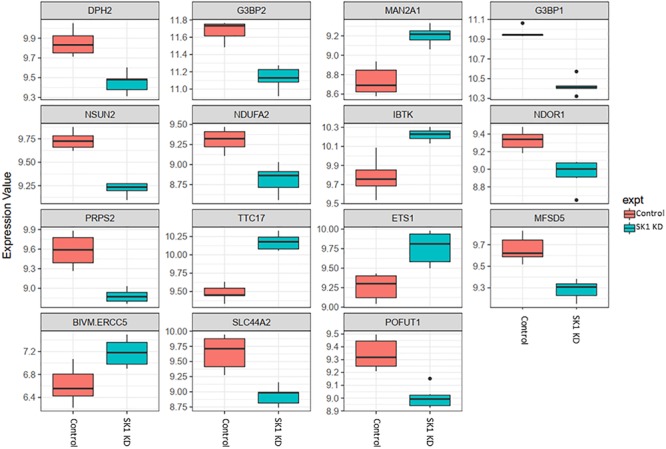
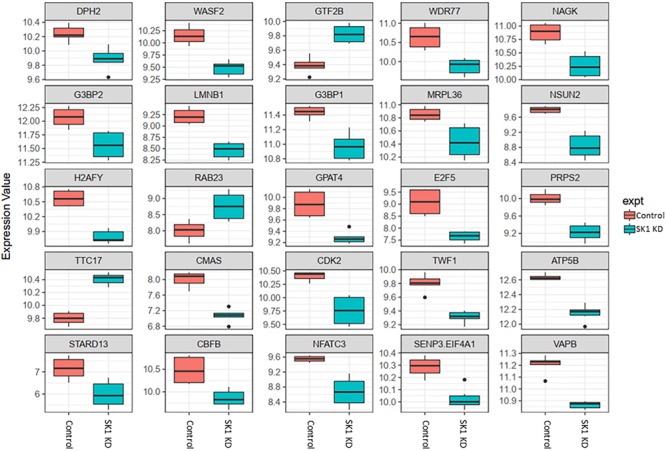
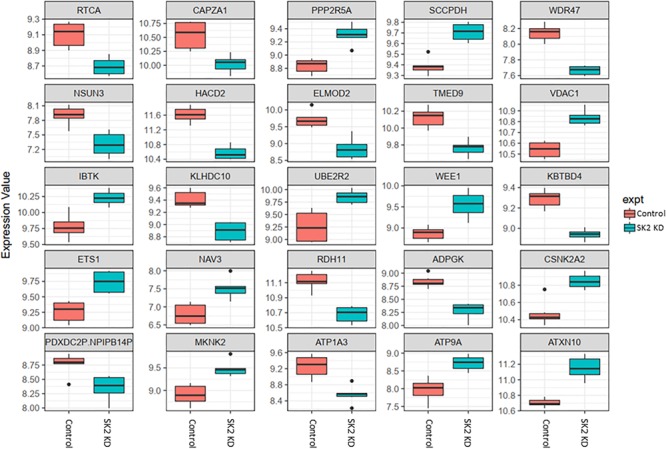
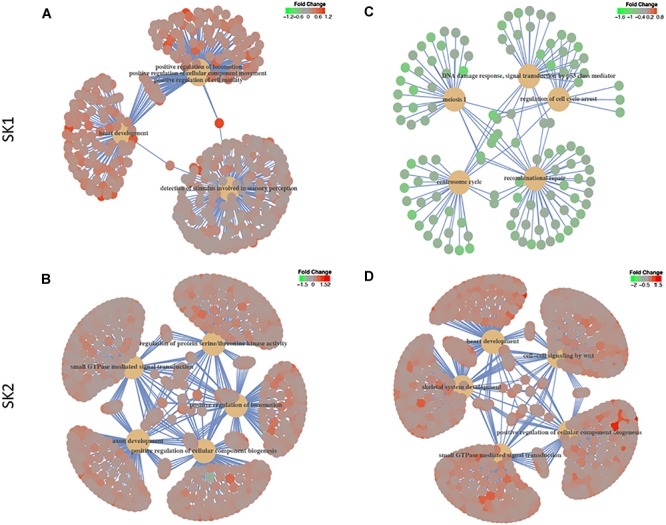
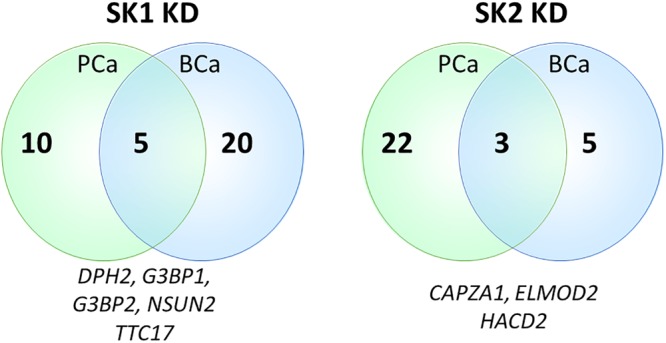
Sphingosine kinases 1 and 2 (SK1 and SK2) are proto-oncogenic isozymes expressed in many human tumors and associated with chemoresistance and poor prognosis. They are well-recognized therapy targets and their inhibition was shown to induce tumor volume reduction and chemosensitization in multiple cancer models. Oncogenic signaling is extremely complex and often cross-regulated. Designing molecular therapies and their combinations requires rational approaches to avoid redundant targeting or developing resistance. In this study, we have performed RNA transcriptome microarray analysis of two breast and two prostate metastatic cancer cell lines treated with siRNAs targeting SK1 or SK2. In prostate cancer cell lines SK1 knockdown (KD) has significantly changed expression of several genes including downregulation of NSUN2, G3BP2 and upregulation of ETS1. SK2 KD also affected expression of multiple genes including downregulation of CAPZA1 NSUN3 and ADPGK and upregulation of VDAC1, IBTK, ETS1, and MKNK2. Similarly, in breast cancer cells SK1 KD led to downregulation of NSUN2, NFATC3, CDK2, and G3BP2 and upregulation of GTF2B, TTC17, and RAB23. SK2 KD in breast cancer cells has decreased expression of ITGAV and CAPZA1 and increased expression of GTF2B and ST13. Gene-set enrichment analysis of known biochemical pathways showed that in prostate and breast cell lines SKs KD have altered multiple pathways. SK1 KD altered chromatin assembly, regulation of G1/S transition and mitosis, Wnt and MAP kinase signaling and cell motility. SK2 KD altered RAS protein signal transduction, regulation of MAP kinase and serine/threonine kinase activity, cell motility, small GTPase mediated signal transduction and phosphatidylinositol 3-kinase (PI3K) signaling. Through genome-wide microarray analysis, we have identified important molecular pathways affected by SK1 and SK2 KD. It appears that while KD of both genes leads to a decrease in individual pro-tumorigenic genes, there is a universal cellular response resulting in upregulation of several known pro-survival and pro-tumorigenic pathways such as MAPK, RAS, and PI3K, which may mediate cancer resistance to anti-SKs therapies. Our data point out to the potential advantage of certain molecular therapy combinations in targeting prostate and breast cancer. Further signaling studies are required to confirm the individual involvement of identified pathways.

Keywords: DNA microarray; breast cancer; gene knockdown; molecular targets; prostate cancer; sphingosine kinase; targeted therapy; transcriptome.


Figures

FIGURE 1
FIGURE 1
SK1/SK2 knockdown in prostate and breast cancer cell lines. Human breast cancer cell lines MDA-MB-231 and BT-549 and human prostate cancer cells lines PC-3 and DU145 were transfected with SK1 and SK2 siRNA and gene knockdown was assessed by qRT-PCR (A,B). SK1 and SK2 activity was assessed using radiolabeling assay (C,D). Data mean values of at least three independent experiments normalized to control ± SEM. ∗∗p < 0.01, ∗∗∗p < 0.001.
FIGURE 2
FIGURE 2
Altered gene expression in response to SK1 knockdown (KD) in prostate cancer cell lines. Human prostate cancer cells lines PC-3 and DU145 were transfected with SK1 siRNA and Affymetrix Clariom S human array was performed as described in materials and methods. Differential expression analysis was performed using the limma version 3.34.4: linear models were determined for each transcript cluster (gene) and an estimate for the global variance calculated by an empirical Bayes approach. A moderated t-statistic was computed for each transcript cluster with the resulting p-values adjusted for multiple testing using Benjamini and Hochberg’s method to control the false discovery rate. Those transcript clusters with an adjusted p-value less than 0.05 were considered to be significantly differentially expressed between the two groups; bars, SEM.
FIGURE 3
FIGURE 3
Altered gene expression in response to SK1 knockdown (KD) in breast cancer cell lines. Human breast cancer cell lines MDA-MB-231 and BT-549 were transfected with SK1 siRNA and Affymetrix Clariom S human array was performed as described in materials and methods. Differential expression analysis was performed using the limma version 3.34.4: linear models were determined for each transcript cluster (gene) and an estimate for the global variance calculated by an empirical Bayes approach. A moderated t-statistic was computed for each transcript cluster with the resulting p-values adjusted for multiple testing using Benjamini and Hochberg’s method to control the false discovery rate. Those transcript clusters with an adjusted p-value less than 0.05 were considered to be significantly differentially expressed between the two groups; bars, SEM.
FIGURE 4
FIGURE 4
Altered gene expression in response to SK2 knockdown (KD) in prostate cancer cell lines. Human prostate cancer cells lines PC-3 and DU145 were transfected with SK2 siRNA and Affymetrix Clariom S human array was performed as described in materials and methods. Differential expression analysis was performed using the limma version 3.34.4: linear models were determined for each transcript cluster (gene) and an estimate for the global variance calculated by an empirical Bayes approach. A moderated t-statistic was computed for each transcript cluster with the resulting p-values adjusted for multiple testing using Benjamini and Hochberg’s method to control the false discovery rate. Those transcript clusters with an adjusted p-value less than 0.05 were considered to be significantly differentially expressed between the two groups; bars, SEM.
FIGURE 5
FIGURE 5
Altered gene expression in response to SK2 knockdown (KD) in breast cancer cell lines. Human breast cancer cell lines MDA-MB-231 and BT-549 were transfected with SK2 siRNA and Affymetrix Clariom S human array was performed as described in materials and methods. Differential expression analysis was performed using the limma version 3.34.4: linear models were determined for each transcript cluster (gene) and an estimate for the global variance calculated by an empirical Bayes approach. A moderated t-statistic was computed for each transcript cluster with the resulting p-values adjusted for multiple testing using Benjamini and Hochberg’s method to control the false discovery rate. Those transcript clusters with an adjusted p-value less than 0.05 were considered to be significantly differentially expressed between the two groups; bars, SEM.
FIGURE 6
FIGURE 6
Gene-set enrichment analysis of gene ontology biological process enrichment pathways. Human prostate cancer cells lines PC-3 and DU145 (A,B) and human breast cancer cell lines MDA-MB-231 and BT-549 (C,D) were transfected with SK1 (A,C) and SK2 (B,D) siRNA and Affymetrix Clariom S human array was performed as described in materials and methods. Gene ontology biological process and hallmarks of cancer gene sets were tested in gene set enrichment analysis using the clusterProfiler package, version 3.6. The t-statistic generated in the differential expression analyses was used as the metric, with all Entrez Genes as the background and a cut-off p-value of 0.05 after multiple testing using the false discovery rate.
FIGURE 7
FIGURE 7
Venn diagram of genes regulated by SK1/SK2 knockdown (KD) in prostate and breast cell lines. Human breast cancer cell lines MDA-MB-231 and BT-549 and prostate cancer cells lines PC-3 and DU145 were transfected with SK1 or SK2 siRNA and Affymetrix Clariom S human array was performed as described in materials and methods. Numbers of significantly regulated genes common to prostate or breast cell lines are shown in outer semicircles and the number of genes universally regulated by SK1 or SK2 KD in all cell lines is shown in the middle. These universal genes are listed below the circles.

References

    1. Alshaker H., Krell J., Frampton A. E., Waxman J., Blyuss O., Zaikin A., et al. (2014). Leptin induces upregulation of sphingosine kinase 1 in oestrogen receptor-negative breast cancer via Src family kinase-mediated, janus kinase 2-independent pathway. Breast Cancer Res. 16:426. 10.1186/s13058-014-0426-6 - DOI - PMC - PubMed
    1. Alshaker H., Sauer L., Monteil D., Ottaviani S., Srivats S., Bohler T., et al. (2013). Therapeutic potential of targeting SK1 in human cancers. Adv. Cancer Res. 117 143–200. 10.1016/B978-0-12-394274-6.00006-6 - DOI - PubMed
    1. Alshaker H., Srivats S., Monteil D., Wang Q., Low C. M. R., Pchejetski D. (2018). Field template-based design and biological evaluation of new sphingosine kinase 1 inhibitors. Breast Cancer Res. Treat. 172 33–43. 10.1007/s10549-018-4900-1 - DOI - PMC - PubMed
    1. Alshaker H., Wang Q., Frampton A. E., Krell J., Waxman J., Winkler M., et al. (2015). Sphingosine kinase 1 contributes to leptin-induced STAT3 phosphorylation through IL-6/gp130 transactivation in oestrogen receptor-negative breast cancer. Breast Cancer Res. Treat. 149 59–67. 10.1007/s10549-014-3228-8 - DOI - PubMed
    1. Alshaker H., Wang Q., Srivats S., Chao Y., Cooper C., Pchejetski D. (2017). New FTY720-docetaxel nanoparticle therapy overcomes FTY720-induced lymphopenia and inhibits metastatic breast tumour growth. Breast Cancer Res. Treat. 165 531–543. 10.1007/s10549-017-4380-8 - DOI - PMC - PubMed