. 2019 Mar 26:10:313.
doi: 10.3389/fphys.2019.00313. eCollection 2019.

Skeletal Muscle Fiber Size and Gene Expression in the Oldest-Old With Differing Degrees of Mobility

Affiliations

Skeletal Muscle Fiber Size and Gene Expression in the Oldest-Old With Differing Degrees of Mobility

Fabio Naro et al. Front Physiol. .

Erratum in

Abstract

The oldest-old, in the ninth and tenth decades of their life, represent a population characterized by neuromuscular impairment, which often implies a loss of mobility and independence. As recently documented by us and others, muscle atrophy and weakness are accompanied by an unexpected preservation of the size and contractile function of skeletal muscle fibers. This suggests that, while most fibers are likely lost with their respective motoneurons, the surviving fibers are well preserved. Here, we investigated the mechanisms behind this fiber preservation and the relevance of physical activity, by comparing a group of 6 young healthy controls (YG: 22-28 years) with two groups of oldest-old (81-96 years), one able to walk (OW: n = 6, average 86 years) and one confined to a wheelchair (ONW n = 9, average 88 years). We confirmed previous results of fiber preservation and, additionally, observed a shift in fiber type, toward slow predominance in OW and fast predominance in ONW. Myonuclear density was increased in muscles of ONW, compared to YG and OW, potentially indicative of an ongoing atrophy process. We analyzed, by RT-qPCR, the expression of genes relevant for fiber size and type regulation in a biopsy sample from the vastus lateralis. In all oldest-old both myostatin and IGF-1 expression were attenuated compared to YG, however, in ONW two specific IGF-1 isoforms, IGF-1EA and MGF, demonstrated a further significant decrease compared to OW. Surprisingly, atrogenes (MURF1 and atrogin) expression was also significantly reduced compared to YG and this was accompanied by a close to statistically significantly attenuated marker of autophagy, LC3. Among the determinants of the metabolic fiber type, PGC1α was significantly reduced in both OW and ONW compared to YG, while AMPK was down-regulated only in ONW. We conclude that, in contrast to the shift of the balance in favor of pro-atrophy factors found by other studies in older adults (decreased IGF-1, increase of myostatin, increase of atrogenes), in the oldest-old the pro-atrophy factors also appear to be down-regulated, allowing a partial recovery of the proteostasis balance. Furthermore, the impact of muscle activity, as a consequence of lost or preserved walking ability, is limited.

Keywords: aging; gene expression; muscle atrophy; myonuclei; oldest-old; physical activity; single muscle fibers.


Figures
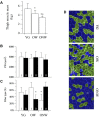
FIGURE 1
FIGURE 1
Variations in thigh muscle mass, fiber cross sectional area and fiber type distribution in vastus lateralis of young (YG), walking oldest-old (OW), and non-walking oldest-old (ONW). (A) Thigh muscle mass, determined with DEXA, documents the significantly lower values in OM and OI compared to YG and even lower values in ONW compared to OW (YG n = 8, OW n = 6, and ONW n = 9). (B) Single muscle fiber cross sectional area was not different between the three groups. (C) Muscle fiber types, determined with anti-myosin antibodies, documents a significant difference in OW and ONW compared to YG. (D) Examples of sections of biopsy samples stained with anti-slow myosin antibody (green) and anti-fast myosin antibody (blue). Data in panels A–C are presented as mean ± S.E.; Significantly different from YG subjects; Significantly different from OW subjects.
FIGURE 2
FIGURE 2
Electrically evoked twitch in young (YG), walking oldest-old (OW), and non-walking oldest-old (ONW). Examples of twitch recorded in leg extensor muscles after single pulse stimulation are illustrated. Protocol of stimulation and torque recording are described in Section “Materials and Methods.” Values of the time and torque parameters are reported for the three groups in Table 3.
FIGURE 3
FIGURE 3
Myonuclear density and myonuclear domain size determined in single muscle fibers from young (YG), walking oldest-old (OW), and non-walking oldest-old (ONW). (A–C) typical examples of segment of single fibers stained for nuclear visualization: YG (A), OW (B) and ONW (C), (D) longitudinal density expressed as number of nuclei per mm of fiber, (E) nuclear density, expressed as number of myonuclei per million of cubic micrometers, (F) nuclear domain size expressed in cubic micrometers. Data are presented as mean ± S.E.; Significantly different from YG.
FIGURE 4
FIGURE 4
Real time PCR of genes coding for factors affecting muscle growth in young (YG), walking oldest-old (OW), and non-walking oldest-old (ONW). (A) IGF-1, (B) IGF-1EA, (C) MGF or IGF-1EC, (D) Myostatin, (E) GDF-11. The mRNA levels of the indicated genes were determined by RT-qPCR on muscle obtained by biopsies from YG, OW, and ONW. mRNA levels are expressed as fold change compared to the levels in the vastus lateralis samples of the young (YG n = 8; OW n = 6 ONW n = 9). Data are presented as mean ± S.E.; Significantly different from YG subjects; Significantly different from OM subjects.
FIGURE 5
FIGURE 5
Real time PCR of genes coding for factors involved in protein synthesis in young (YG), walking oldest-old (OW), and non-walking oldest-old (ONW). (A) AKT1, (B) AKT2, (C) mTOR. The mRNA levels of the indicated genes were determined by RT-qPCR on muscle obtained by biopsies from YG, OW, and ONW. mRNA levels are expressed as fold change compared to the levels in the vastus lateralis samples of the young (YG n = 8; OW n = 6 ONW n = 9). Data are presented as mean ± S.E.; Significantly different from YG subjects.
FIGURE 6
FIGURE 6
Real Time PCR of genes coding for factors involved in protein degradation in young (YG), walking oldest-old (OW), and non-walking oldest-old (ONW). (A) Atrogin, (B) Murf-1, (C) LC3, (D) Foxo3. The mRNA levels of the indicated genes were determined by RT-qPCR on muscle obtained by biopsies from YG, OW, and ONW. mRNA levels are expressed as fold change compared to the levels in the vastus lateralis samples of the young. (YG n = 8; OW n = 6; ONW n = 9). Data are presented as mean ± S.E.; Significantly different from YG subjects.
FIGURE 7
FIGURE 7
Real time PCR of genes coding for energy sensing factors in young (YG), walking oldest-old (OW), and non-walking oldest-old (ONW). (A) PGC-1α, (B) Sirt-1, (C) AMPKα2. The mRNA levels of the indicated genes were determined by RT-qPCR on muscle obtained by biopsies from YG, OW, and ONW. mRNA levels are expressed as fold change compared to the levels in the vastus lateralis samples of the young (YG n = 8; OW n = 6; ONW n = 9). Data are presented as mean ± S.E.; Significantly different from YG subjects.

References

    1. Aagaard P., Suetta C., Caserotti P., Magnusson S. P., Kjaer M. (2010). Role of the nervous system in sarcopenia and muscle atrophy with aging: strength training as a countermeasure. Scand. J. Med. Sci. Sports 20 49–64. 10.1111/j.1600-0838.2009.01084.x - DOI - PubMed
    1. Anderson R., Prolla T. (2009). PGC-1alpha in aging and anti-aging interventions. Biochim. Biophys. Acta 1790 1059–1066. 10.1016/j.bbagen.2009.04.005 - DOI - PMC - PubMed
    1. Bergen H. R., III, Farr J. N., Vanderboom P. M., Atkinson E. J., White T. A., Singh R. J., et al. (2015). Myostatin as a mediator of sarcopenia versus homeostatic regulator of muscle mass: insights using a new mass spectrometry-based assay. Skelet. Muscle 5:21. 10.1186/s13395-015-0047-45 - DOI - PMC - PubMed
    1. Berlau D. J., Corrada M. M., Kawas C. (2009). The prevalence of disability in the oldest-old is high and continues to increase with age: findings from the 90+ Study. Int. J. Geriatr. Psychiatry 24 1217–1225. 10.1002/gps.2248 - DOI - PMC - PubMed
    1. Blaauw B., Schiaffino S., Reggiani C. (2013). Mechanisms modulating skeletal muscle phenotype. Compr. Physiol. 3 1645–1687. 10.1002/cphy.c130009 - DOI - PubMed