

Phenotypic Responses to a Lifestyle Intervention Do Not Account for Inter-Individual Variability in Glucose Tolerance for Individuals at High Risk of Type 2 Diabetes
- PMID: 30971951
- PMCID: PMC6443958
- DOI: 10.3389/fphys.2019.00317
Phenotypic Responses to a Lifestyle Intervention Do Not Account for Inter-Individual Variability in Glucose Tolerance for Individuals at High Risk of Type 2 Diabetes
Abstract
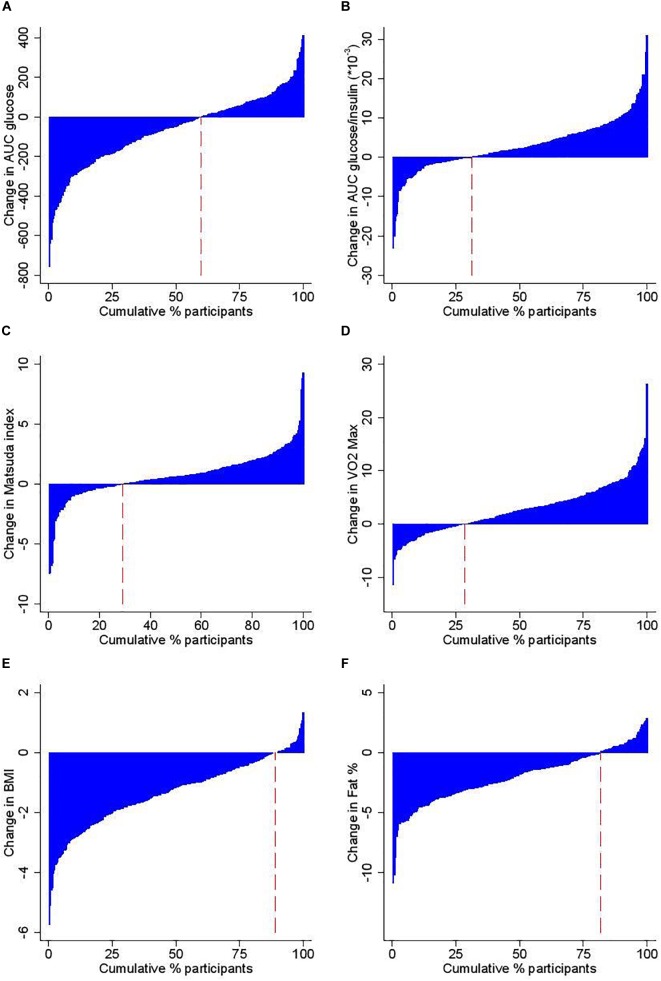
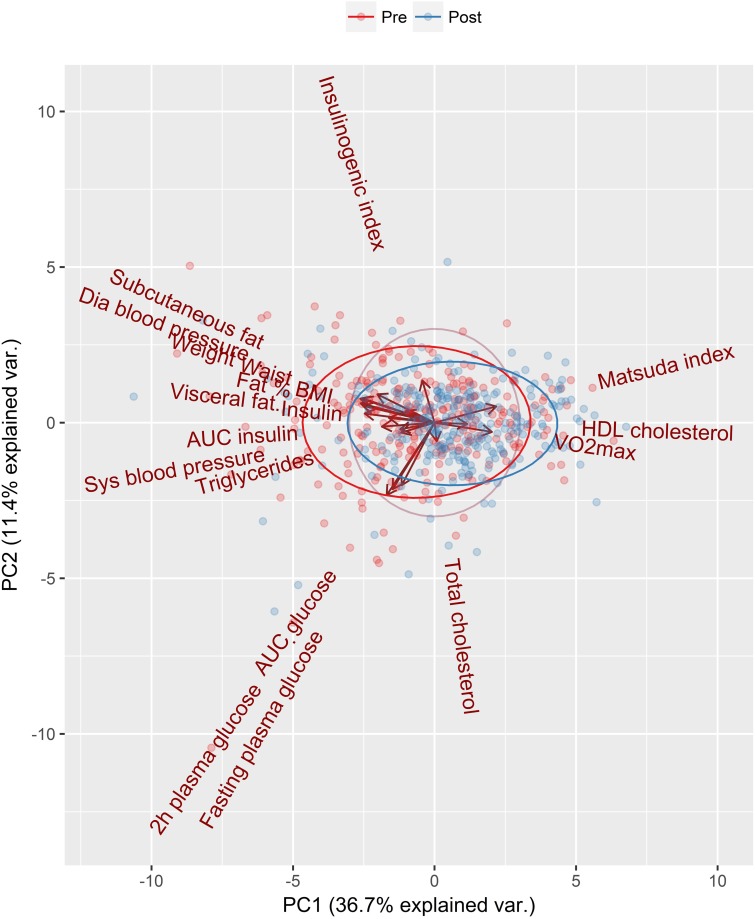
Background: Lifestyle interventions have been shown to delay or prevent the onset of type 2 diabetes among high risk adults. A better understanding of the variability in physiological responses would support the matching of individuals with the best type of intervention in future prevention programmes, in order to optimize risk reduction. The purpose of this study was to determine if phenotypic characteristics at baseline or following a 12 weeks lifestyle intervention could explain the inter-individual variability in change in glucose tolerance in individuals with high risk for type 2 diabetes. Methods: In total, 285 subjects with normal glucose tolerance (NGT, FINDRISC score > 12), impaired fasting glucose (IFG) and impaired glucose tolerance (IGT) were recruited for a 12 weeks lifestyle intervention. Glucose tolerance, insulin sensitivity, anthropometric characteristics and aerobic fitness were measured. Variability of responses was examined by grouping participants by baseline glycemic status, by cluster analysis based on the change in glucose tolerance and by Principal Component Analysis (PCA). Results: In agreement with other studies, the mean response to the 12 weeks intervention was positive for the majority of parameters. Overall, 89% improved BMI, 80% waist circumference, and 81% body fat while only 64% improved fasting plasma glucose and 60% 2 h glucose. The impact of the intervention by glycaemic group did not show any phenotypic differences in response between NGT, IFG, and IGT. A hierarchical cluster analysis of change in glucose tolerance identified four sub-groups of "responders" (high and moderate) and "non-responders" (no response or deteriorated) but there were few differences in baseline clincal and physiological parameters or in response to the intervention to explain the overall variance. A further PCA analysis of 19 clinical and physiological univariables could explain less than half (48%) of total variability. Conclusion: We found that phenotypic characteristics from standard clinical and physiological parameters were not sufficient to account for the inter-individual variability in glucose tolerance following a 12 weeks lifestyle intervention in inidivuals at high risk for type 2 diabetes. Further work is required to identify biomarkers that complement phenotypic traits and better predict the response to glucose tolerance.
Keywords: glucose tolerance; inter-individual variability; lifestyle intervention; prevention; risk of type 2 diabetes.
Figures
References
-
- Andersen G. S., Thybo T., Cederberg H., Orešič M., Esteller M., Zorzano A., et al. (2014). The DEXLIFE study methods: identifying novel candidate biomarkers that predict progression to type 2 diabetes in high risk individuals. Diabetes. Res. Clin. Pract. 106 383–389. 10.1016/j.diabres.2014.07.025 - DOI - PubMed
LinkOut - more resources
Full Text Sources