. 2019 Mar 27:10:556.
doi: 10.3389/fimmu.2019.00556. eCollection 2019.

Small-Molecule Immunosuppressive Drugs and Therapeutic Immunoglobulins Differentially Inhibit NK Cell Effector Functions in vitro

Affiliations

Small-Molecule Immunosuppressive Drugs and Therapeutic Immunoglobulins Differentially Inhibit NK Cell Effector Functions in vitro

Amandine Pradier et al. Front Immunol. .

Abstract

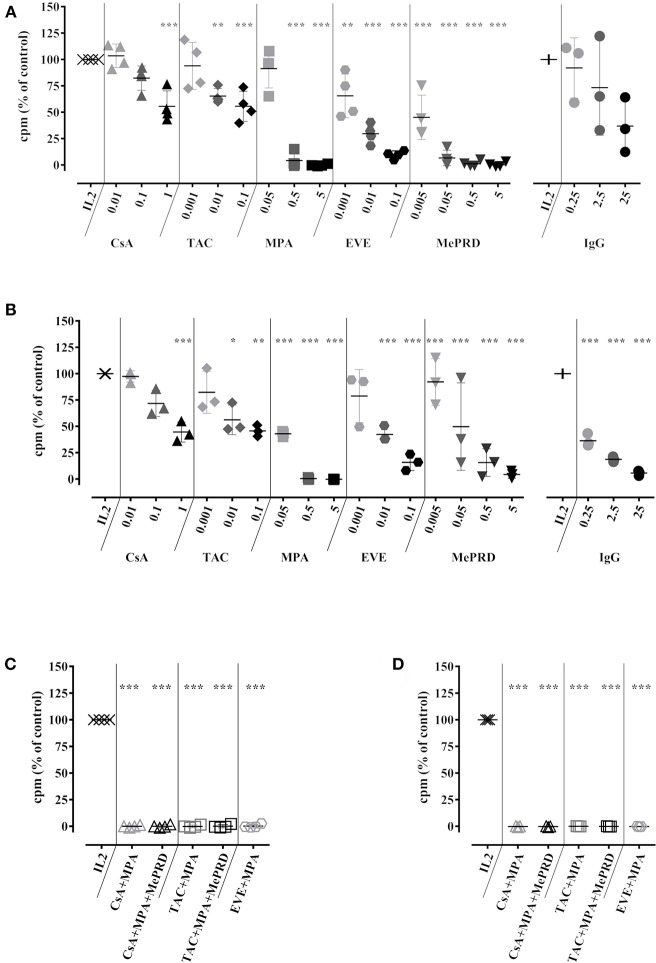
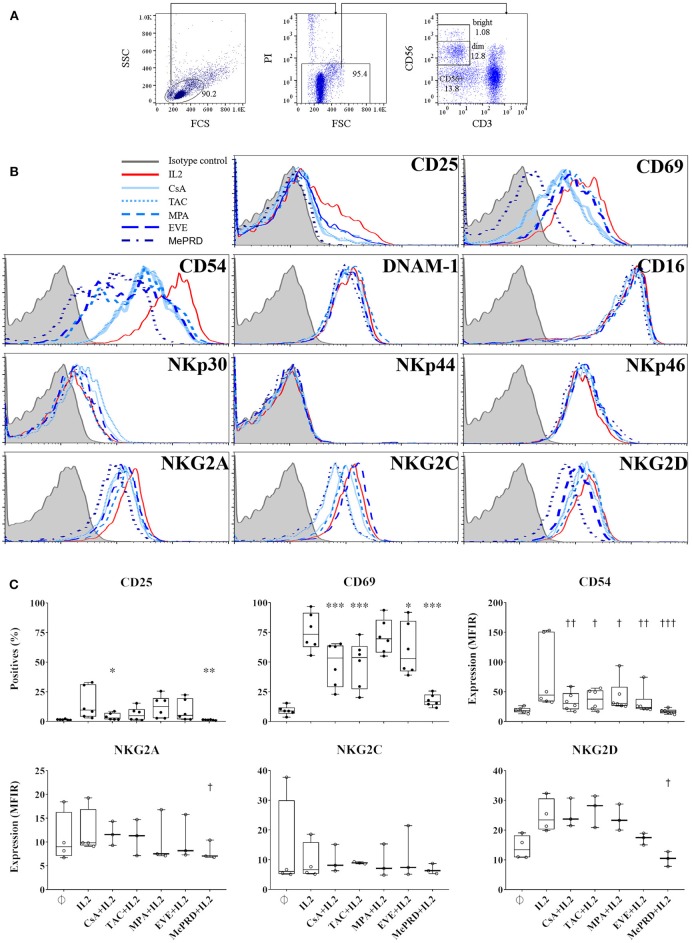
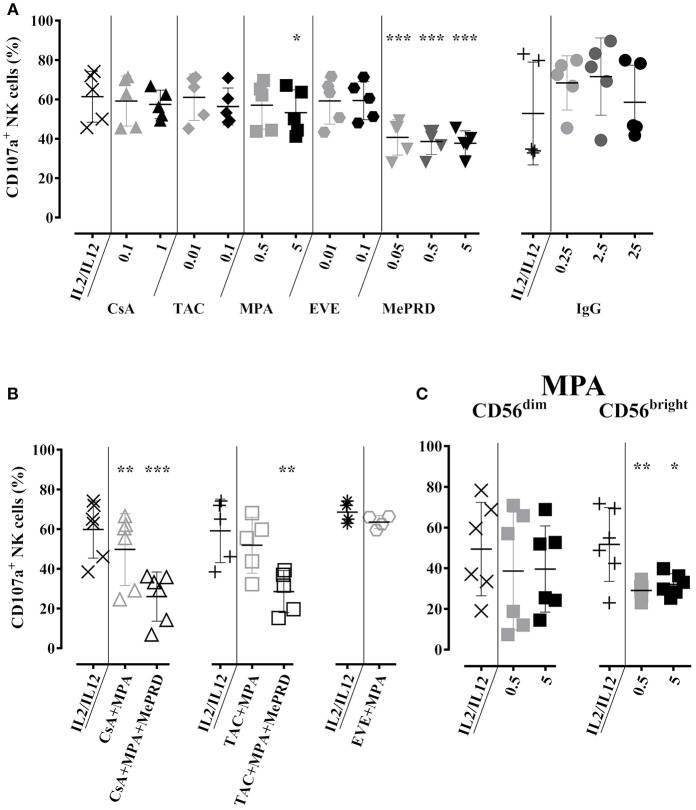
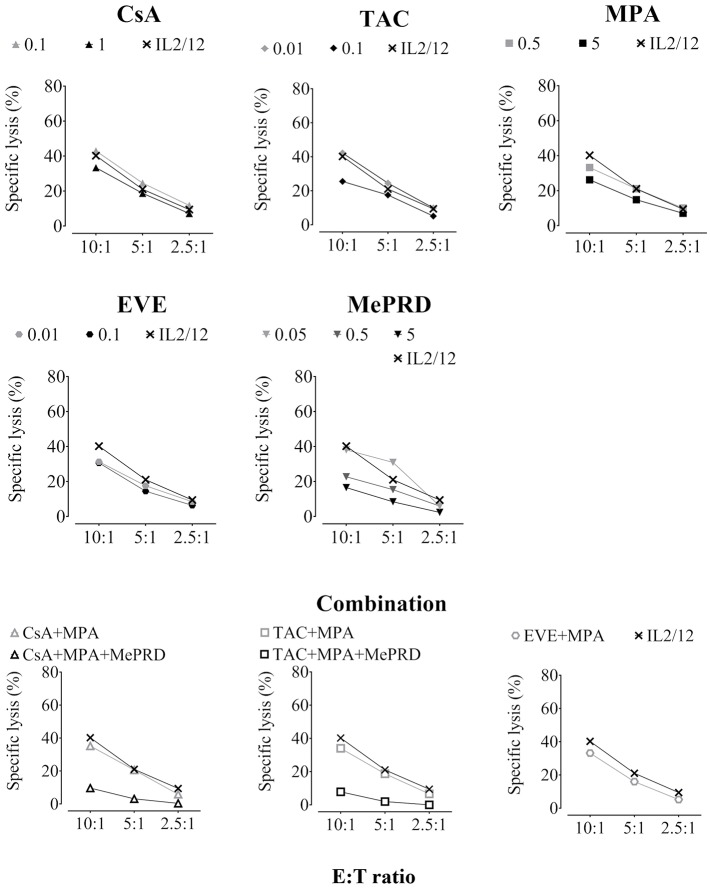
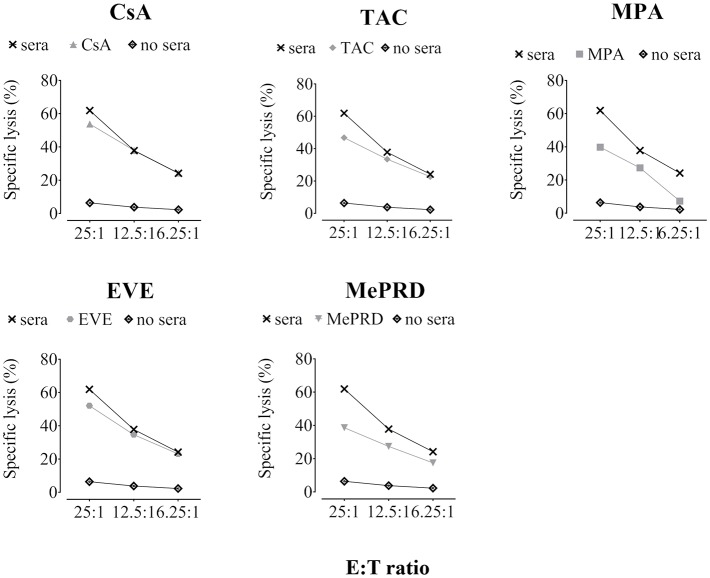
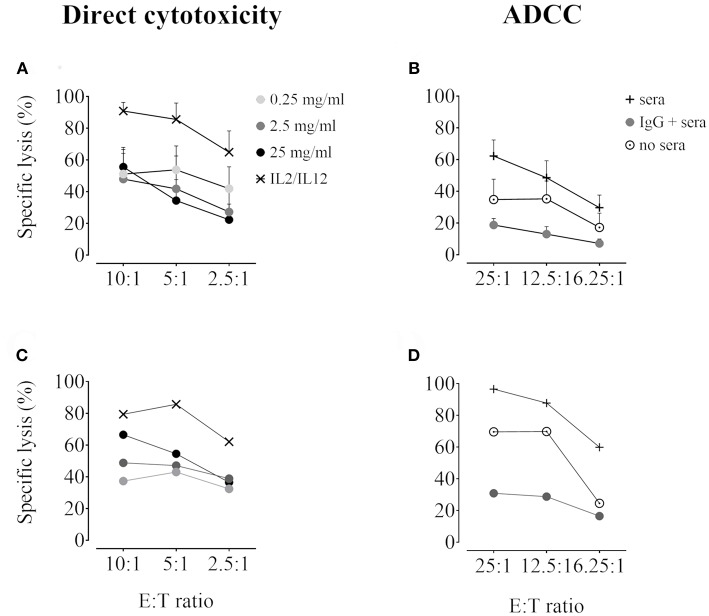
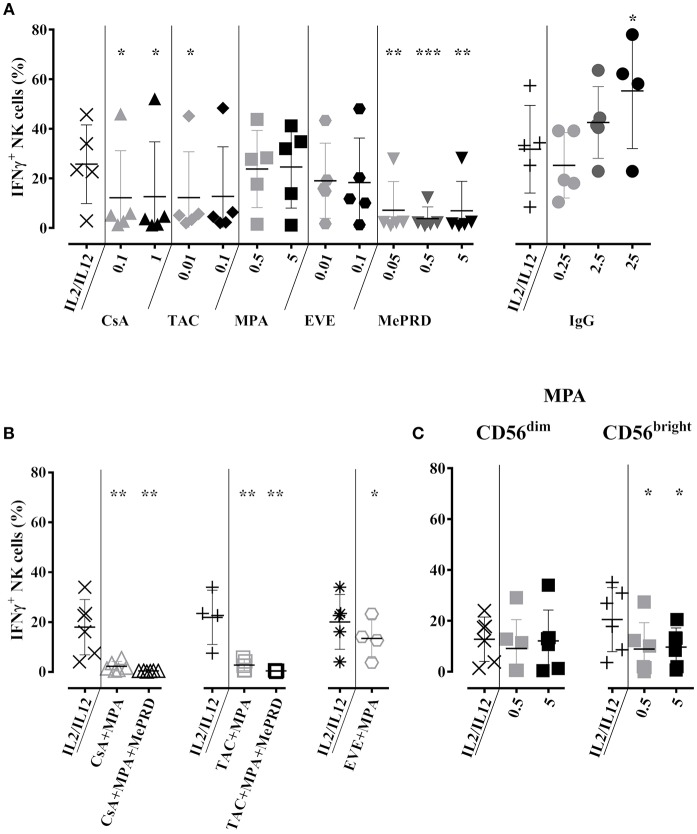
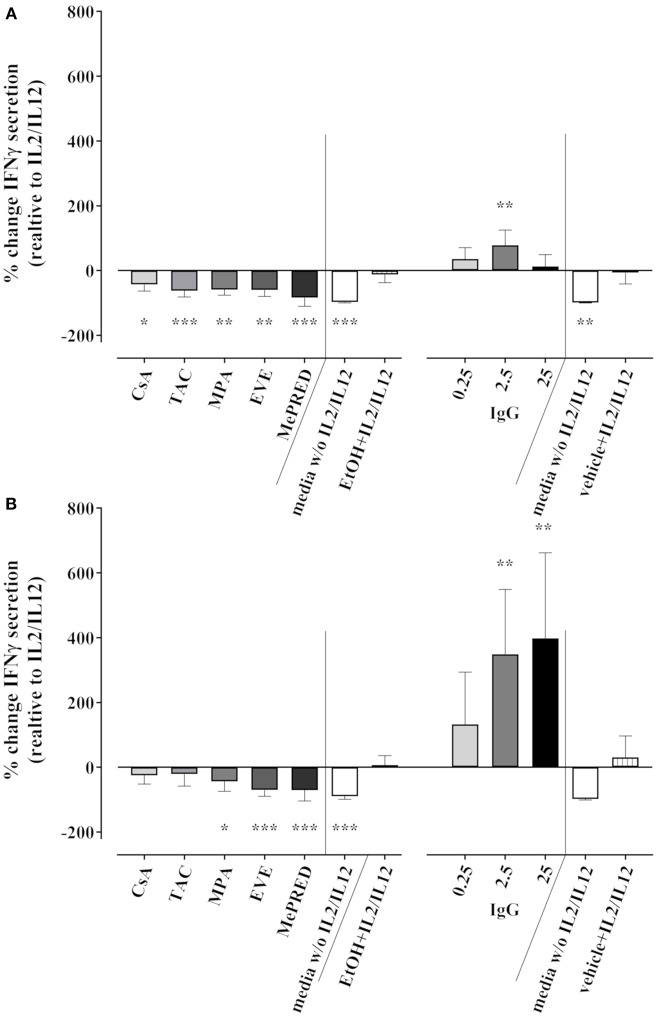
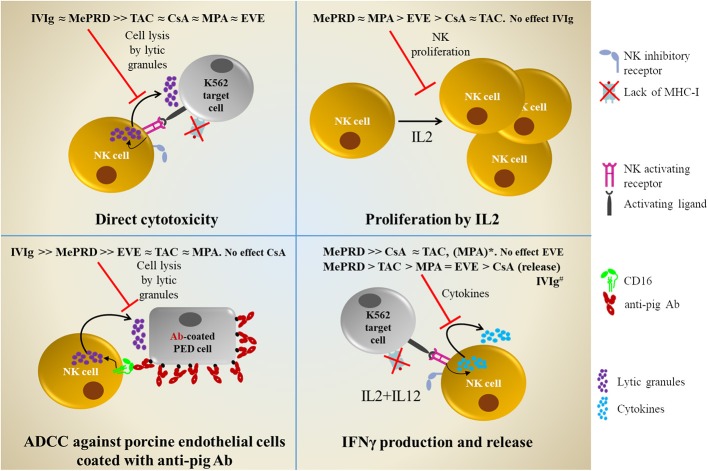
Small-molecule immunosuppressive drugs (ISD) prevent graft rejection mainly by inhibiting T lymphocytes. Therapeutic immunoglobulins (IVIg) are used for substitution, antibody-mediated rejection (AbMR) and HLA-sensitized recipients by targeting distinct cell types. Since the effect of ISD and IVIg on natural killer (NK) cells remains somewhat controversial in the current literature, the aim of this comparative study was to investigate healthy donor's human NK cell functions after exposure to ISD and IVIg, and to comprehensively review the current literature. NK cells were incubated overnight with IL2/IL12 and different doses and combinations of ISD and IVIg. Proliferation was evaluated by 3[H]-thymidine incorporation; phenotype, degranulation and interferon gamma (IFNγ) production by flow cytometry and ELISA; direct NK cytotoxicity by standard 51[Cr]-release and non-radioactive DELFIA assays using K562 as stimulator and target cells; porcine endothelial cells coated with human anti-pig antibodies were used as targets in antibody-dependent cellular cytotoxicity (ADCC) assays. We found that CD69, CD25, CD54, and NKG2D were downregulated by ISD. Proliferation was inhibited by methylprednisolone (MePRD), mycophenolic acid (MPA), and everolimus (EVE). MePRD and MPA reduced degranulation, MPA only of CD56bright NK cells. MePRD and IVIg inhibited direct cytotoxicity and ADCC. Combinations of ISD demonstrated cumulative inhibitory effects. IFNγ production was inhibited by MePRD and ISD combinations, but not by IVIg. In conclusion, IVIg, ISD and combinations thereof differentially inhibit NK cell functions. The most potent drug with an effect on all NK functions was MePRD. The fact that MePRD and IVIg significantly block NK cytotoxicity, especially ADCC, has major implications for AbMR as well as therapeutic strategies targeting cancer and immune cells with monoclonal antibodies.

Keywords: IVIg; cyclosporine A and tacrolimus; cytotoxicity and ADCC; everolimus; human NK cells; immunosuppression; methylprednisolone; mycophenolic acid.


Figures

Figure 1
Figure 1
Immunosuppressive drugs inhibit NK cell and T cell proliferation to a similar extent. Human NK cells isolated from PBMC (A), or the non-NK cell fraction containing T cells (B) were incubated with IL2 (50 U/ml) in the presence or not of CsA (0.01–1 μg/ml), TAC (0.001–0.1 μg/ml), MPA (0.05–5 μg/ml), EVE (0.001–0.1 μg/ml) MePRD (0.005–5 μg/ml) and IVIg (0.25–25 mg/ml). Data for ISD combinations on isolated NK cells, or the non-NK cell fraction are shown in (C,D), respectively. When used in combination, the following concentrations of ISD were used: CsA (0.1 μg/ml); TAC (0.01 μg/ml); MPA (5 μg/ml); EVE (0.01 μg/ml), and MePRD (0.5 μg/ml). After 5d, 3[H]-thymidine was added and cells were incubated 19 h before measuring cellular proliferation by 3[H]-incorporation. Controls included NK cells stimulated with IL2 and carrier/vehicle solutions containing ethanol (EtOH). Data are presented as mean % of IL2 controls ± SD. Symbols represent individual experiments (n = 3 or 4). Statistical analysis was performed using one-way ANOVA with Dunnett's Multiple Comparison Test as post-test vs. IL2 control. *p < 0.05, **p < 0.01, ***p < 0.005.
Figure 2
Figure 2
Inhibition of NK cell marker and receptor expression by MePRD and differential effect of calcineurin inhibitors and EVE. PBMC were incubated with or without IL2 (50 U/ml) (control); with IL2 (50 U/ml) plus CsA (0.1 μg/ml), TAC (0.01 μg/ml), MPA (5 μg/ml), EVE (0.01 μg/ml), or MePRD (0.5 μg/ml) for 24 h. NK cell marker and receptor expression was analyzed by FACS. The gating strategy is shown (A), and representative histogram plots of the effect of ISD on different markers tested in the same donor (B). A summary of selected markers is presented in (C), as % positive cells or MFIR. Data are shown as mean ± SD of 6 (for CD25, CD69 and CD54) or 3 (NKG2A and NKG2D) independent experiments. ANOVA with Dunnett's Multiple Comparison Test as post-test was used. p-values with statistical significance are indicated by * and † symbols for % positive cells and MFIR, respectively. *, p < 0.05, **, ††p < 0.01, ***, †††p < 0.005.
Figure 3
Figure 3
Partial inhibition of NK cell degranulation by MePRD and differential effect of MPA on CD56dim and CD56bright NK cell subpopulations. Purified NK cells were incubated overnight with IL2 (50 U/ml) and IL12 (0.5 ng/ml) in the presence or absence of CsA (0.1–1 μg/ml), TAC (0.01–0.1 μg/ml), MPA (0.5–5 μg/ml), EVE (0.01–0.1 μg/ml), MePRD (0.05–5 μg/ml) IVIg (0.25–25 mg/ml). Data for ISD/IVIg alone (A), and ISD combinations (B) are shown. When used combined, the following concentrations were used: CsA (0.1 μg/ml); TAC (0.01 μg/ml); MPA (5 μg/ml); EVE (0.01 μg/ml), and MePRD (0.5 μg/ml). The specific effect of MPA on CD56dim and CD56bright NK subpopulations is shown in (C). Carrier solutions containing ethanol (EtOH) or vehicle in the case of IVIg were used as internal controls (not shown). Degranulation was measured by detecting CD107a up-regulation on the surface of NK cells upon incubation with K562 cells for 3h at an effector to stimulator (E:S) ratio of 1:1. Golgistop was added 2h prior the end of the incubation, followed by CD56 staining and flow cytometry analysis. Data are presented as percentage of CD56+CD107+ cells ± SD. Symbols represent individual experiments, (A) n = 5 for ISD, n = 4 for IVIG; (B) n = 5; and (C) n = 6. Statistical analysis was performed using one-way ANOVA for matched data with Dunnett's Multiple Comparison Test as post-test vs. IL2/IL12 with the exception of EVE/MPA (B) were paired t-test was performed.*p < 0.05, **p < 0.01, ***p < 0.005.
Figure 4
Figure 4
ISD inhibit direct NK cytotoxicity. Purified human NK cells were incubated overnight with IL2 (50 U/ml) and IL12 (0.5 ng/ml) in the presence or absence of CsA (0.1 and 1 μg/ml), TAC (0.01 and 0.1 μg/ml), MPA (0.5 and 5 μg/ml), EVE (0.01 and 0.1 μg/ml), MePRD (0.05–5 μg/ml) alone or in combinations without washing. When used combined, the following concentrations were used: CsA (0.1 μg/ml); TAC (0.01 μg/ml); MPA (5 μg/ml); EVE (0.01 μg/ml), and MePRD (0.5 μg/ml). Carrier solutions containing ethanol (EtOH) were used as internal controls (data not shown). NK cytotoxicity was tested using standard 4 h 51[Cr]-release assays. NK cells and 51[Cr]-labeled K562 targets were plated at different E:T ratios (10:1, 5:1, and 2.5:1). For the number of independent experiments see Table 1. Representative plots from one experiment using cells from a single donor are shown.
Figure 5
Figure 5
ADCC mediated by NK cells is inhibited by immunosuppressive drugs. Representative plots of ADCC from a single donor tested for different ISD are shown. Purified NK cells were incubated overnight with IL2 (50 U/ml) and IL12 (0.5 ng/ml) in the presence of CsA (0.1 μg/ml), TAC (0.01 μg/ml), MPA (5 μg/ml), EVE (0.01 μg/ml), and MePRD (0.5 μg/ml). NK effector cells and 51[Cr]-labeled PED target cells (pre-incubated or not for 45 min with 10% human serum) were plated at different E:T ratios (25:1, 12.5:1, and 6.25:1). After 4 h, 51[Cr]-release was measured. For the number of independent experiments see Table 1.
Figure 6
Figure 6
Inhibition of direct NK cytotoxicity and ADCC by IVIg. Purified human NK cells were incubated overnight with IL2 (50 U/ml) and IL12 (0.5 ng/ml) in the presence or not of IVIg (0.25–25 mg/ml). Vehicle was used as an internal control (data not shown). NK cytotoxicity was tested using DELFIA cytotoxicity assays. (A) and (C) Direct NK cytotoxicity: NK cells and BATDA-labeled K562 targets were plated at different E:T ratios (10:1, 5:1, and 2.5:1) for 2 h. (B,D) ADCC: BATDA-labeled PED target cells (pre-incubated or not for 45 min with 10% human serum) were plated at different E:T ratios (25:1, 12.5:1, and 6.25:1) for 2 h with IVIg (2.5 mg/ml). In both assays, EuTDA-release was measured by time-resolved fluorometry. Data are presented as specific lysis plots, in (A,B) as pooled data (n = 6 for direct cytotoxicity, n = 5 for ADCC), and in (C,D) as a single donor representative experiment.
Figure 7
Figure 7
Inhibition of NK cell IFNγ production by MePRD and calcineurin inhibitors but not by IVIg. Purified NK cells were incubated overnight with IL2 (50 U/ml) and IL12 (0.5 ng/ml) in the presence or absence of CsA (0.1–1 μg/ml), TAC (0.01–0.1 μg/ml), MPA (0.5–5 μg/ml), EVE (0.01–0.1 μg/ml), MePRD (0.05–5 μg/ml) IVIg (2,5–25 mg/ml) (A) alone or (B) in combination, while (C) shows the specific effect of MPA on CD56dim and CD56high NK subpopulations. When used combined, the following concentrations were used: CsA (0.1 μg/ml); TAC (0.01 μg/ml); MPA (5 μg/ml); EVE (0.01 μg/ml), and MePRD (0.5 μg/ml). IL2 and IL12 only treated cells were used as control. Carrier solution containing either EtOH or vehicle in the case of IVIg was used as an internal control (data not shown). IFNγ production was detected by intracellular flow cytometry analysis upon additional incubation with K562 stimulator cells for 3 h at an E:S ratio of 1:1. After two hours of incubation, Golgistop was added followed by CD56 staining and flow cytometry analysis. Data are presented as mean percentage of CD56+IFNγ+ cells ± SD. Symbols represent individual experiments, (A) n = 5 or 6 for ISD; n = 5 for IVIg; (B), n = 5; and (C) n = 6. Statistical analysis was performed using one-way ANOVA for matched data with Dunnett's Multiple Comparison Test as post-test vs. IL2/IL12 with the exception of EVE/MPA (B) were paired t-test was performed. *p < 0.05, **p < 0.01, ***p < 0.005.
Figure 8
Figure 8
Effect of ISD and IVIg on IFNγ secretion by NK cells in response to IL2 and IL12. Secretion of IFNγ after overnight incubation of purified NK cells with IL2 (50 U/ml) and IL12 (0.5 ng/ml) in the presence or absence of CsA (0.1 μg/ml), TAC (0.01 μg/ml), MPA (5 μg/ml), EVE (0.01 μg/ml), MePRD (0.5 μg/ml), and IVIg (0.25–25 mg/ml) was measured in the culture supernatants by ELISA (limit of detection was 15.6 pg/ml); (A) upon additional incubation with K562 stimulator cells for 3 h at an E:S ratio of 1:1; (B) with no additional stimulation by K562. Combinations of ISD were not analyzed. Percentage of change of IFNγ secretion induced by ISD compared to IL2/IL12 alone is shown. Controls included NK cell cultures in medium without IL2/IL12 or in EtOH/vehicle with IL2/IL12. Statistical analysis was performed using one-way ANOVA for matched data with Dunnett's Multiple Comparison Test as post-test vs. IL2/IL12. Data are presented as percentage of control ± SD. (n = 3 drugs alone, n = 5 for IVIg).
Figure 9
Figure 9
Comprehensive overview of the inhibitory effects of ISD and IVIg on NK cell functions. Direct cytotoxicity was tested following incubation overnight with IL2 (50 U/ml) and IL12 (0.5 ng/ml) in the presence or not of ISD and IVIg against K562 target cells using 51[Cr]-release and DELFIA cytotoxicity assays. Proliferation was tested following 5d incubation with IL2 (50 U/ml) by 3[H]-incorporation. ADCC was tested using porcine endothelial (PED) target cells coated with human anti-pig antibodies in 51[Cr]-release and DELFIA cytotoxicity assays. IFNγ production and release was tested following incubation overnight with IL2/IL12 followed by stimulation with K562 cells by intracellular flow cytometry and ELISA. *MPA only showed inhibitory effect on IFNγ production in the CD56bright NK cell subpopulation. #IVIg, enhances IFNγ production and release; opposite to ISD.

References

    1. Cerwenka A, Lanier LL. Natural killer cell memory in infection, inflammation and cancer. Nat Rev Immunol. (2016) 16:112–23. 10.1038/nri.2015.9 - DOI - PubMed
    1. Poli A, Michel T, Patil N, Zimmer J. Revisiting the functional impact of NK cells. Trends Immunol. (2018) 39:460–72. 10.1016/j.it.2018.01.011 - DOI - PubMed
    1. Ruggeri L, Capanni M, Urbani E, Perruccio K, Shlomchik WD, Tosti A, et al. . Effectiveness of donor natural killer cell alloreactivity in mismatched hematopoietic transplants. Science. (2002) 295:2097–100. 10.1126/science.1068440 - DOI - PubMed
    1. Cooley S, Parham P, Miller JS. Strategies to activate NK cells to prevent relapse and induce remission following hematopoietic stem cell transplantation. Blood. (2018) 131:1053–62. 10.1182/blood-2017-08-752170 - DOI - PMC - PubMed
    1. Hofer E, Koehl U. Natural killer cell-based cancer immunotherapies: from immune evasion to promising targeted cellular therapies. Front Immunol. (2017) 8:745. 10.3389/fimmu.2017.00745 - DOI - PMC - PubMed

Publication types

MeSH terms