. 2019 Mar 27:10:571.
doi: 10.3389/fimmu.2019.00571. eCollection 2019.

Identification of AnnexinA1 as an Endogenous Regulator of RhoA, and Its Role in the Pathophysiology and Experimental Therapy of Type-2 Diabetes

Affiliations

Identification of AnnexinA1 as an Endogenous Regulator of RhoA, and Its Role in the Pathophysiology and Experimental Therapy of Type-2 Diabetes

Gareth S D Purvis et al. Front Immunol. .

Abstract

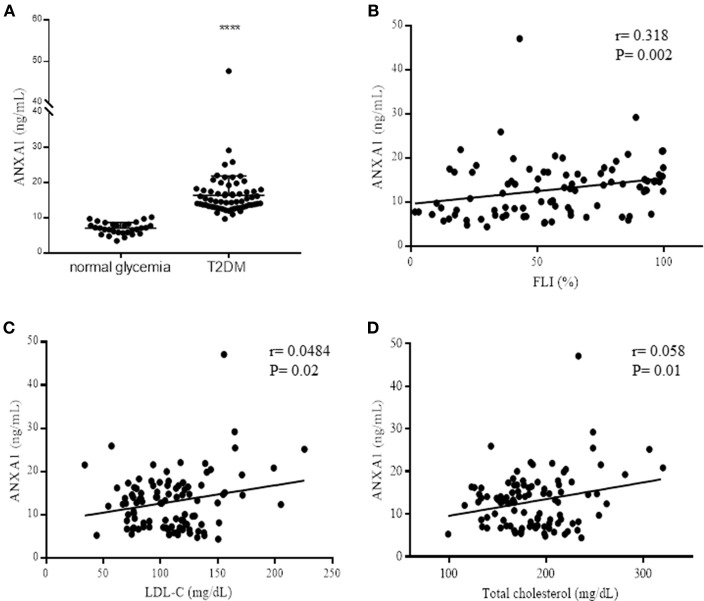
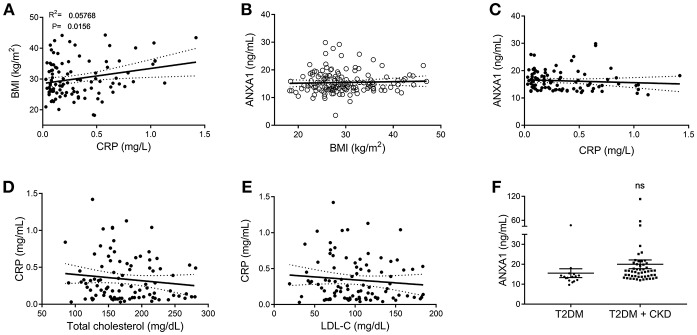
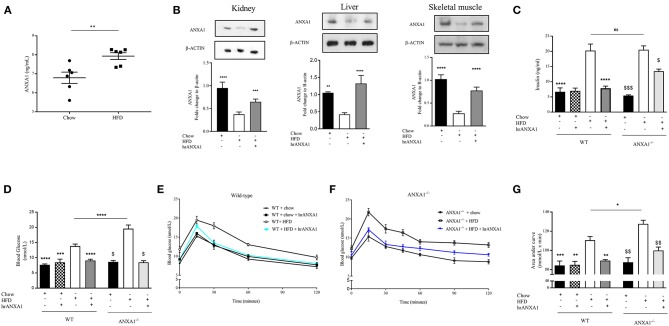
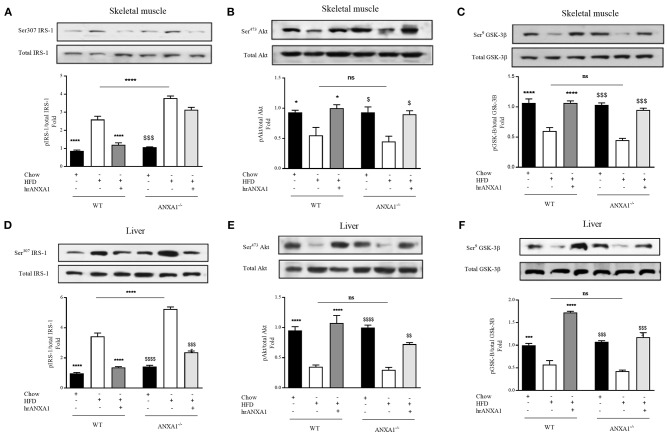
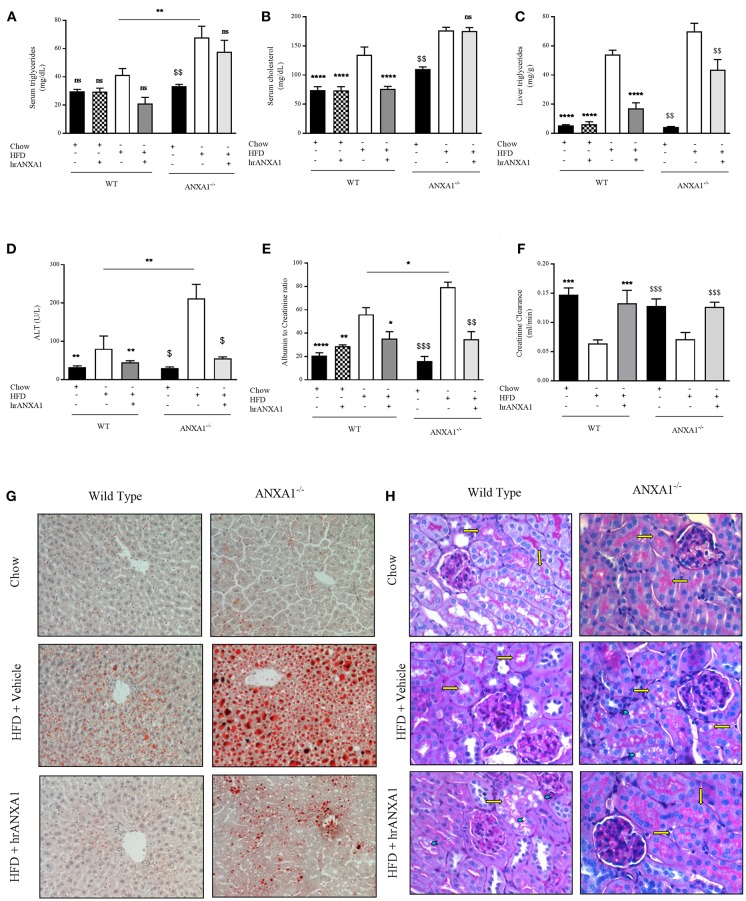
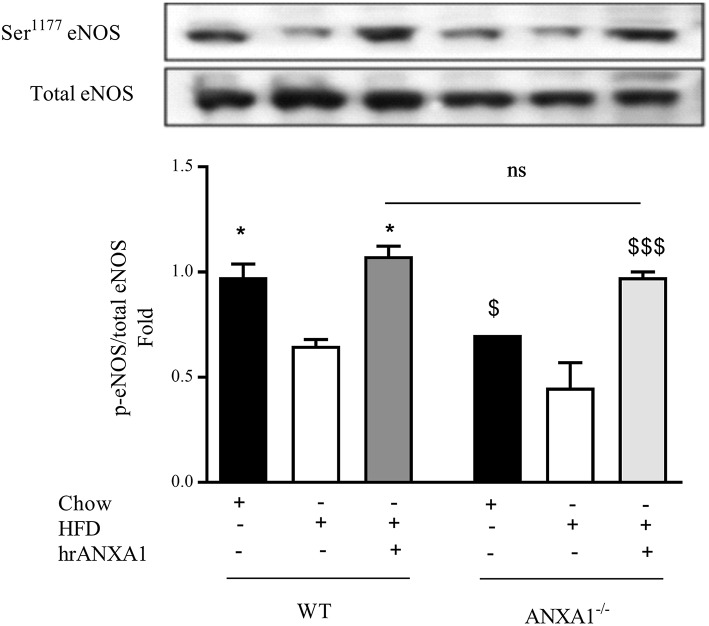
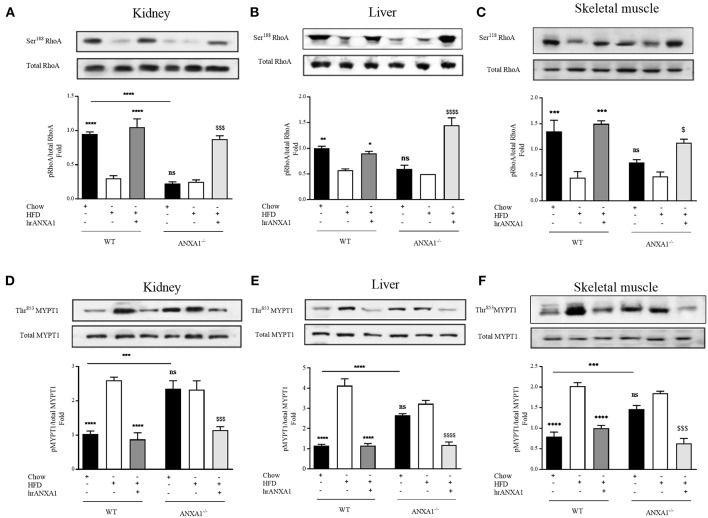
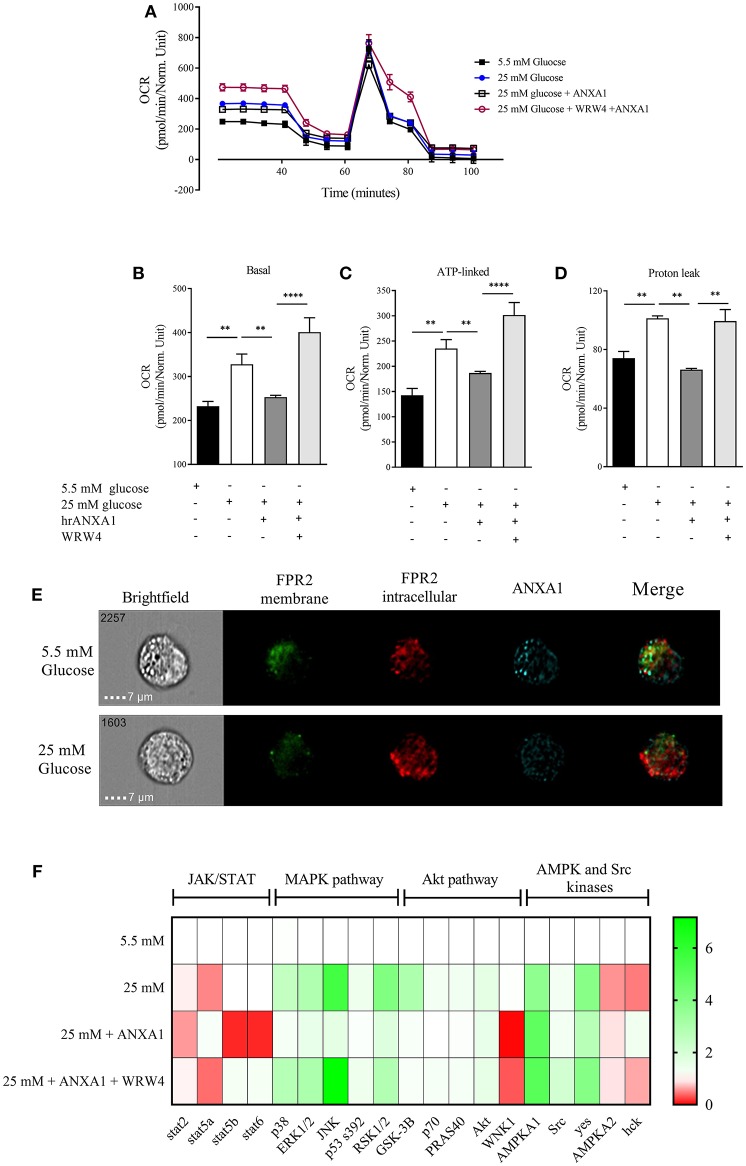
Annexin A1 (ANXA1) is an endogenously produced anti-inflammatory protein, which plays an important role in the pathophysiology of diseases associated with chronic inflammation. We demonstrate that patients with type-2 diabetes have increased plasma levels of ANXA1 when compared to normoglycemic subjects. Plasma ANXA1 positively correlated with fatty liver index and elevated plasma cholesterol in patients with type-2 diabetes, suggesting a link between aberrant lipid handling, and ANXA1. Using a murine model of high fat diet (HFD)-induced insulin resistance, we then investigated (a) the role of endogenous ANXA1 in the pathophysiology of HFD-induced insulin resistance using ANXA1-/- mice, and (b) the potential use of hrANXA1 as a new therapeutic approach for experimental diabetes and its microvascular complications. We demonstrate that: (1) ANXA1-/- mice fed a HFD have a more severe diabetic phenotype (e.g., more severe dyslipidemia, insulin resistance, hepatosteatosis, and proteinuria) compared to WT mice fed a HFD; (2) treatment of WT-mice fed a HFD with hrANXA1 attenuated the development of insulin resistance, hepatosteatosis and proteinuria. We demonstrate here for the first time that ANXA1-/- mice have constitutively activated RhoA. Interestingly, diabetic mice, which have reduced tissue expression of ANXA1, also have activated RhoA. Treatment of HFD-mice with hrANXA1 restored tissue levels of ANXA1 and inhibited RhoA activity, which, in turn, resulted in restoration of the activities of Akt, GSK-3β and endothelial nitric oxide synthase (eNOS) secondary to re-sensitization of IRS-1 signaling. We further demonstrate in human hepatocytes that ANXA1 protects against excessive mitochondrial proton leak by activating FPR2 under hyperglycaemic conditions. In summary, our data suggest that (a) ANXA1 is a key regulator of RhoA activity, which restores IRS-1 signal transduction and (b) recombinant human ANXA1 may represent a novel candidate for the treatment of T2D and/or its complications.

Keywords: Annexin A1; Rho A; hepatosteatosis; metabolism; nephropathy; type-2 diabetes.


Figures

Figure 1
Figure 1
Assessment of ANXA1 levels in patients with type-2 diabetes. (A) Plasma ANXA1 levels measured by ELISA in age and sex match normoglycemic (n = 30) and patients with type-2 diabetes (n = 65). (B) Correlation in diabetic patients of plasma ANXA1 levels and: Fatty Liver Index (B), LDL-C (C), and total cholesterol (D). Data is expressed as mean± SEM., ****p < 0.0001. (B–D) 95% confidence intervals are displayed of the microvascular and significance estimated using Fishers F-test p < 0.05 was deemed significant.
Figure 2
Figure 2
Correlation data of clinical markers in patients with type-2 diabetes and ANXA1. (A) Correlation of plasma CRP with BMI in diabetic patients. (B) Correlation of plasma ANXA1 levels with BMI in diabetic patients. (C) Correlation of plasma ANXA1 levels with CRP in diabetic patients. (D) Correlation of CRP with cholesterol in diabetic patients. (E) Correlation of CRP with LDL in diabetic patients. (F) Plasma ANXA1 levels in patients with diabetes ± CKD. (A–E) display 95% confidence intervals are displayed of the linear regression and significance estimated using Fishers F-test p < 0.05 was deemed significant.
Figure 3
Figure 3
ANXA1 attenuates the development of obesity and insulin resistance in HFD fed mice. C57BL/6 or ANXA1−/− mice, fed a standard diet (chow) or a high-fat diet (HFD) for 10 weeks, were treated with vehicle or human recombinant (hr) ANXA1 (40 μg/kg, i.p.) five times per week between weeks 5 and 10. (A) ELISA for ANXA1 levels were measured in serum isolated from whole blood at harvest, (n = 6) (B) Western blot analysis of kidney, liver, and skeletal muscle show a depletion in ANXA1 which was restored by hrANXA1 treatment (n = 6/group). (C) Serum insulin levels were measured in plasma isolated from whole blood at harvest (n = 6–10/group). (D) Basal non-fasted blood glucose was measured at week 10 1 h prior to harvest via the tail vain (n = 6–10/group). (E) Oral glucose tolerance was assessed over 120 min 1 week prior to harvest in WT mice. (F) Oral glucose tolerance was assessed over 120 min 1 week prior to harvest in ANXA1−/− mice. (G) The area under curve (AUC) of OGTT was calculated for respective groups and used for statistical analysis. Data analyses by a one-way ANOVA followed by a Bonferroni post-hoc test and the mean is expressed mean ± SEM., *p < 0.05, **p < 0.01, ***p < 0.001, ****p < 0.0001; $p < 0.05 vs. WT + HFD; and $$p < 0.01, $$$p < 0.001 vs. ANXA1−/− + HFD.
Figure 4
Figure 4
ANXA1 attenuates HFD induced development of peripheral insulin resistance. C57BL/6 or ANXA1−/− mice, fed a standard diet (chow), or a high-fat diet (HFD) for 10 weeks, were treated with vehicle or human recombinant (hr) ANXA1 (40 μg/kg, i.p.) five times per week between weeks 5 and 10. Western blot analysis for Phosphorylation of Ser307 on IRS-1 in Skeletal muscle (A) or liver (D) and normalized to total IRS-1; for phosphorylation of Ser473 on Akt in the skeletal muscle (B) and liver (E) and normalized to total Akt; for phosphorylation of Ser9 on GSK-3β in the skeletal muscle (C) and in the liver (F) and normalized to total GSK-3β. Data were analyzed by a one-way ANOVA followed by a Bonferroni post-hoc test and the mean is expressed mean ± SEM., *p < 0.05, ***p < 0.001, ****p < 0.0001 vs. WT + HFD; $p < 0.05, $$p < 0.01, $$$p < 0.001, $$$$p < 0.0001 vs. ANXA1−/− +HFD.
Figure 5
Figure 5
ANXA1 attenuates induced lipid accumulation, hepatic injury, and renal dysfunction. C57BL/6 or ANXA1−/− mice, fed a standard diet (chow) or a HFD for 10 weeks, were treated with vehicle or human recombinant (hr) ANXA1 (40 μg/kg, i.p.) five times per week between weeks 5 and 10. Measure of (A) Serum triglyceride, (B) Serum cholesterol, (C) Liver triglyceride, (D) Serum aminotransferase (ALT), n = 6–8/group. (E) 18 h urine samples was collected and renal dysfunction was measured by albumin to creatinine ratio (ACR), n = 6–8 per group. (F) Creatinine clearance was measured from urinary and serum creatinine, n = 6–8 per group. (G): representative images of hepatic lipid deposition assessed by Oil Red-O staining. Panel (H): representative images of histological changes in kidney structure assessed by periodic acid-Schiff staining, yellow arrows indicating brush borders of proximal tubules. Data were analyzed by a one-way ANOVA followed by a Bonferroni post-hoc test and the mean is expressed mean ± SEM., *p < 0.05, **p < 0.01, ***p < 0.001, ****p < 0.0001 vs. WT + HFD. $p < 0.05, $$p < 0.01, $$$p < 0.001 vs. ANXA1−/− + HFD.
Figure 6
Figure 6
ANXA1 attenuates HFD induction of eNOS in the diabetic kidney C57BL/6 or ANXA1−/− mice, fed a standard diet (chow), or a high-fat high-sugar diet (HFD) for 10 weeks, were treated with vehicle or hrANXA1 (40 μg/kg, i.p.) five times per weeks between weeks 5 and 10. At harvest kidney, liver and skeletal muscle was harvested. Phosphorylation of eNOS was determined by western blot; a representative blot is shown and densitometry quantification of n = 3 independent experiments. *p < 0.05 and $p < 0.05, $$$p < 0.001.
Figure 7
Figure 7
ANXA1 attenuates RhoA induction in mice fed a HFD. C57BL/6 or ANXA1−/− mice, fed a standard diet (chow) or a high-fat high-sugar diet (HFD) for 10 weeks, were treated with vehicle or hrANXA1 (40 μg/kg, i.p.) five times per weeks between weeks 5 and 10. At harvest kidney, liver and skeletal muscle was collected. (A–C) Phosphorylation of Ser188 on RhoA was normalized to total RhoA in kidney (A), liver (B), and skeletal muscle (C). (D–F) Phosphorylation of Thr853 on MYPT1 was normalized to total MYPT1 in kidney (D), liver (E), and skeletal muscle (F). A representative blot is shown for each protein and densitometry quantification of n = 3 experiments represented in the histograms. Data were analyzed by a one-way ANOVA followed by a Bonferroni post-hoc test and the mean is expressed mean ± SEM., *p < 0.05, **p < 0.01, ***p < 0.001, ****p < 0.0001 vs. WT + HFD; $p < 0.05, $$$p < 0.001, $$$$p < 0.0001 vs. ANXA1−/− +HFD.
Figure 8
Figure 8
ANXA1 protects human hepatocytes from excess proton leak via FPR2. HepG2 cells were grown for 48 h in 5.5 mM glucose, 25 mM glucose, 25 mM glucose + hrANXA1, or 25 mM glucose + hrANXA1 + WRW4. (A) Oxygen consumption rate was assessed using SeaHorse analyzer. (B) Basal OCR, and (C) ATP-linked OCR, and (D) proton leak. (E) Expression and localization of FPR2 and ANXA1 assessed by immunofluorescent staining and visualized using image stream. (F) 1 × 10⁶ HepG2 cells were grown in 6 well-plates and protein isolated to assess phosphorylation state of 43 proteins using human phospho-proteome profiler. (B–D) Data were analyzed by a one-way ANOVA followed by a Bonferroni post-hoc test and the mean is expressed mean ± SEM., **p < 0.01, ****p < 0.0001 vs. HepG2 + 25 mM glucose. (F) Data expressed as fold change to HepG2 + 5.5 mM glucose of pooled samples from 3 independent experiments.

References

    1. Dai W, Ye L, Liu A, Wen SW, Deng J, Wu X, et al. . Prevalence of nonalcoholic fatty liver disease in patients with type 2 diabetes mellitus. Medicine. (2017) 96:e8179. 10.1097/MD.0000000000008179 - DOI - PMC - PubMed
    1. Rhee CM, Ahmadi SF, Kalantar-Zadeh K. The dual roles of obesity in chronic kidney disease. Curr Opin Nephrol Hypertens. (2016) 25:208–16. 10.1097/MNH.0000000000000212 - DOI - PMC - PubMed
    1. Mandviwala T, Khalid U, Deswal A. Obesity and cardiovascular disease: a risk factor or a risk marker? Curr Atheroscler Rep. (2016) 18:21 10.1007/s11883-016-0575-4 - DOI - PubMed
    1. Brownlee M. Biochemistry and molecular cell biology of diabetic complications. Nature. (2001) 414:813–20. 10.1038/414813a - DOI - PubMed
    1. Perretti M, D'Acquisto F. Annexin A1 and glucocorticoids as effectors of the resolution of inflammation. Nat Rev Immunol. (2009) 9:62–70. 10.1038/nri2470 - DOI - PubMed

Publication types

MeSH terms