. 2019 Mar 26:10:364.
doi: 10.3389/fpls.2019.00364. eCollection 2019.

Optimal Design of Plant Canopy Based on Light Interception: A Case Study With Loquat

Affiliations

Optimal Design of Plant Canopy Based on Light Interception: A Case Study With Loquat

Liyu Tang et al. Front Plant Sci. .

Abstract

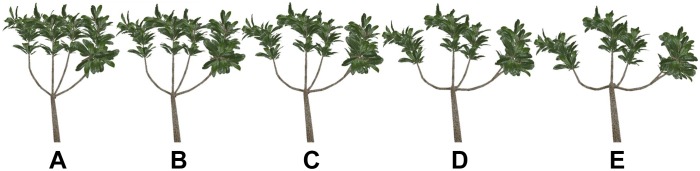
Canopy architecture determines the light distribution and light interception in the canopy. Reasonable shaping and pruning can optimize tree structure; maximize the utilization of land, space and light energy; and lay the foundation for achieving early fruiting, high yield, health and longevity. Due to the complexity of loquat canopy architecture and the multi-year period of tree growth, the variables needed for experiments in canopy type training are hardly accessible through field measurements. In this paper, we concentrated on exploring the relationship between branching angle and light interception using a three-dimensional (3D) canopy model in loquat (Eriobotrya japonica Lindl). First, detailed 3D models of loquat trees were built by integrating branch and organ models. Second, the morphological models of different loquat trees were constructed by interactive editing. Third, the 3D individual-tree modeling software LSTree integrated with the OpenGL shadow technique, a radiosity model and a modified rectangular hyperbola model was used to calculate the silhouette to total area ratio, the distribution of photosynthetically active radiation within canopies and the net photosynthetic rate, respectively. Finally, the influence of loquat tree organ organization on the light interception of the trees was analyzed with different parameters. If the single branch angle between the level 2 scaffold branch and trunk is approximately 15° and the angles among the level 2 scaffold branches range from 60 to 90°, then a better light distribution can be obtained. The results showed that the branching angle has a significant impact on light interception, which is useful for grower manipulation of trees, e.g., shoot bending (scaffold branch angle). Based on this conclusion, a reasonable tree structure was selected for intercepting light. This quantitative simulation and analytical method provides a new digital and visual method that can aid in the design of tree architecture.

Keywords: canopy architecture; interactive shaping and pruning; light distribution; light interception; net photosynthetic rate; silhouette to total area ratio (STAR).


Figures

Figure 1
Figure 1
Simulated a loquat tree and the model representation for each part. (A) Branch model built based on the L-system; (B,C) leaf model and fruit model built based on point cloud data; (D) a detailed 3D model integrating the loquat organ models.
Figure 2
Figure 2
The key steps in the process of selecting branches and schematic diagram after selection. (A) According to the IDs of branch models drawn with false colors, the model is rendered offscreen. (B) The highlighted parts indicate the selected branch and sub-branches.
Figure 3
Figure 3
(A–D) Schematic representation of different branches with different angles with respect to the trunk. The red part of the picture shows the angle in three-dimensional space, that is, the angle between the main direction and the level 2 scaffold branch.
Figure 4
Figure 4
Daily variation in the STAR and total PAR for shoots in different angle between branch to trunk. The differently colored curves represent the variation in STAR and total PAR through time for different angles. The implementation represents the change of the PAR, and the dashed line represents the change of the STAR.
Figure 5
Figure 5
Diurnal change in net photosynthetic rate with angle. The bars with different colors represent different times. The red line shows the variation in the average net photosynthetic rate with the angle at a given hour of the day. The bars represent the daily average net photosynthetic rate of whole branches at different angles.
Figure 6
Figure 6
(A–E) The branch models with different angles between shoots. The figure shows the branches of leaves, showing the blade from different angles. The angle between branches gradually increase from AtoE.
Figure 7
Figure 7
(A–D) Virtual representation of loquat morphology for different angles. The angle of the red line represents the angle below, that is, the angle of the level 2 scaffold branch in the three-dimensional space. The model was generated by the fast shaping and pruning function. The model information is the same for all scenarios, except for the angle.
Figure 8
Figure 8
Evolution of silhouette to total area ratio (STAR) (A), photosynthetically active radiation (PAR) (B), and net photosynthetic rate (Pn) (C) for simulated trees from 7:00 to 17:00 daily in the experiment employing different geometry and morphology, when varying the angle parameters. Each box extends from the lower to upper quartile values, with a blue line at the median and a dot at the mean, respectively.
Figure 9
Figure 9
(A–F) Schematic representation of loquat morphology for different pruning schemes. The LAI, height and ratio of number of long shoots to number of total shoots (LSR) data are shown in the picture.

References

    1. Andrivon D., Giorgetti C., Baranger A., Calonnec A., Cartolaro P., Faivre R., et al. (2013). Defining and designing plant architectural ideotypes to control epidemics? Eur. J. Plant Pathol. 135 611–617. 10.1007/s10658-012-0126-y - DOI
    1. Borel C. C., Gerstl S. A. W., Powers B. J. (1991). The radiosity method in optical remote sensing of structured 3-D surfaces. Remote Sens. Environ. 36 13–44. 10.1016/0034-4257(91)90028-5 - DOI
    1. Burgess A. J., Retkute R., Herman T., Murchie E. H. (2017). Exploring relationships between canopy architecture, light distribution, and photosynthesis in contrasting rice genotypes using 3D canopy reconstruction. Front. Plant Sci. 8:734. 10.3389/fpls.2017.00734 - DOI - PMC - PubMed
    1. Cannell M. G. R., Thornley J. H. M. (1998). Temperature and CO2 responses of leaf and canopy photosynthesis: a clarification using the non-rectangular hyperbola model of photosynthesis. Ann. Bot. 82 883–892. 10.1006/anbo.1998.0777 - DOI
    1. Chelle M., Andrieu B. (1998). The nested radiosity model for the distribution of light within plant canopies. Ecol. Model. 111 75–91. 10.1093/aob/mcr006 - DOI - PMC - PubMed

LinkOut - more resources