. 2019 Nov;17(11):2123-2142.
doi: 10.1111/pbi.13127. Epub 2019 Apr 26.

Drought-responsive genes, late embryogenesis abundant group3 (LEA3) and vicinal oxygen chelate, function in lipid accumulation in Brassica napus and Arabidopsis mainly via enhancing photosynthetic efficiency and reducing ROS

Affiliations

Drought-responsive genes, late embryogenesis abundant group3 (LEA3) and vicinal oxygen chelate, function in lipid accumulation in Brassica napus and Arabidopsis mainly via enhancing photosynthetic efficiency and reducing ROS

Yu Liang et al. Plant Biotechnol J. 2019 Nov.

Abstract

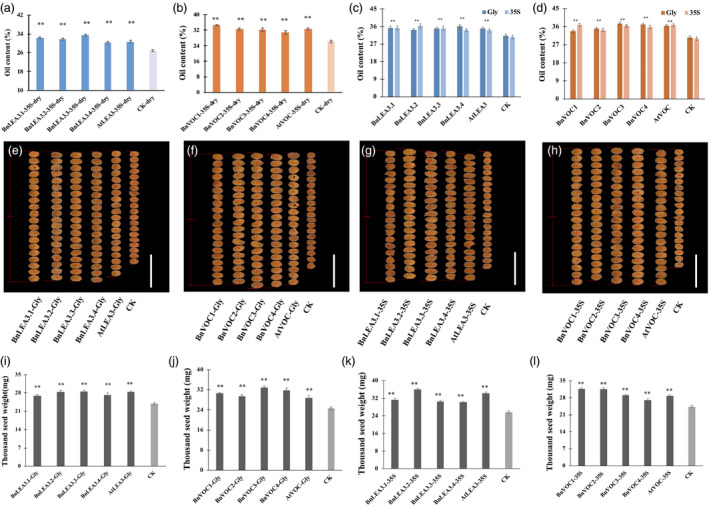
Drought is an abiotic stress that affects plant growth, and lipids are the main economic factor in the agricultural production of oil crops. However, the molecular mechanisms of drought response function in lipid metabolism remain little known. In this study, overexpression (OE) of different copies of the drought response genes LEA3 and VOC enhanced both drought tolerance and oil content in Brassica napus and Arabidopsis. Meanwhile, seed size, membrane stability and seed weight were also improved in OE lines. In contrast, oil content and drought tolerance were decreased in the AtLEA3 mutant (atlea3) and AtVOC-RNAi of Arabidopsis and in both BnLEA-RNAi and BnVOC-RNAi B. napus RNAi lines. Hybrids between two lines with increased or reduced expression (LEA3-OE with VOC-OE, atlea3 with AtVOC-RNAi) showed corresponding stronger trends in drought tolerance and lipid metabolism. Comparative transcriptomic analysis revealed the mechanisms of drought response gene function in lipid accumulation and drought tolerance. Gene networks involved in fatty acid (FA) synthesis and FA degradation were up- and down-regulated in OE lines, respectively. Key genes in the photosynthetic system and reactive oxygen species (ROS) metabolism were up-regulated in OE lines and down-regulated in atlea3 and AtVOC-RNAi lines, including LACS9, LIPASE1, PSAN, LOX2 and SOD1. Further analysis of photosynthetic and ROS enzymatic activities confirmed that the drought response genes LEA3 and VOC altered lipid accumulation mainly via enhancing photosynthetic efficiency and reducing ROS. The present study provides a novel way to improve lipid accumulation in plants, especially in oil production crops.

Keywords: VOC; Brassica napus; LEA3; drought tolerance; lipid accumulation; photosynthetic efficiency; reactive oxygen species.


Conflict of interest statement

The authors declare no conflict of interest.

Figures

Figure 1
Figure 1
Drought tolerance and oil content of the atlea3 mutant and complementation of the full‐length AtLEA3 gene into atlea3. (a): Schematic diagram of the T‐DNA insertion mutant used in this study (atlea3). (b): Phenotype of the atlea3 mutant, HB (complementary vector transformed into atlea3) and WT under normal, drought and rewatering conditions. (c): DAB staining of WT (i), atlea3 (ii) and HB (iii). The number below indicates the quantitative data of H2O2 content, and unit is nmol/g FW. (d and e): Seed and leaf sections of WT, atlea3 and HB under drought stress. Bar = 500 μm. (f): SEM observation of leaves of WT, atlea3 and HB under drought conditions. Bar = 100 μm. (g): Images of mutant, HB and WT plants in a thermal imaging system under drought conditions. (h): Relative expression levels of genes in the TAG synthetic pathway in HB and atlea3 under drought conditions. LPAT: lysophosphatidic acid acyltransferase, LPP: lipid phosphate phosphatase, DGAT: diacylglycerol acyltransferase, PDAT: phospholipid:diacylglycerol acyl transferase, CCT: choline‐phosphate:CTP cytidylyltransferase, AAPT: aminoalcohol‐phosphotransferase. (i): Oil contents of the HB lines and mutants under drought conditions. (j): FA compositions of the HB lines and mutants under drought conditions. (k–o): Leaf temperatures, chlorophyll a + b contents, RWCs, TSWs and anthocyanin contents of the HB lines and mutants under drought conditions. All the results are represented as the mean ± standard deviation (STD; n = 3). Statistically significant differences were determined using a two‐tailed paired Student's t‐test compared with WT plants under similar conditions, and the results are indicated by **P < 0.01 and *P < 0.05.
Figure 2
Figure 2
AtVOCRNAi lines have lower oil production and lower drought tolerance. (a): Schematic diagram of the RNA interference vector built in this study. (b): Phenotype of AtVOCRNAi and the empty vector and WT controls. (c): Thermal images of AtVOCRNAi and WT under drought conditions. (d): DAB staining of WT (i) and AtVOCRNAi (ii). Bar = 1 cm. The number below indicates the quantitative data of H2O2 content, and unit is nmol/g FW (e and f): Seed and leaf sections of WT and AtVOCRNAi under drought stress. Bar = 500 μm. (g): SEM observation of leaves of WT and AtVOCRNAi under drought conditions. Bar = 100 μm. (h): Oil content changes in the AtVOCRNAi lines. (i): FA composition of the AtVOCRNAi lines. (j): Relative expression levels of genes in the TAG synthetic pathway in AtVOCRNAi under drought stress. LPAT, lysophosphatidic acid acyltransferase; LPP, lipid phosphate phosphatase; DGAT, diacylglycerol acyltransferase; PDAT, phospholipid:diacylglycerol acyl transferase; CCT, choline‐phosphate; CTP, cytidylyltransferase; AAPT, aminoalcohol‐phosphotransferase. (k–o): Physiological indexes and TSWs of RNAi and WT under drought conditions. All the results are represented as the mean ± standard deviation (STD; n = 3). Statistically significant differences were determined using a two‐tailed paired Student's t‐test compared with WT plants under similar conditions, and the results are indicated by **P < 0.01 and *P < 0.05.
Figure 3
Figure 3
Overexpression of the BnLEA3, BnVOC , AtLEA3 and AtVOC genes resulted in higher oil content, seed size and seed weight. (a and b): Oil contents of transgenic Arabidopsis seeds under drought conditions. (c and d): Oil contents of transgenic Arabidopsis seeds under normal conditions. (e–h): Seed sizes of LEA‐ and VOCOE lines (Gly and 35S) and CK. Bar = 1 mm. (i–l): TSWs of LEA‐ and VOCOE lines (Gly and 35S) and CK. The data represent the mean and standard deviation (STD) of three biological replicates (n = 3). Statistically significant differences were determined using a two‐tailed paired Student's t‐test compared with WT plants under similar conditions, and the results are indicated by **P < 0.01.
Figure 4
Figure 4
Transgenic B. napus showed improved drought tolerance. (a): Schematic diagram of the OE vector transformed into B. napus in this study. (b): Southern blotting was used to confirm the stable integration of the transgene in B. napus. (c): Western blotting was performed to check the expression of protein in WT (CK) and transgenic plants. (d): Phenotypes of transgenic plants and WT plants in the drought treatment. Bar = 5 cm. (e): Thermal images of transgenic and WT B. napus under drought conditions. (f): DAB staining of transgenic and WT B. napus under drought conditions. The number below indicates the quantitative data of H2O2 content, and unit is nmol/g FW. All the results are represented as the mean ± standard deviation (STD; n = 3).
Figure 5
Figure 5
Transgenic B. napus showed changes in oil content and seed size. (a and b): Oil contents of transgenic B. napus lines. (c): TEM observation of transgenic and WT seeds. Bar = 10 μm. (d): Seed sizes of transgenic plants, hybrids (H‐35S: OE hybrids; H‐RNAi: RNAi hybrids) and WT. (e): Average oil contents of transgenic and hybrid plants under drought conditions. (f): TSWs of transgenic and hybrid plants. All the results are represented as the mean ± standard deviation (STD; n = 3). Statistically significant differences were determined using a two‐tailed paired Student's t‐test compared with WT plants under similar conditions, and the results are indicated by **P < 0.01.
Figure 6
Figure 6
RNA‐seq analysis of BnLEAOE, AtLEAOE, atlea3 and WT under short‐ and long‐term drought stress. (a and b): Cluster heatmaps of DEGs in the leaves (a) and seeds (b) of plants differentially expressing LEA under drought conditions. (c–f): Venn diagrams showing the numbers of DEGs in different genotypes of Arabidopsis (P ≦ 0.05, false discovery rate < 0.05). (g–j): Significantly enriched GO terms (coloured in red and yellow) of the DEGs in the seeds of differential LEA expression lines in the long‐term (g) and short‐term (i) drought treatments and the corresponding leaves in the long‐term (j) and short‐term (h) drought treatments. (k and l): Major enriched KEGG pathways and the expression of the related genes in the leaves (k) and seeds (l) of plants differentially expressing LEA.
Figure 7
Figure 7
Transcriptome analysis of plants differentially expressing VOC and WT plants under short‐ and long‐term drought stress. (a and b): Cluster heatmaps of DEGs in the leaves (a) and seeds (b) of plants differentially expressing VOC under drought conditions. (c–f): Venn diagrams showing the numbers of DEGs in different genotypes of Arabidopsis (≦ 0.05, false discovery rate < 0.05). (g–j): Significantly enriched GO terms (coloured in red and yellow) of the DEGs in the seeds of differential VOC expression lines in the long‐term (g) and short‐term (h) drought treatments and the corresponding leaves in the long‐term (j) and short‐term (i) drought treatments. (k and l): Major enriched KEGG pathways and the expression of the related genes in the seeds (k) and leaves (l) of plants differentially expressing VOC.
Figure 8
Figure 8
Hybrids of LEA and VOC in B. napus and Arabidopsis. (a): Performance of Arabidopsis hybrids in the drought treatment. (b): Thermal images of Arabidopsis hybrids in the drought treatment. (c and d): DAB staining of Arabidopsis (c) and B. napus (d) hybrids in the drought treatment. The number below indicates the quantitative data of H2O2 content, and unit is nmol/g FW. (E): Performance of B. napus hybrids in the drought treatment. Bar = 5 cm. (f): Thermal images of B. napus hybrids in the drought treatment. (g): SEM observations of B. napus hybrids in the drought treatment. Bar = 5 μm. (h): Seed sizes of Arabidopsis hybrids. (i): Oil contents of Arabidopsis hybrids. (j): TSWs of Arabidopsis hybrids. (k and l): Relative expression levels of key genes in transgenic and hybrid B. napus under normal conditions (k) and drought conditions (l). All the results are represented as the mean ± standard deviation (STD; n = 3). Statistically significant differences were determined using a two‐tailed paired Student's t‐test compared with WT plants under similar conditions, and the results are indicated by **P < 0.01.
Figure 9
Figure 9
Photosynthetic efficiency of transgenic B. napus under drought stress. (a–f): Comparison of various photosynthetic and physiological parameters of WT and transgenic oilseed rape under drought conditions. (a) Transpiration rate, (b) stomatal conductance, (c) chlorophyll content, (d) Fv/Fm, (e) photosynthetic rate and (f) RWC were measured. All the results are represented as the mean ± standard deviation (STD; n = 3). Statistically significant differences were determined using a two‐tailed paired Student's t‐test compared with WT plants under similar conditions, and the results are indicated by **P < 0.01 and *P < 0.05.
Figure 10
Figure 10
Activity of the oxidation system and glyoxalase system of BnVOC transgenic B. napus under drought stress. (a–k): GLY I activity (a), GLY II activity (b), MG content (c), H2O2 content (d), MDA content (e), GSH content (f), GSSG content (g), GSH/GSSG ratio (h), LOX activity (i), CAT activity (j) and SOD activity (k) in transgenic and hybrid B. napus under drought stress. All the results are represented as the mean ± standard deviation (STD; n = 3). Statistically significant differences were determined using a two‐tailed paired Student's t‐test compared with WT plants under similar conditions, and the results are indicated by **P < 0.01 and *P < 0.05.
Figure 11
Figure 11
Model of LEA and VOC functional regulation in plants. (a): Schematic representation of the influence of LEA genes on FA metabolic and catabolic biosynthetic pathways under drought stress. Photosynthetic efficiency, membrane stability and lipid synthesis and transportation are improved under drought conditions, resulting in higher seed oil contents in B. napus and Arabidopsis. The plant hormone signalling pathways lead to stomatal closure, improved membrane stability and reduced metal ion toxicity, conferring drought tolerance in OE leaves. HMA, heavy metal‐associated domain protein; G6P, glucose‐6‐phosphate; ACBP, Acyl‐CoA binding proteins; ER, endoplasmic reticulum; ACP, acyl carrier protein; LACS9, long‐chain acyl‐CoA synthetase 9; HSP, heat shock factor protein. (b): The effect of VOC genes on the ROS system reduces H2O2 and MG contents, which improves oil content and drought tolerance by reducing lipid peroxidation and membrane damage. ABF, ABRE binding factors; ABA, abscisic acid; PP2C, protein phosphatase 2C; SNRK2, SNF‐related kinase 2; CRK, cysteine‐rich receptor‐like kinase; hv, irradiation with light; PS I, photosystem I; GPOX, glutathione peroxidase; GR, glutathione reductase.

References

    1. Arisz, S.A. , Heo, J.‐Y. , Koevoets, I.T. , Zhao, T. , van Egmond, P. , Meyer, J. , Zeng, W. , et al. (2018) Diacylglycerol acyltransferase 1 contributes to freezing tolerance. Plant Physiol. 177, 1410. - PMC - PubMed
    1. Basu, U. , Good, A.G. and Taylor, G.J. (2001) Transgenic Brassica napus plants overexpressing aluminium‐induced mitochondrial manganese superoxide dismutase cDNA are resistant to aluminium. Plant, Cell Environ. 24, 1269–1278.
    1. Battaglia, M. , Olvera‐Carrillo, Y. , Garciarrubio, A. , Campos, F. and Covarrubias, A.A. (2008) The enigmatic LEA proteins and other hydrophilins. Plant Physiol. 148, 6–24. - PMC - PubMed
    1. Bremer, A. , Wolff, M. , Thalhammer, A. and Hincha, D.K. (2017) Folding of intrinsically disordered plant LEA proteins is driven by glycerol‐induced crowding and the presence of membranes. FEBS J. 284, 3765. - PubMed
    1. Bright, J. , Desikan, R. , Hancock, J. , Weir, I. and Neill, S. (2006) ABA‐induced NO generation and stomatal closure in Arabidopsis are dependent on H2O2 synthesis. Plant J. 45, 113–122. - PubMed

Publication types

Substances

LinkOut - more resources