. 2019 Sep;25(9):976-986.
doi: 10.1111/cns.13136. Epub 2019 Apr 11.

Urolithin A-activated autophagy but not mitophagy protects against ischemic neuronal injury by inhibiting ER stress in vitro and in vivo

Affiliations

Urolithin A-activated autophagy but not mitophagy protects against ischemic neuronal injury by inhibiting ER stress in vitro and in vivo

Anil Ahsan et al. CNS Neurosci Ther. 2019 Sep.

Abstract

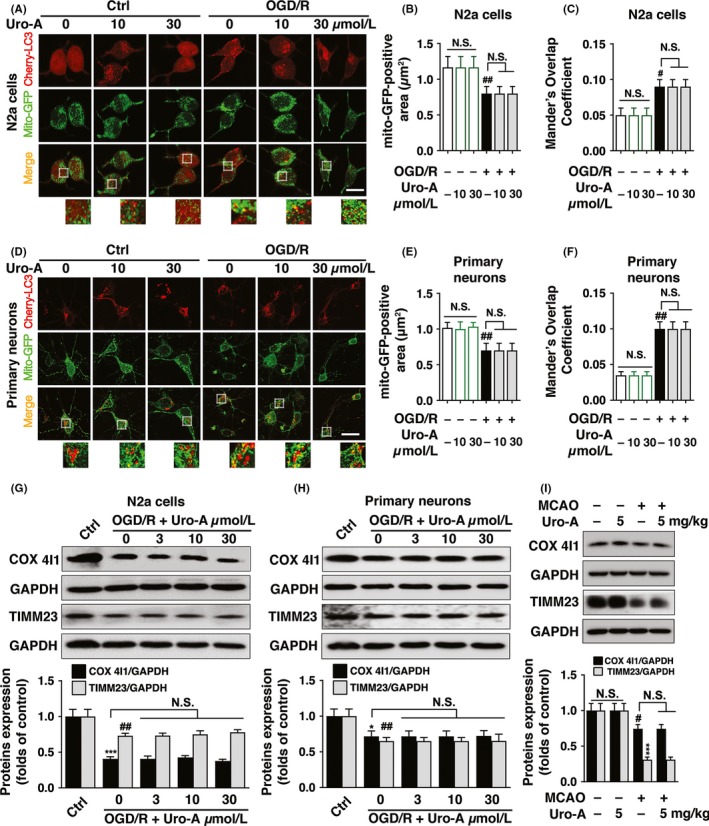
Aim: Mitochondrial autophagy (mitophagy) clears damaged mitochondria and attenuates ischemic neuronal injury. Urolithin A (Uro-A) activates mitophagy in mammal cells and Caenorhabditis elegans. We explored neuroprotection of Uro-A against ischemic neuronal injury.

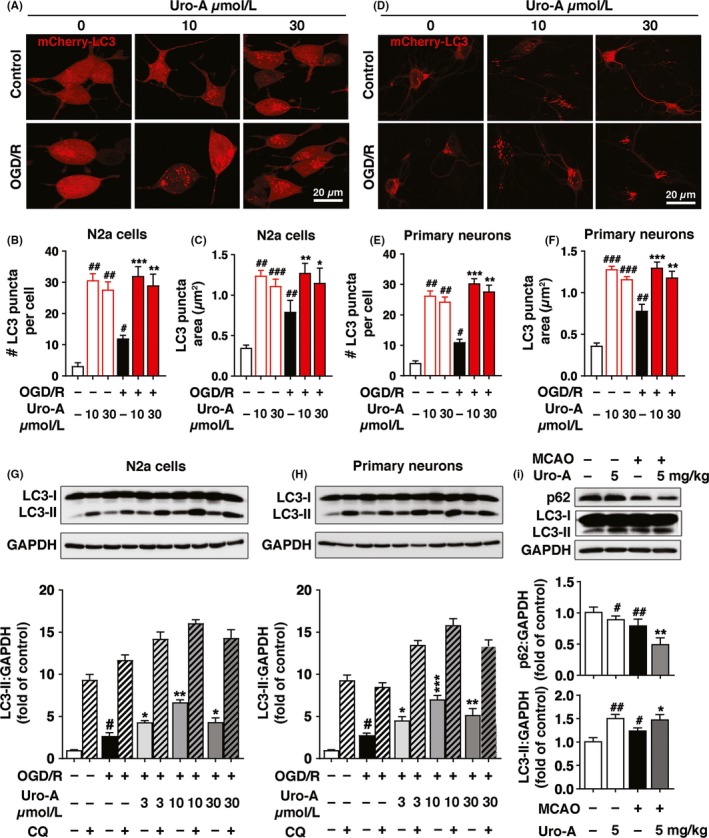
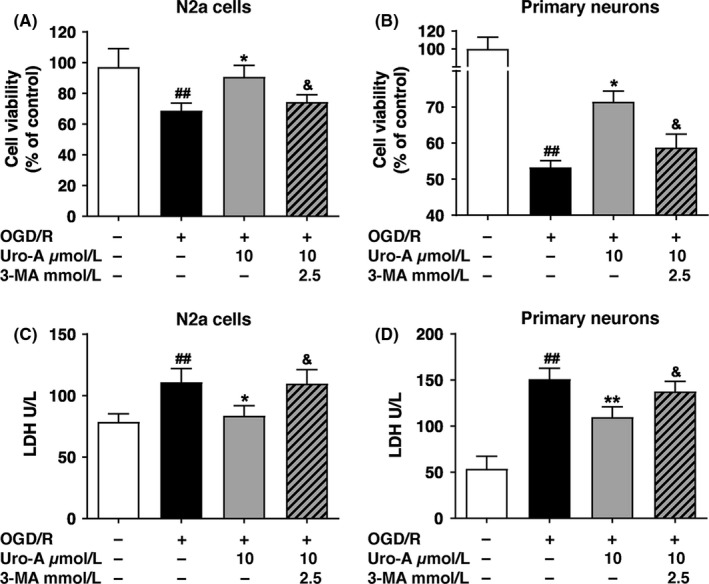
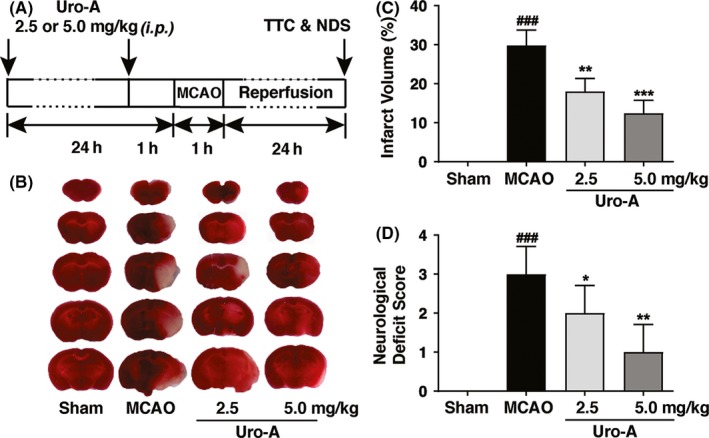
Methods: Mice were subjected to middle cerebral artery occlusion. The brain infarct and neurological deficit scores were measured. The N2a cells and primary cultured mice cortical neurons were subjected to oxygen-glucose deprivation and reperfusion (OGD/R). Uro-A was incubated during OGD/R, and cell injury was determined by MTT and LDH. Autophagosomes were visualized by transfecting mCherry-microtubule-associated protein 1 light chain 3 (LC3). The protein levels of LC3-II, p62, Translocase Of Inner Mitochondrial Membrane 23 (TIMM23), and cytochrome c oxidase subunit 4 isoform 1 (COX4I1) were detected by Western blot. The ER stress markers, activating transcription factor 6 (ATF6) and C/EBP homologous protein (CHOP), were determined by reverse transcription-polymerase chain reaction (RT-PCR).

Results: Urolithin A alleviated OGD/R-induced injury in N2a cells and neurons and reduced ischemic brain injury in mice. Uro-A reinforced ischemia-induced autophagy. Furthermore, Uro-A-conferred protection was abolished by 3-methyladenine, suggesting the requirement of autophagy for neuroprotection. However, mitophagy was not further activated by Uro-A. Instead, Uro-A attenuated OGD/R-induced ER stress, which was abolished by 3-methyladenosine. Additionally, neuroprotection was reversed by ER stress inducer.

Conclusion: Urolithin A protected against ischemic neuronal injury by reinforcing autophagy rather than mitophagy. Autophagy activation by Uro-A attenuated ischemic neuronal death by suppressing ER stress.

Keywords: autophagy/mitophagy; cerebral ischemia; endoplasmic reticulum stress; neuroprotection; urolithin A.


Conflict of interest statement

The authors have no conflict of interest.

Figures

Figure 1
Figure 1
The neuroprotective effect of urolithin A on the viability of N2a cells and primary cultured neurons against OGD/R injury (A, B) Differentiated N2a cells and primary cultured cortical neurons were exposed to OGD for 4 h and 1.5 h, respectively, and treated with 3‐30 µmol/L of Uro‐A for 24 h reperfusion (A) Cell viability of N2a cells and (B) primary cultured cortical neurons was determined by MTT assay (C, D) Differentiated N2a cells and primary cultured cortical neurons were treated as described above, and then, the culture medium was collected to examine lactate dehydrogenase (LDH) activity (C) LDH activity in the culture medium of N2a cells and (D) primary cultured cortical neurons. Differences are significant at #P < 0.05, ##P < 0.01, ###P < 0.001 vs control groups: *P < 0.05 **P < 0.01 vs OGD/R alone groups, NS, not statistically significant of indicated groups. Data are expressed as mean ± SD from five (n = 5) independent experiments
Figure 2
Figure 2
Urolithin A reinforces autophagy in vitro and in vivo after neuronal ischemia. N2a cells and primary cultured neurons were transfected with mCherry‐LC3 and exposed to OGD for 4 h and 1.5 h, respectively, and treated at the concentration of 10 and 30 µmol/L Uro‐A. Images were captured at 3 h after reperfusion by confocal microscopy (A) Fluorescent images of mCherry‐LC3 in N2a cells (B) Columns represent the number of autophagosomes in a single cell (C) Columns represent the area of each LC3 puncta in one N2a cell (D) Representative images of primary cultured neurons (E) Columns represent the number of autophagosomes in a single neuron (F) Columns represent the area of each LC3 puncta in one neuron. At least 50 cells from at least 3 independent experiments were counted in each group (G) N2a cells were exposed to OGD for 4 h.(H) Primary cultured neurons were exposed to OGD for 1.5 h and treated with 3‐30 µmol/L of Uro‐A. At 6 h of reperfusion, LC3‐II and GAPDH levels were determined by Western blot. Semi‐quantitative analysis of LC3‐II bands was shown (lower panel) (I) Mice were subjected to MCAO for 1 h. After 12 h of reperfusion, LC3‐II, p62, and GAPDH levels in ischemic core were assessed by Western blot, n = 5 per group. Semi‐quantitative analysis of LC3‐II and p62 bands was shown (lower panel). Differences are significant at #P < 0.05, ##P < 0.01, # ##P < 0.001 vs control groups: *P < 0.05 **P < 0.01 ***P < 0.001 vs OGD/R alone groups. #P < 0.05, ##P < 0.01 vs. sham group: *P < 0.05 **P < 0.01 vs. MCAO. Data are expressed as mean ± SD values. Scale bar, 20 μm
Figure 3
Figure 3
Autophagy is required for urolithin A conferred neuroprotection (A, B) Differentiated N2a cells and primary cultured cortical neurons were exposed to OGD for 4 h and 1.5 h, respectively, and treated with 10 µmol/L of Uro‐A with or without 3‐MA at concentration 2.5 mmol/L for 24 h reperfusion (A) Cell viability of N2a cells and (B) cell viability of primary cultured neurons were measured by MTT assay (C, D) Differentiated N2a cells and primary cultured cortical neurons were treated as described above, and then, the culture medium was collected to examine LDH activity (C) Lactate dehydrogenase (LDH) level in N2a cells and (D) in primary cultured cortical neurons. Differences are significant at ##P < 0.01 vs control groups: *P < 0.05, **P < 0.01 vs. OGD/R alone groups and &P < 0.05 vs Uro‐A groups. Data are represented as the mean ± SD from at least five (n = 5) independent experiments
Figure 4
Figure 4
Urolithin A does not induce mitophagy in cerebral ischemia models (A‐F) N2a cells and primary cultured cortical neurons were transfected with mCherry‐LC3 and Mito‐GFP vectors to visualize LC3 puncta and mitochondria, respectively. Both cells were subjected to OGD for 4 h and 1.5 h, respectively, and treated at the concentration of 10 and 30 µmol/L Uro‐A. After 3 h of reperfusion, (A) Representative fluorescent images of N2a cells were captured by confocal microscopy (B) Columns represent the mito‐GFP‐positive area of N2a cells (C) Columns represent Mander's overlap coefficient of mito‐GFP and mCherry‐LC3 of N2a cells (D) Representative images of primary cultured neurons (E) Columns represent the mito‐GFP‐positive area of primary cultured neurons (F) Columns represent Mander's overlap coefficient of mito‐GFP and mCherry‐LC3 of primary cultured neurons. At least 30 cells from three independent experiments for each group were included. TIMM23 and COX4I1 protein levels were determined by Western blot analysis after 6 h of reperfusion treated with 3‐30 µmol/L of Uro‐A (G) in N2a cells and (H) in primary cultured neurons. Semi‐quantitative analysis of TIMM23 and COX4I1 bands was shown (lower panel) (I) Mice were subjected to MCAO for 1 h, and the expression of TIMM23 and COX4I1 in ischemic core was assessed by Western blot after 12 h of reperfusion, n = 5 per group. Semi‐quantitative analysis of TIMM23 and COX4I1 bands was shown (lower panel). Differences are significant at #P < 0.05, ##P < 0.01, ***P < 0.001 vs control groups. NS, not statistically significant of indicated groups. Data are shown as mean ± SD. Scale bar, 20 μm
Figure 5
Figure 5
Urolithin A alleviated neuronal ischemic‐induced ER stress (A, B) N2a cells were subjected to OGD for 4 h and treated with 3‐30 µmol/L of Uro‐A for 1‐h reperfusion. Total RNA was collected from N2a cells and used for the RT‐PCR analysis (A) ATF 6 and (B) CHOP (C‐D) The levels of ATF6 and Chop in ischemic core region were measured at 12 h of reperfusion after 1 h of MCAO by RT‐PCR (C) ATF 6 and (D) CHOP (n = 5). The mRNA levels of (E) ATF 6 and (F) CHOP in N2a cells treated with and without 2.5 mmol/L of 3‐MA were normalized to β‐actin (G) Cell viability of N2a cells was measured by MTT after treating with 10 µmol/L of Uro‐A in the presence and absence of thapsigargin at the concentration (300 nmol/L) for 24 h. Differences are significant at # P < 0.05 vs. sham groups, ##P < 0.01, ###P < 0.001 vs control groups, *P < 0.05 vs MCAO, **P < 0.01, ***P < 0.001 vs OGD/R alone groups, &P < 0.05, &&P < 0.01 vs Uro‐A groups, and $P < 0.05 vs TG group. NS, not statistically significant of indicated groups. Data are expressed as mean ± SD, n = 5 per group.
Figure 6
Figure 6
Urolithin A reduced ischemic brain injury in MCAO mice (A) The schematic experimental protocol for in vivo model, mice were administrated with 2.5 and 5.0 mg/kg of Uro‐A (intraperitoneal) twice before MCAO surgery and subjected to MCAO for 1 h followed by 24‐h reperfusion (B) Representative TTC‐stained brain slices after 24 h of MCAO are shown (C) The infarct volume between vehicle and Uro‐A (2.5 or 5.0 mg/kg)‐treated MCAO mice was expressed as the ratio of (infarct volume/the whole brain volume) ×100%. The white area defined the infarct area (D) Neurological deficit scores (NDS) were measured at 24 h after surgery. Differences are significant at ###P < 0.001 vs sham group, *P < 0.05 and **P < 0.01 vs MCAO group. Data are presented as mean ± SD from seven (n = 7) mice in each group

References

    1. Feigin VL, Norrving B, Mensah GA. Global burden of stroke. Circ Res. 2017;120(3):439‐448. - PubMed
    1. Doyle KP, Simon RP, Stenzel‐Poore MP. Mechanisms of ischemic brain damage. Neuropharmacology. 2008;55(3):310‐318. - PMC - PubMed
    1. Dirnagl U, Endres M. Found in translation: preclinical stroke research predicts human pathophysiology, clinical phenotypes, and therapeutic outcomes. Stroke. 2014;45(5):1510‐1518. - PubMed
    1. Dikic I, Elazar Z. Mechanism and medical implications of mammalian autophagy. Nat Rev Mol Cell Biol. 2018;19(6):349‐364. - PubMed
    1. Gabryel B, Kost A, Kasprowska D. Neuronal autophagy in cerebral ischemia–a potential target for neuroprotective strategies? Pharmacol Rep. 2012;64(1):1‐15. - PubMed

Publication types

MeSH terms

Substances