. 2019 Apr 11:8:e42819.
doi: 10.7554/eLife.42819.

Shank3 modulates sleep and expression of circadian transcription factors

Affiliations

Shank3 modulates sleep and expression of circadian transcription factors

Ashley M Ingiosi et al. Elife. .

Abstract

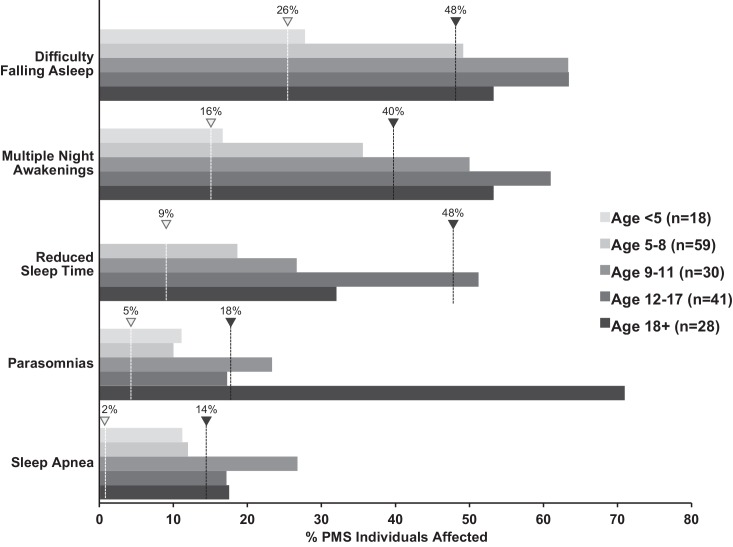
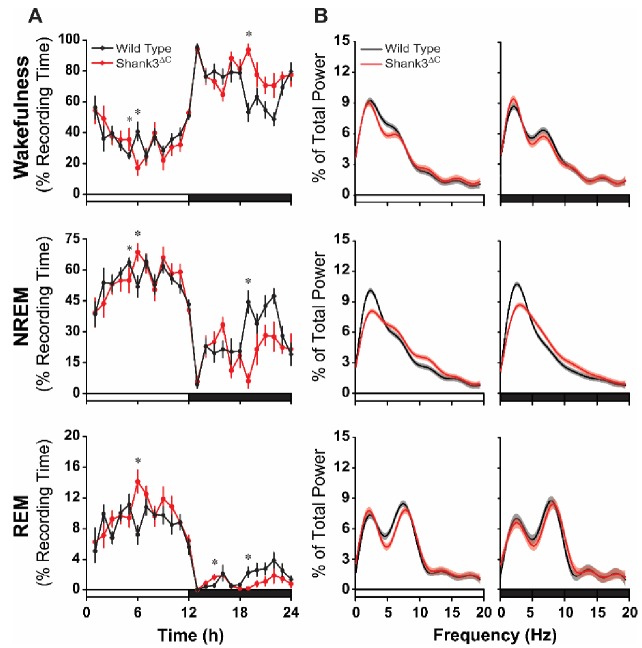
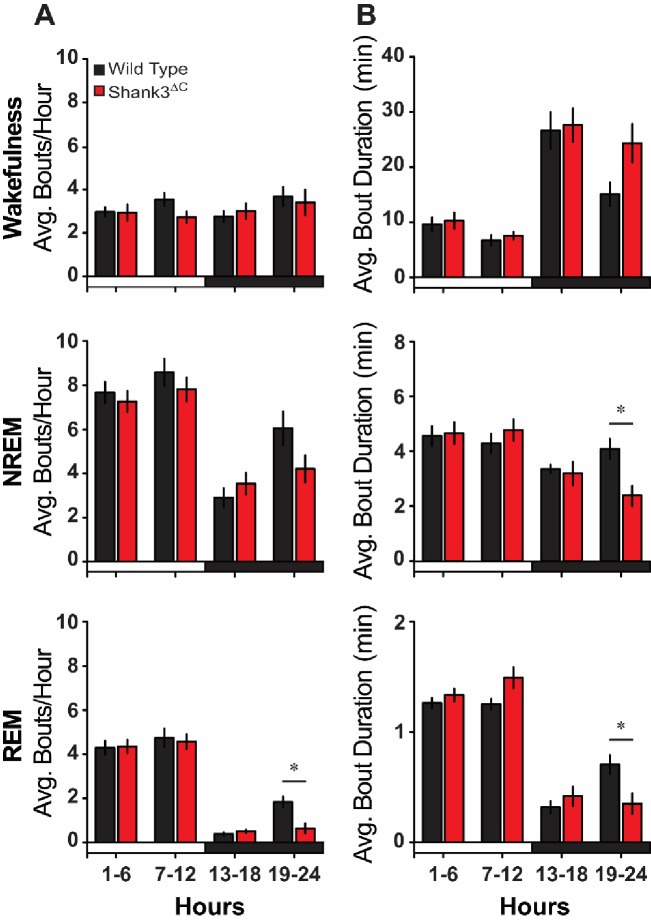
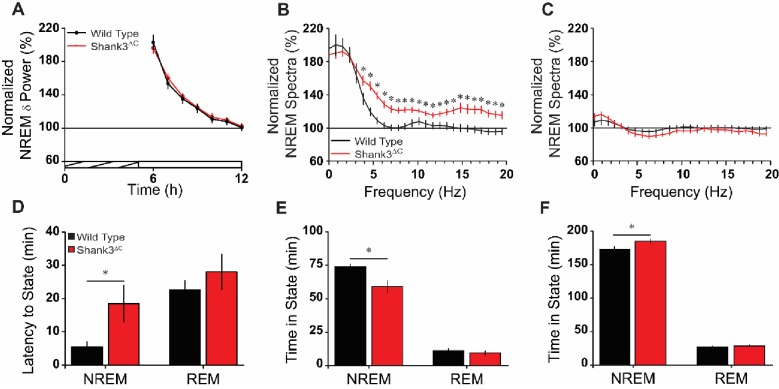
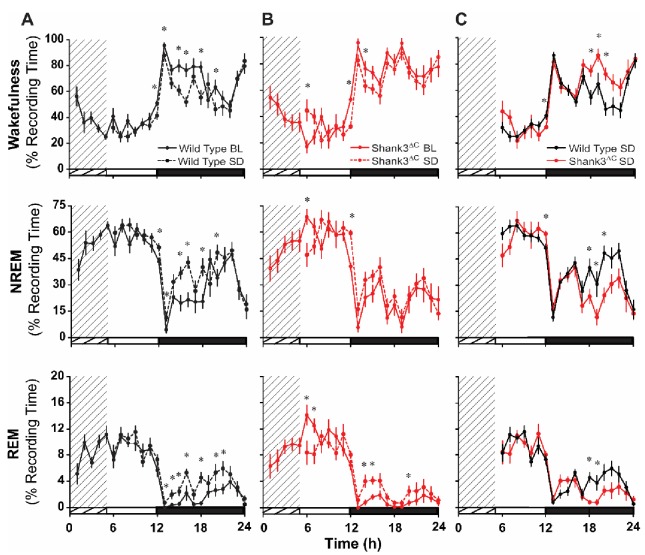
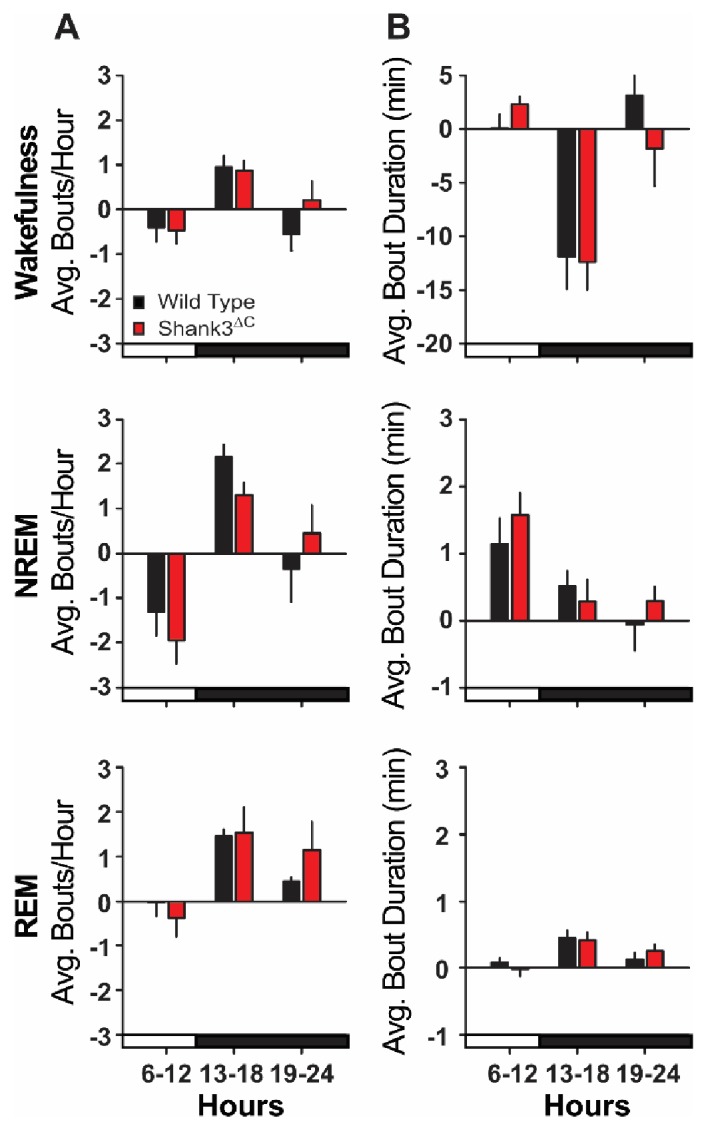
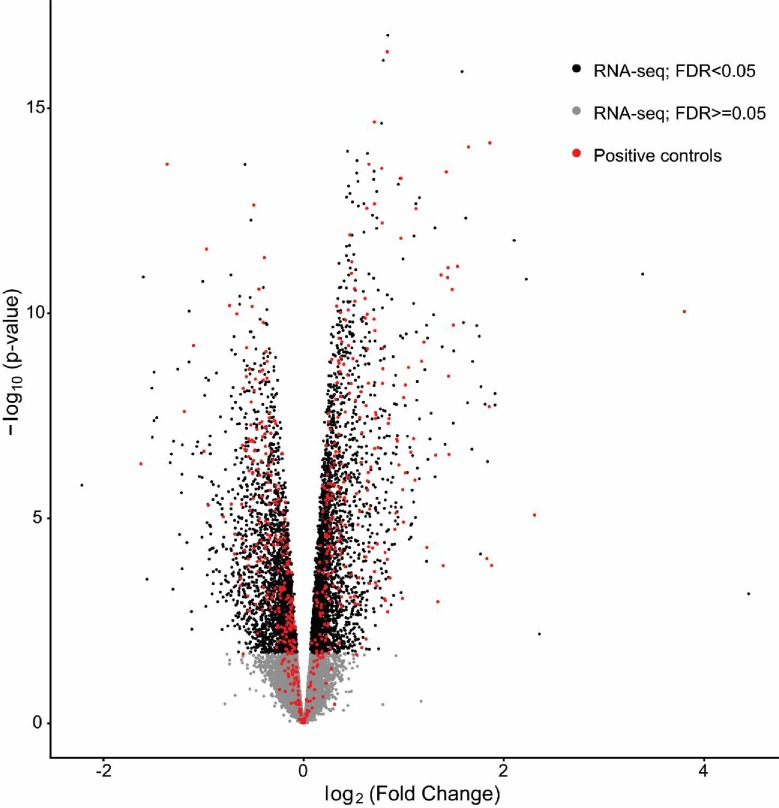
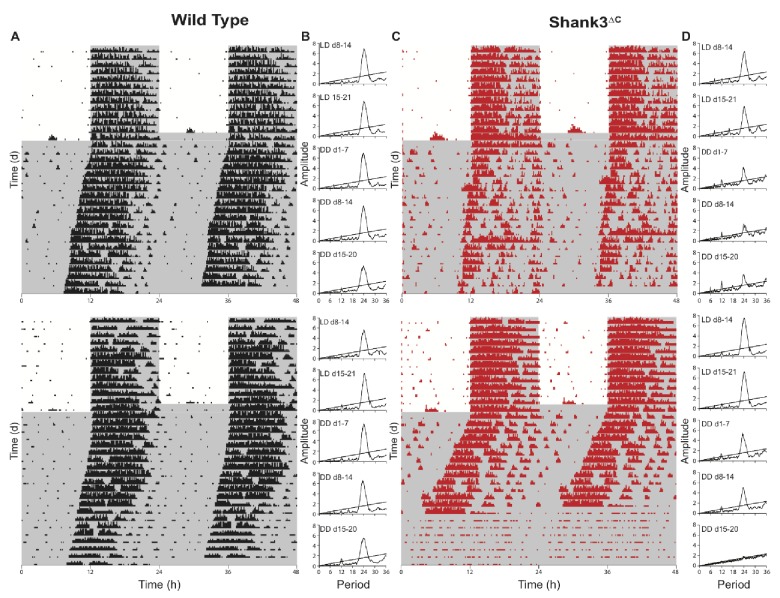
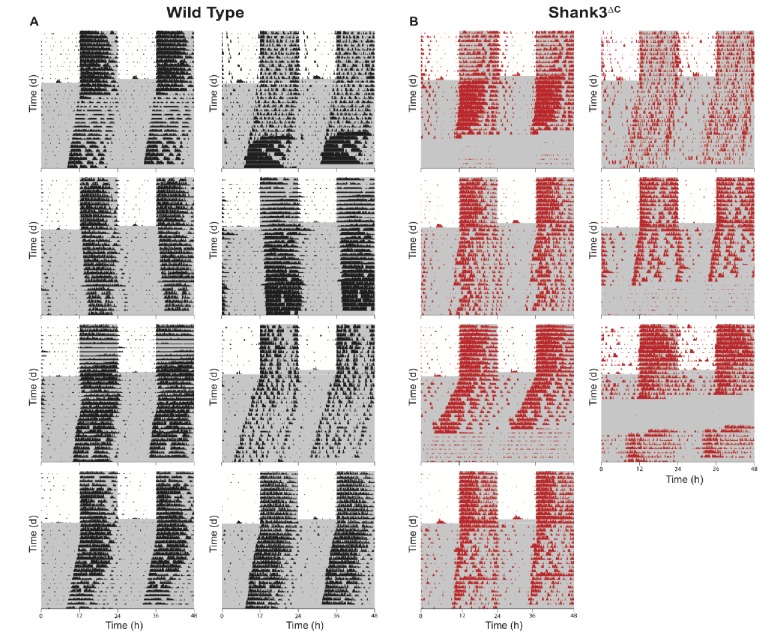
Autism Spectrum Disorder (ASD) is the most prevalent neurodevelopmental disorder in the United States and often co-presents with sleep problems. Sleep problems in ASD predict the severity of ASD core diagnostic symptoms and have a considerable impact on the quality of life of caregivers. Little is known, however, about the underlying molecular mechanisms of sleep problems in ASD. We investigated the role of Shank3, a high confidence ASD gene candidate, in sleep architecture and regulation. We show that mice lacking exon 21 of Shank3 have problems falling asleep even when sleepy. Using RNA-seq we show that sleep deprivation increases the differences in prefrontal cortex gene expression between mutants and wild types, downregulating circadian transcription factors Per3, Bhlhe41, Hlf, Tef, and Nr1d1. Shank3 mutants also have trouble regulating wheel-running activity in constant darkness. Overall, our study shows that Shank3 is an important modulator of sleep and clock gene expression.

Keywords: Shank3; autism spectrum disorder; mouse; neuroscience; sleep.


Conflict of interest statement

AI, HS, TW, KS, DR, LR, EM, DR, MF, LP No competing interests declared

Figures

Figure 1.
Figure 1.. Increased incidence of sleep problems reported in individuals with Phelan-McDermid syndrome (PMS) compared to typically developing (TD) individuals.
Dashed line indicates median incidence observed in TD (white marker) and ASD (black marker) populations (values from Figure 1—source data 1).
Figure 2.
Figure 2.. Shank3∆C mice sleep less during the dark period and show altered EEG spectral power under baseline conditions.
The rows represent the vigilance states of wakefulness (top), NREM sleep (middle), and REM sleep (bottom). (A) Time spent in wakefulness and sleep shown as percentage of recording time per hour. Values are means ± SEM. Repeated measures ANOVA with posthoc pairwise comparisons using Sidak correction; *p<0.05, difference from wild type. (B) EEG spectral power normalized as a percentage of the total state-specific EEG power for the light period (left) and dark period (right) fit to smooth curves (solid lines) and expressed with 95% confidence intervals (gray and red shading). Non-overlap of the 95% confidence interval denotes statistically significant differences. The open bars on the x-axis denote the light period and the filled bars denote the dark period of the light:dark cycle. Wild type (n = 10) and Shank3∆C (n = 10) mice.
Figure 2—figure supplement 1.
Figure 2—figure supplement 1.. Baseline sleep bout analysis.
(A) Average number of state-specific bouts per hour shown in 6 hr blocks. (B) Average bout duration (min) per hour shown in 6 hr blocks. Repeated measures ANOVA with posthoc pairwise comparisons using Sidak correction. Values are means ± SEM for wild type (n = 10) and Shank3∆C (n = 10) mice. *p<0.05, difference from wild type.
Figure 3.
Figure 3.. Shank3∆C mice take longer to fall asleep and sleep less after sleep deprivation.
(A) Normalized NREM delta (δ; 0.5–4 Hz) power during recovery sleep post-sleep deprivation. The cross-hatched bar on the x-axis denotes the 5 hr sleep deprivation period and the open bar denotes the remaining light period. Repeated measures ANOVA. (B) Normalized NREM spectra for the first 2 hr post-sleep deprivation (hours 6–7; significant from 3.9 to 19.5 Hz). One-way ANOVA with posthoc unpaired t-tests using Benjamini-Hochberg correction. (C) Normalized NREM spectra for the last 2 hr of the light period post-sleep deprivation (hours 11–12). One-way ANOVA. (D) Latency to enter NREM sleep and REM sleep after sleep deprivation. Unpaired t-test. (E) Time in NREM sleep and REM sleep for the first 2 hr post-sleep deprivation (hours 6–7). Unpaired t-test. (F) Time in NREM sleep and REM sleep for the remaining 5 hr of light period post-sleep deprivation (hours 8–12). Unpaired t-test. Values are means ± SEM for wild type (n = 10; black) and Shank3∆C (n = 10; red) mice. *p<0.05, difference from wild type.
Figure 3—figure supplement 1.
Figure 3—figure supplement 1.. Shank3∆C mice sleep less than wild type type after sleep deprivation.
The rows represent the vigilance states of wakefulness (top), NREM sleep (middle), and REM sleep (bottom). (A – B) Time in state shown as percentage of recording time per hour comparing baseline and sleep deprived conditions for wild type mice (A) and Shank3∆C mice (B). Repeated measures ANOVA with posthoc pairwise comparisons using Sidak correction; *p<0.05, difference from baseline. (C) Time in state shown as percentage of recording time per hour after sleep deprivation. Repeated measures ANOVA with posthoc pairwise comparisons using Sidak correction; *p<0.05, difference from wild type. The cross-hatching for hours 1–5 denotes the 5 hr sleep deprivation period, the open bars on the x-axis denote the light period, and the filled bars on the x-axis denote the dark period of the light:dark cycle. Values are means ± SEM for wild type (n = 10) and Shank3∆C (n = 10) mice.
Figure 3—figure supplement 2.
Figure 3—figure supplement 2.. Bout analysis after sleep deprivation.
(A) Average number of state-specific bouts per hour (difference scores) shown in 7 hr (remaining light period) and 6 hr blocks. (B) Average bout duration (min) per hour (difference scores) shown in 7 hr (remaining light period) and 6 hr blocks. Difference scores were calculated by subtracting baseline (BL) values from sleep deprivation (SD) values. Repeated measures ANOVA. Values are means ± SEM for wild type (n = 10) and Shank3∆C (n = 10) mice. Significance as p<0.05.
Figure 4.
Figure 4.. Sleep deprivation induces a two-fold difference in gene expression between Shank3ΔC and wild type mice.
RNA-seq study of gene expression from prefrontal cortex obtained from adult male Shank3ΔC and wild type mice either under control homecage conditions (HC) or following 5 hr of sleep deprivation (SD). N = 5 mice per group. (A) Principal component analysis of normalized RNA-seq data shows that sleep deprivation is the main source of variance in the data (first principal component, PC1) and genotype is the second (second principal component, PC2). Percent variance explained by each PC is shown on each axis. (B) Venn diagram showing the number of genes differentially expressed at FDR < 0.1 between Shank3ΔC and wild type mice in either control HC conditions or after SD. (C) Heat map of average scaled gene expression for all genes in (B). K-means clustering defined three clusters based on differences in gene expression across all comparisons. Genes belonging to the MAPK pathway and involved in circadian rhythms (see Table 2) are highlighted on the right.
Figure 4—figure supplement 1.
Figure 4—figure supplement 1.. Recovery of positive control genes regulated by sleep deprivation.
Volcano plot of differential expression (−log10 P-value versus log2 fold change) caused by sleep deprivation in wild type animals (HC5 vs SD5). Genes with an FDR < 0.05 are highlighted in black. Positive controls (obtained from Gerstner et al., 2016) as described in the Materials and methods) are highlighted in red. Our RNA-seq analysis is able to detect 78% (454) of the 579 positive control genes obtained by microarrays as differentially expressed at FDR < 0.05.
Figure 5.
Figure 5.. Shank3∆C mice show disruption of running wheel activity in constant darkness.
Representative actograms and periodograms for two wild type and two Shank3∆C mice. Mice were entrained to a 12:12 hr light:dark cycle (LD, 559 ± 4 : 0 ± 0 lux) for two weeks prior to 3 weeks constant darkness (DD, 0 ± 0 lux). Gray shading is representative of the dark period. (A) Actograms for two wild type mice. (B) Corresponding periodograms for wild type mice. (C) Actograms for two Shank3∆C mice. (D) Corresponding periodograms for Shank3∆C mice.
Figure 5—figure supplement 1.
Figure 5—figure supplement 1.. Actograms for all wild type and Shank3∆C mice.
Mice were entrained to a 12:12 hr light:dark cycle (LD, 559 ± 4 : 0 ± 0 lux) for two weeks prior to 3 weeks constant darkness (DD, 0 ± 0 lux). Gray shading is representative of the dark period. (A) Actograms for wild type mice (n = 8). (B) Actograms for Shank3∆C mice (n = 7).

References

    1. Achermann P, Borbely AA. Sleep homeostasis and models of sleep regulation. In: Kryger M, Roth T, Dement W. C, editors. Principles and Practice of Sleep Medicine. 6th Ed. Philadelphia: Elsevier; 2017. pp. 377–387. - DOI
    1. American Psychiatric Association . Diagnostic and Statistical Manual of Mental Disorders. 5th Edition. Arlington, VA: American Psychiatric Association; 2013.
    1. Anders TF, Eiben LA. Pediatric sleep disorders: a review of the past 10 years. Journal of the American Academy of Child & Adolescent Psychiatry. 1997;36:9–20. doi: 10.1097/00004583-199701000-00012. - DOI - PubMed
    1. Andersen IM, Kaczmarska J, McGrew SG, Malow BA. Melatonin for insomnia in children with autism spectrum disorders. Journal of Child Neurology. 2008;23:482–485. doi: 10.1177/0883073807309783. - DOI - PubMed
    1. Angelakos CC, Watson AJ, O'Brien WT, Krainock KS, Nickl-Jockschat T, Abel T. Hyperactivity and male-specific sleep deficits in the 16p11.2 deletion mouse model of autism. Autism Research. 2017;10:572–584. doi: 10.1002/aur.1707. - DOI - PMC - PubMed

Publication types

Substances

Associated data