. 2018 Dec 1;94(12):fiy185.
doi: 10.1093/femsec/fiy185.

The all-intracellular order Legionellales is unexpectedly diverse, globally distributed and lowly abundant

Affiliations

The all-intracellular order Legionellales is unexpectedly diverse, globally distributed and lowly abundant

Tiscar Graells et al. FEMS Microbiol Ecol. .

Abstract

Legionellales is an order of the Gammaproteobacteria, only composed of host-adapted, intracellular bacteria, including the accidental human pathogens Legionella pneumophila and Coxiella burnetii. Although the diversity in terms of lifestyle is large across the order, only a few genera have been sequenced, owing to the difficulty to grow intracellular bacteria in pure culture. In particular, we know little about their global distribution and abundance. Here, we analyze 16/18S rDNA amplicons both from tens of thousands of published studies and from two separate sampling campaigns in and around ponds and in a silver mine. We demonstrate that the diversity of the order is much larger than previously thought, with over 450 uncultured genera. We show that Legionellales are found in about half of the samples from freshwater, soil and marine environments and quasi-ubiquitous in man-made environments. Their abundance is low, typically 0.1%, with few samples up to 1%. Most Legionellales OTUs are globally distributed, while many do not belong to a previously identified species. This study sheds a new light on the ubiquity and diversity of one major group of host-adapted bacteria. It also emphasizes the need to use metagenomics to better understand the role of host-adapted bacteria in all environments.

Keywords: amplicons; geographical distribution; host-adapted bacteria; legionella; legionellales; metagenomics.


Figures

Figure 1.
Figure 1.
Distribution of samples across experiment types and gammaproteobacterial orders. In all panels except D, x scales are logarithmic and y-axes show the number of samples for that given number of reads. Experiment types (panels A–C) according to the legend right below; order (D–F) according to the lower legend. Distributions, per experiment type, of (A) total number of reads per run, (B) total number of OTUs per run and (C) fraction of reads attributed to Legionellales. Number of positive samples per order (D). Distributions, per gammaproteobacterial order, of (E) the fraction of reads attributed to the order, and number of OTUs belonging to the order (F).
Figure 2.
Figure 2.
Relative abundance and diversity of Legionellales OTUs in different biomes. The left panel (violin plots) represents the fraction of Legionellales reads in samples containing at least one Legionellales read in a representative run (LPRs, 20 014 out of 87 940 samples or 22.6%). The x scale (logarithmic) extends from 10−5 (1 in 10 000 reads) to 1. The right panel displays the number of Legionellales OTUs per LPR. The right column indicates the number of positive samples (i.e. samples with at least one Legionellales OTU) in that biome and in the categories that have been collapsed into this one (but not the descendant categories that were kept separate), and what per centage of the total samples for that biome it represents. Colors according to the group of biomes. The rows are sorted by increasing fraction of positive samples in that biome (top to bottom).
Figure 3.
Figure 3.
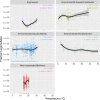
Effect of temperature on the abundance of Legionellales. For each biome group for which enough temperature measures were available (n > 10), temperature is represented against the fraction of Legionellales reads, in a logarithmic scale (y-axis). Human samples were not considered. Temperature was available for 4074 samples. A local regression curve (LOESS) is displayed on each panel. Samples for which no Legionellales reads were found are represented at the bottom of the y-axis but were not used to calculate the regression curve. The rho and P-value of a Spearman's rank correlation test are displayed on each panel: for these, the test was performed on non-logarithmically transformed values, including Legionellales-negative samples.
Figure 4.
Figure 4.
Heatmap based on the prevalence of abundant Legionellales OTUs in 25 different biomes. Rows correspond to biomes, and columns to the 804 OTUs appearing at least once in the 5MALOs of any sample. Color scale represents the number of times (in log10) each OTU is found in the 5MALOs most abundant in that biome. The top row gives the family (if available) for each OTU (color legend to the right).
Figure 5.
Figure 5.
Maximum-likelihood phylogenetic tree of Legionellales. The tree is based on all SSU rRNA reads attributed to Legionellales in Silva 128 and reads attributed to Legionellales in the samples analyzed in this study. The location on the tree of the known genera is indicated by arrows. To improve readability, all branches leading to reads attributed to L. pneumophila were collapsed. Blue dots indicate OTUs from the Sala silver mine samples; green dots indicate OTUs from the Uppland samples.
Figure 6.
Figure 6.
Geographical distribution of Legionellales in selected environments. Each panel represents one of the six selected groups of environments or biomes. The sampling location is represented with a dot. Legionellales-negative samples are shown in white. LPRs are colored according to the fraction of Legionellales reads. A large fraction of the samples in the Engineered category (upper left panel) come from bioreactors and fermenters. It includes all ‘Engineered’ sub-categories except: Built environment, Food production, Solid waste:Composting, and Wastewater (which is shown separately on the upper right panel). The distribution for all 21 biomes is shown in Supplementary Fig. S6.

References

    1. Andrews S. FastQC. http://www.bioinformatics.babraham.ac.uk/projects/fastqc/ 2010.
    1. Boamah DK, Zhou G, Ensminger AW et al. . From many hosts, one accidental pathogen: The diverse protozoan hosts of legionella. Front cell infect microbiol. 2017;7:477. - PMC - PubMed
    1. Bolger AM, Lohse M, Usadel B. Trimmomatic: a flexible trimmer for Illumina sequence data. Bioinformatics. 2014;30:2114–20. - PMC - PubMed
    1. Bouchon D, Cordaux R, Grève P. Rickettsiella, intracellular pathogens of Arthropods. Manipulative Tenants: Bacteria associated with Arthropods, In: Zchori-Fein E, Bourtzis K, (eds). pp. 127–45.. CRC Press, Boca Raton, FL; 2011.
    1. Carvalho FRS, Nastasi FR, Gamba RC et al. . Occurrence and diversity of legionellaceae in polar lakes of the antarctic peninsula. Curr Microbiol. 2008;57:294–300. - PubMed

Publication types

MeSH terms