

Inhibition of glycolysis disrupts cellular antioxidant defense and sensitizes HepG2 cells to doxorubicin treatment
- PMID: 30973680
- PMCID: PMC6487699
- DOI: 10.1002/2211-5463.12628
Inhibition of glycolysis disrupts cellular antioxidant defense and sensitizes HepG2 cells to doxorubicin treatment
Abstract
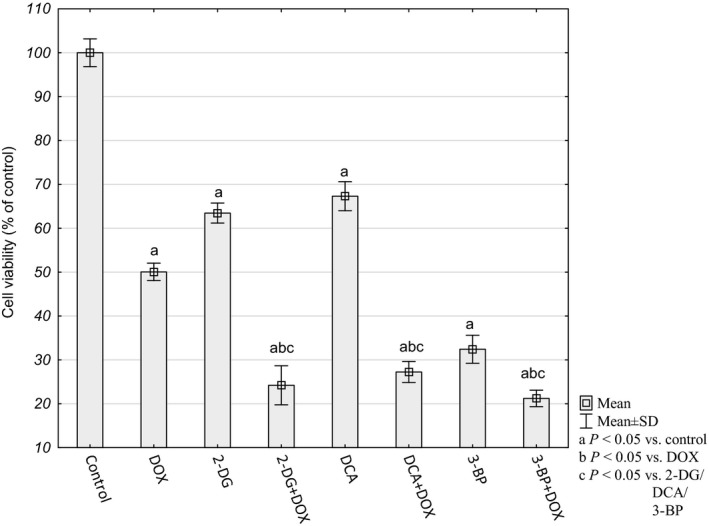
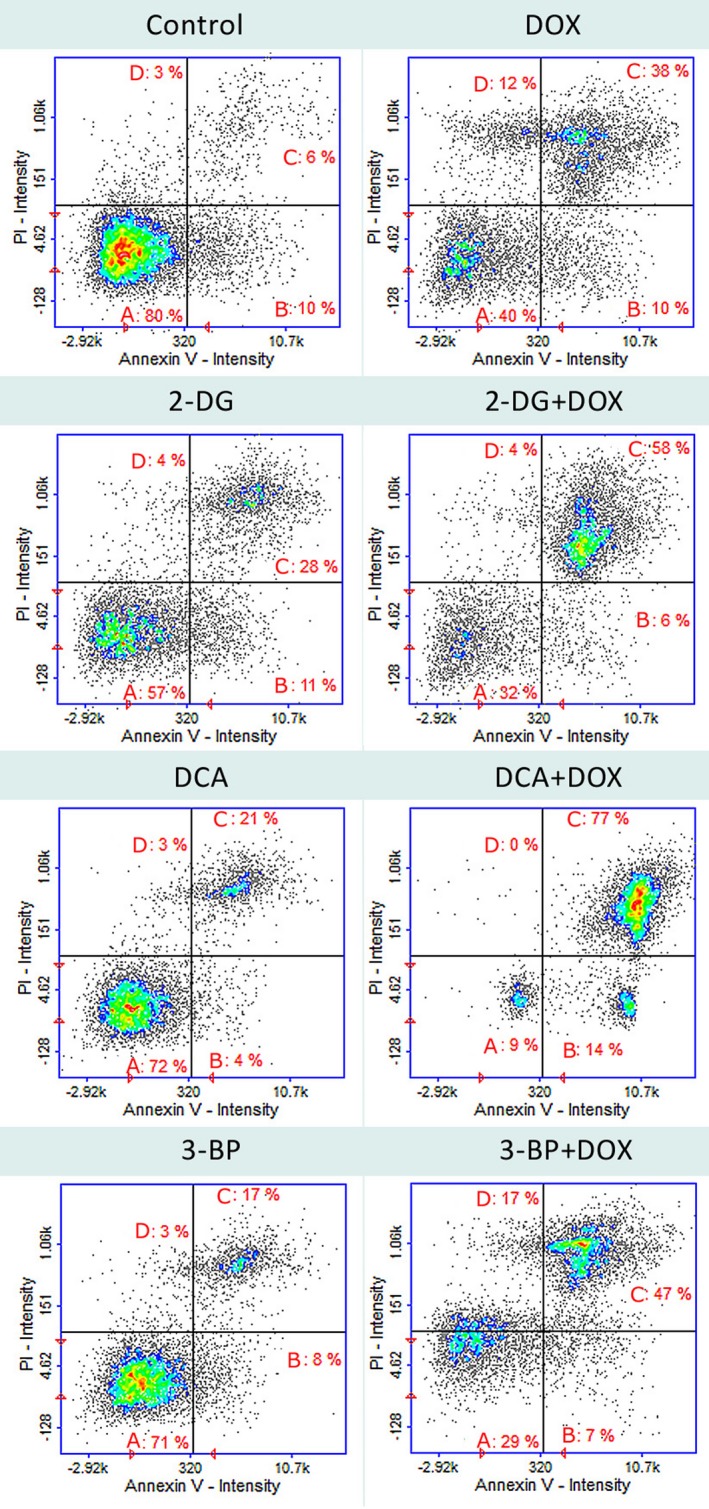
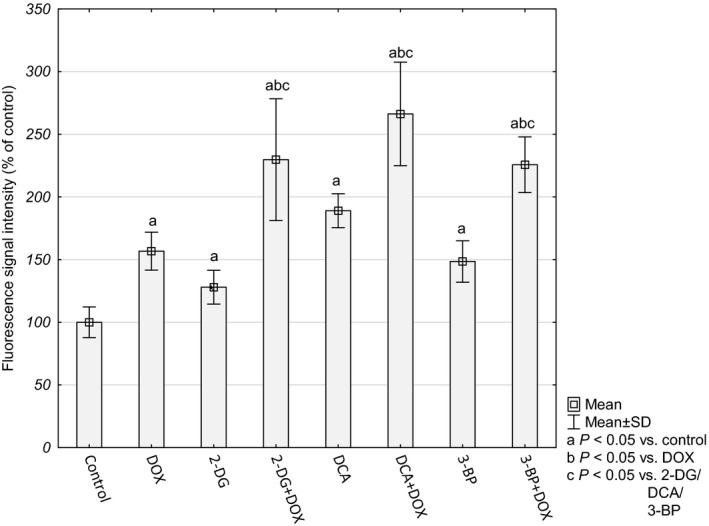
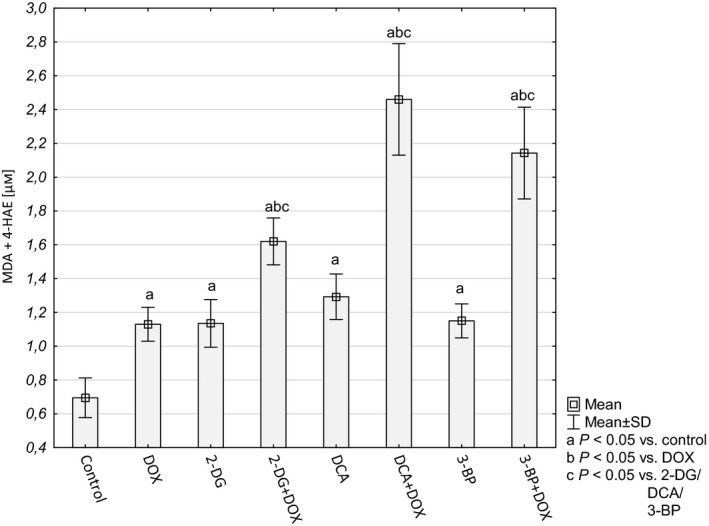
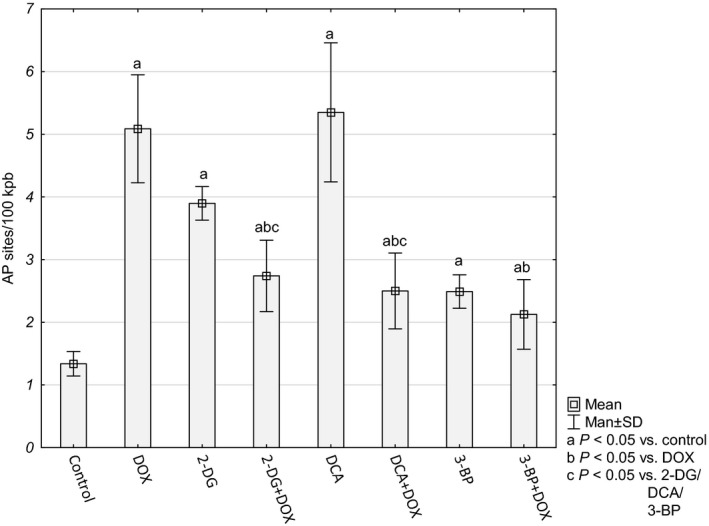
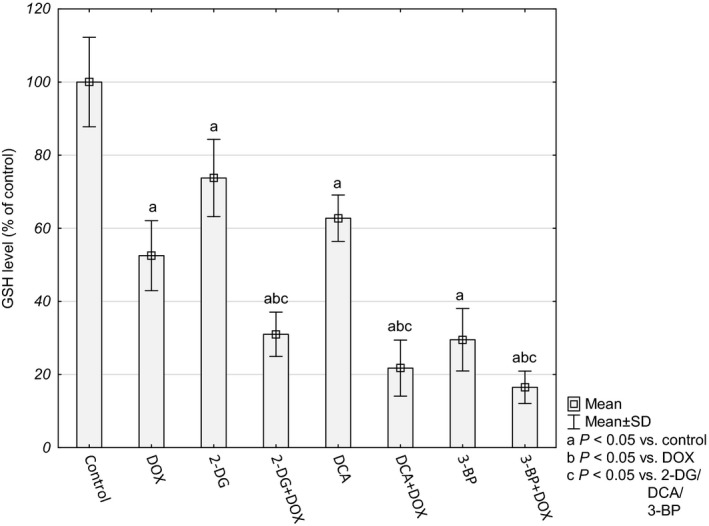
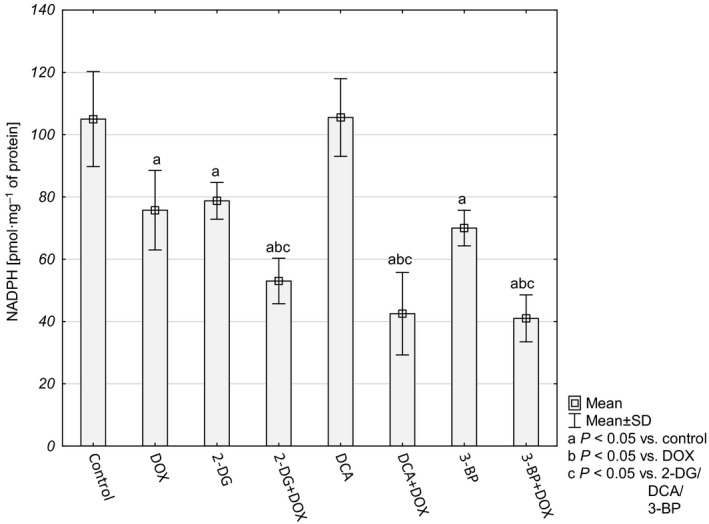
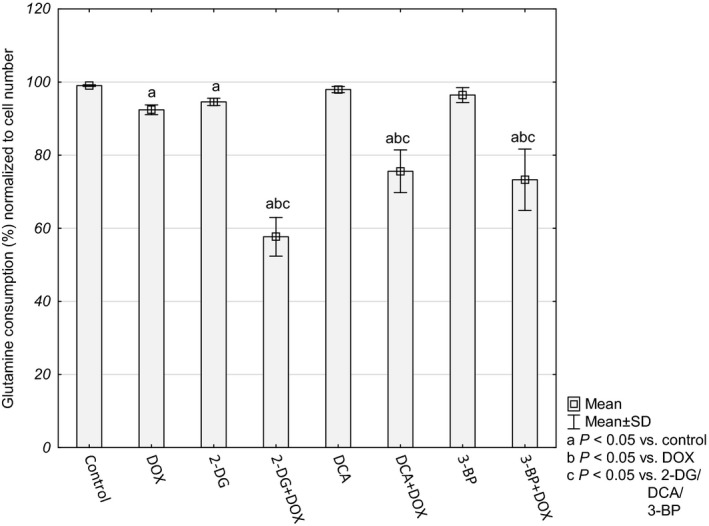
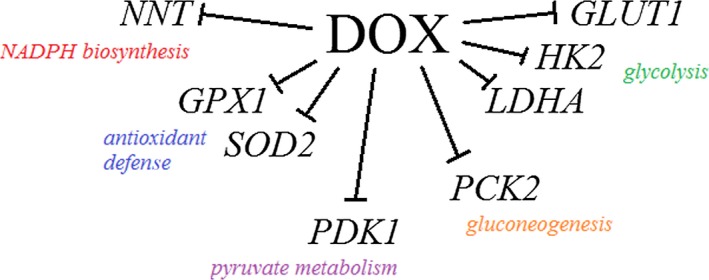
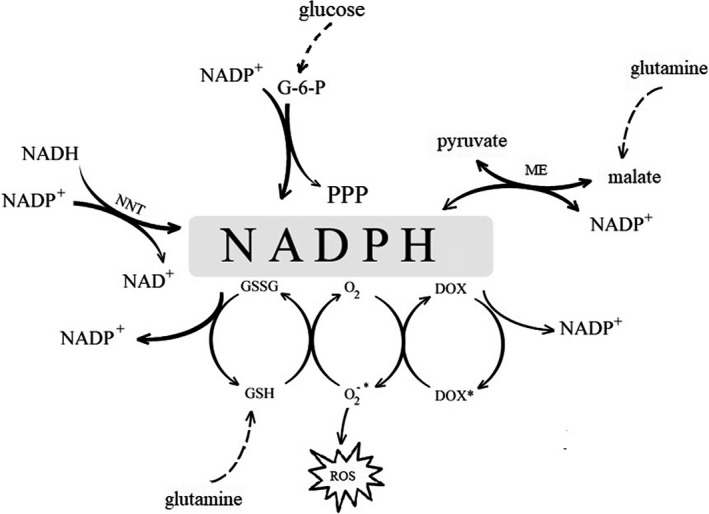
Increased glucose consumption is a known hallmark of cancer cells. Increased glycolysis provides ATP, reducing agents and substrates for macromolecular synthesis in intensely dividing cells. Therefore, inhibition of glycolysis is one strategy in anticancer therapy as well as in improved efficacy of conventional anticancer chemotherapeutic agents. One such agent is doxorubicin (DOX), but the mechanism of sensitization of tumor cells to DOX by inhibition of glycolysis has not been fully elucidated. As oxidative stress is an important phenomenon accompanying DOX action and antioxidant defense is closely related to energy metabolism, the aim of the study was the evaluation of oxidative stress markers and antioxidant abilities of cancer cells treated with DOX while glycolysis is inhibited. HepG2 cells were treated with DOX and one of three glycolysis inhibitors: 2-deoxyglucose, dichloroacetate or 3-promopyruvate. To evaluate the possible interaction mechanisms, we assessed mRNA expression of selected genes related to energy metabolism and antioxidant defense; oxidative stress markers; and reduced glutathione (GSH) and NADPH levels. Additionally, glutamine consumption was measured. It was demonstrated that the chemotherapeutic agent and glycolysis inhibitors induced oxidative stress and associated damage in HepG2 cells. However, simultaneous treatment with both agents resulted in even greater lipid peroxidation and a significant reduction in GSH and NADPH levels. Moreover, in the presence of the drug and an inhibitor, HepG2 cells had a reduced ability to take up glutamine. These results indicated that cells treated with DOX while glycolysis was inhibited had significantly reduced ability to produce NADPH and antioxidant defenses.
Keywords: 2-deoxyglucose; 3-promopyruvate; dichloroacetate; doxorubicin; glycolysis inhibitors; oxidative stress.
© 2019 The Authors. Published by FEBS Press and John Wiley & Sons Ltd.
Conflict of interest statement
The authors declare no conflict of interest.
Figures
References
-
- DeBerardinis RJ, Lum JJ, Hatzivassiliou G and Thompson CB (2008) The biology of cancer: metabolic reprogramming fuels cell growth and proliferation. Cell Metab 7, 11–20. - PubMed
-
- Koppenol WH, Bounds PL and Dang CV (2011) Otto Warburg's contributions to current concepts of cancer metabolism. Nat Rev Cancer 11, 325–337. - PubMed
-
- Upadhyay M, Samal J, Kandpal M, Singh OV and Vivekanandan P (2013) The Warburg effect: insights from the past decade. Pharmacol Ther 137, 318–330. - PubMed
-
- Gambhir SS (2002) Molecular imaging of cancer with positron emission tomography. Nat Rev Cancer 2, 683–693. - PubMed
-
- Kondoh H (2008) Cellular life span and the Warburg effect. Exp Cell Res 314, 1923–1928. - PubMed
Publication types
MeSH terms
Substances
Associated data
- Actions
- Actions
- Actions
- Actions
- Actions
- Actions
- Actions
- Actions
- Actions
- Actions
LinkOut - more resources
Full Text Sources
Research Materials
