. 2019 Apr 11;5(9):e127317.
doi: 10.1172/jci.insight.127317.

Detection of circulating extracellular mRNAs by modified small-RNA-sequencing analysis

Affiliations

Detection of circulating extracellular mRNAs by modified small-RNA-sequencing analysis

Kemal M Akat et al. JCI Insight. .

Abstract

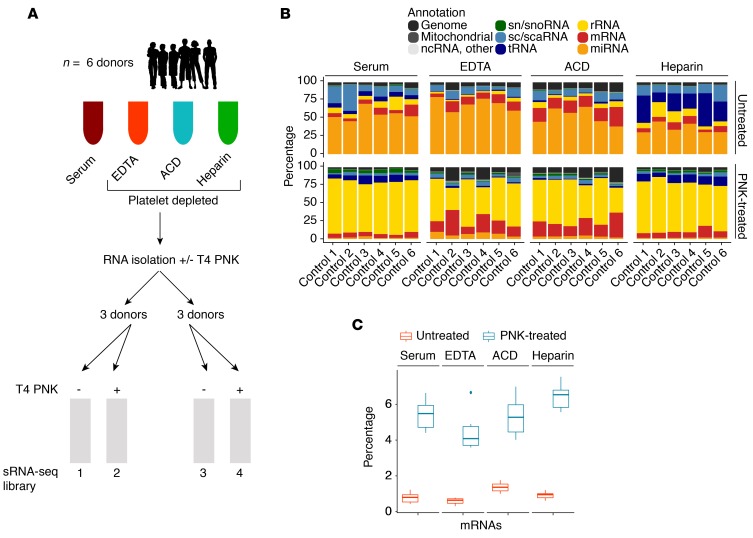
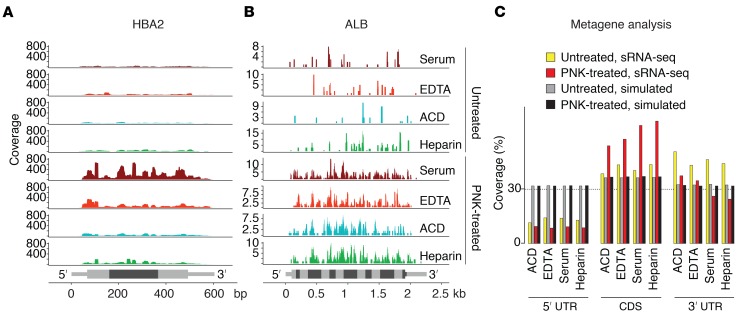
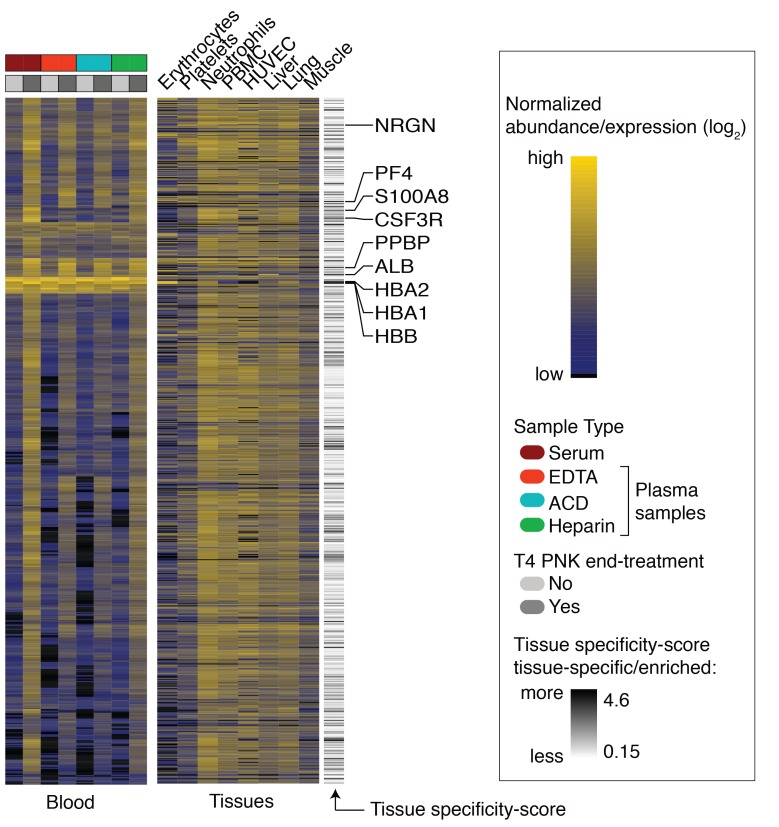
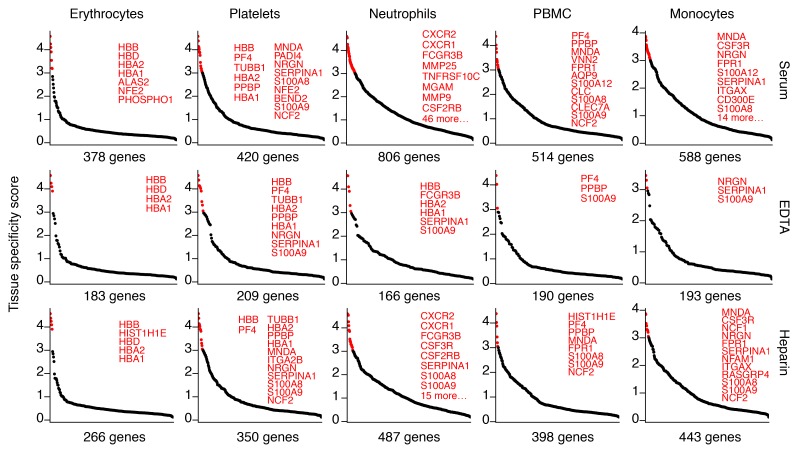
Extracellular mRNAs (ex-mRNAs) potentially supersede extracellular miRNAs (ex-miRNAs) and other RNA classes as biomarkers. We performed conventional small-RNA-sequencing (sRNA-seq) and sRNA-seq with T4 polynucleotide kinase (PNK) end-treatment of total exRNA isolated from serum and platelet-poor EDTA, ACD, and heparin plasma to study the effect on ex-mRNA capture. Compared to conventional sRNA-seq PNK-treatment increased the detection of informative ex-mRNAs reads up to 50-fold. The exRNA pool was dominated by hematopoietic cells and platelets, with additional contribution from the liver. About 60% of the 15- to 42-nt reads originated from the coding sequences, in a pattern reminiscent of ribosome-profiling. Blood sample type had a considerable influence on the exRNA profile. On average approximately 350 to 1,100 distinct ex-mRNA transcripts were detected depending on plasma type. In serum, additional transcripts from neutrophils and hematopoietic cells increased this number to near 2,300. EDTA and ACD plasma showed a destabilizing effect on ex mRNA and non-coding RNA ribonucleoprotein complexes compared to other plasma types. In a proof-of-concept study, we investigated differences between the exRNA profiles of patients with acute coronary syndrome (ACS) and healthy controls. The improved tissue resolution of ex mRNAs after PNK-treatment enabled us to detect a neutrophil-signature in ACS that escaped detection by ex miRNA analysis.

Keywords: Bioinformatics; Cardiology; Molecular diagnosis; RNA processing; Vascular Biology.


Conflict of interest statement

Conflict of interest: TT is a cofounder of and adviser to Alnylam Pharmaceuticals.

Figures

Figure 1
Figure 1. Treatment of total extracellular RNA with T4 polynucleotide kinase followed by small-RNA-sequencing.
(A) Total RNA was isolated from 450 μl serum or platelet-depleted EDTA, acid citrate dextrose (ACD), and heparin plasma from 6 healthy individuals and purified using silica-based spin columns. Half of the RNA was treated with T4 polynucleotide kinase (T4 PNK) and repurified (PNK treated), and multiplexed small-RNA-sequencing (sRNA-seq) libraries were prepared separately for the untreated (libraries 1 and 3) and PNK-treated RNA (libraries 2 and 4). (B) Differences in read annotation in the 4 sample types for untreated RNA and PNK-treated RNA using initial annotation settings (reads 12–42 nt, up to 2 mismatches, multimapping). (C) Differences in ex‑mRNA capture between untreated and PNK-treated RNA using final annotation criteria (reads >15 nt, no mismatch and up to 2 mapping locations). Box plots show the median and first and third quartiles (bottom and top hinges). Whiskers extend at most ×1.5 interquartile range from the hinges; any data outside this are shown as individual outlier points. Shown are results from n = 6 individual samples per condition.
Figure 2
Figure 2. Read distribution of ex‑mRNA reads across the full-length mRNA transcripts.
(A and B) Read coverage for the hemoglobin A2 transcript (A) and the albumin transcript (B) by sample type for untreated and T4 PNK end-treated samples. Exon boundaries (HBA2: 3 exons, ALB: 15 exons) are indicated by alternating intensities of gray, and UTRs are distinguished from CDS by thinner bars. (C) Metagene analysis with relative read coverage (percentage) across 5′ UTRs, CDSs, and 3′ UTRs for untreated and PNK-treated samples as well as corresponding data obtained after 100 random simulations (across an average of 2342–3500 captured transcripts for untreated samples and an average of 12,789–16,487 captured transcripts for PNK-treated samples, depending on sample type). Shown are results from n = 6 individual samples per condition.
Figure 3
Figure 3. Tissue sources of ex‑mRNAs.
Heatmap with the top the 821 most abundant ex-mRNAs in circulation for untreated and PNK-treated samples (left), together with the corresponding expression in selected cells or tissues (right). Selected tissue-specific/enriched mRNAs are labeled together with the tissue specificity score. Shown are results from n = 6 individual samples per condition. Tissue and cell RNA-seq data used for the tissue heatmap are listed in Supplemental Data 6.
Figure 4
Figure 4. Top expressed transcripts from hematopoietic tissues captured in circulation.
The 1000 most abundant cellular mRNA transcripts (excluding mRNAs encoded on the mitochondrial genome) from the selected cell types that collected 5 unique reads in at least 3 of the 6 donors per sample type were considered captured. The captured transcripts (x axis) were ordered in descending order by the tissue specificity score (TSS; y axis). Transcripts with a TSS greater than 3 are highlighted in red and listed, space permitting. Shown are results from n = 6 individual samples per condition. Tissue and cell RNA-seq data used for TSS calculation are listed in Supplemental Data 6.
Figure 5
Figure 5. Changes in ex‑mRNAs and ex‑miRNAs in patients with ACS compared with controls.
(A) MA plot of ex-miRNA changes with color coding of miRNAs highly expressed in platelets, defined as the top 85% miRNAs. (B and C) MA plots of ex-mRNA changes with color coding highly of expressed neutrophil genes (B) or platelet genes (C). Navy blue: highly expressed and FDR >5%; light blue: highly expressed and FDR <5%; red: not highly expressed and FDR <5%; gray: all other. Highlighted miRNAs (A) include the myocardium-specific miR-208b; miR-223, which is highly but not specifically expressed in neutrophils; and miR-24, which is highly but not specifically expressed in megakaryocytes (platelet precursor). Highlighted mRNAs are selected highly enriched neutrophils (B) or platelets (C) transcripts. (D) Heatmap showing altered ex‑mRNAs in the ACS group compared with healthy controls. Selected neutrophil-enriched mRNAs are indicated on the right. (E) RNA-seq read coverage of the 523 nt S100A8 transcript in ACS group and healthy controls (downsampled to 600,000 reads). Transcript structure indicated at the bottom with the 3 exons in alternating intensities of gray, and the 5′/3′ UTRs as thin bars.

References

    1. Mandel P, Metais P. [Not Available] C R Seances Soc Biol Fil. 1948;142(3-4):241–243. - PubMed
    1. Mitchell PS, et al. Circulating microRNAs as stable blood-based markers for cancer detection. Proc Natl Acad Sci USA. 2008;105(30):10513–10518. doi: 10.1073/pnas.0804549105. - DOI - PMC - PubMed
    1. Arroyo JD, et al. Argonaute2 complexes carry a population of circulating microRNAs independent of vesicles in human plasma. Proc Natl Acad Sci USA. 2011;108(12):5003–5008. doi: 10.1073/pnas.1019055108. - DOI - PMC - PubMed
    1. Turchinovich A, Weiz L, Langheinz A, Burwinkel B. Characterization of extracellular circulating microRNA. Nucleic Acids Res. 2011;39(16):7223–7233. doi: 10.1093/nar/gkr254. - DOI - PMC - PubMed
    1. Elkayam E, et al. The structure of human argonaute-2 in complex with miR-20a. Cell. 2012;150(1):100–110. doi: 10.1016/j.cell.2012.05.017. - DOI - PMC - PubMed

Publication types

MeSH terms