. 2019 Apr 11;15(4):e1006937.
doi: 10.1371/journal.pcbi.1006937. eCollection 2019 Apr.

Exon level machine learning analyses elucidate novel candidate miRNA targets in an avian model of fetal alcohol spectrum disorder

Affiliations

Exon level machine learning analyses elucidate novel candidate miRNA targets in an avian model of fetal alcohol spectrum disorder

Abrar E Al-Shaer et al. PLoS Comput Biol. .

Abstract

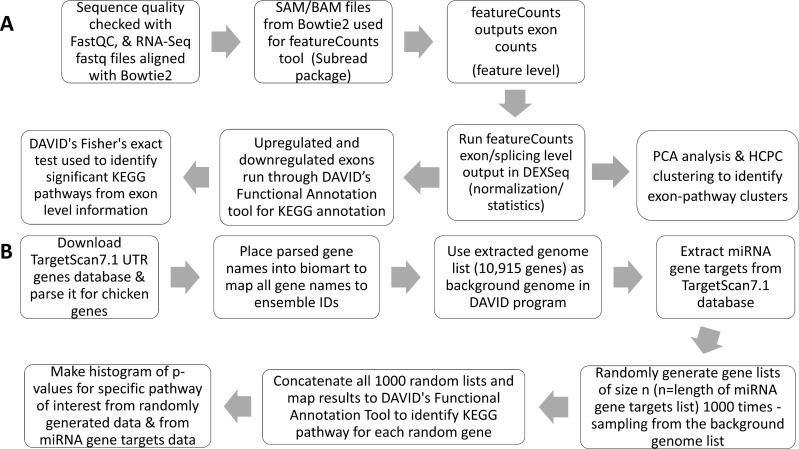
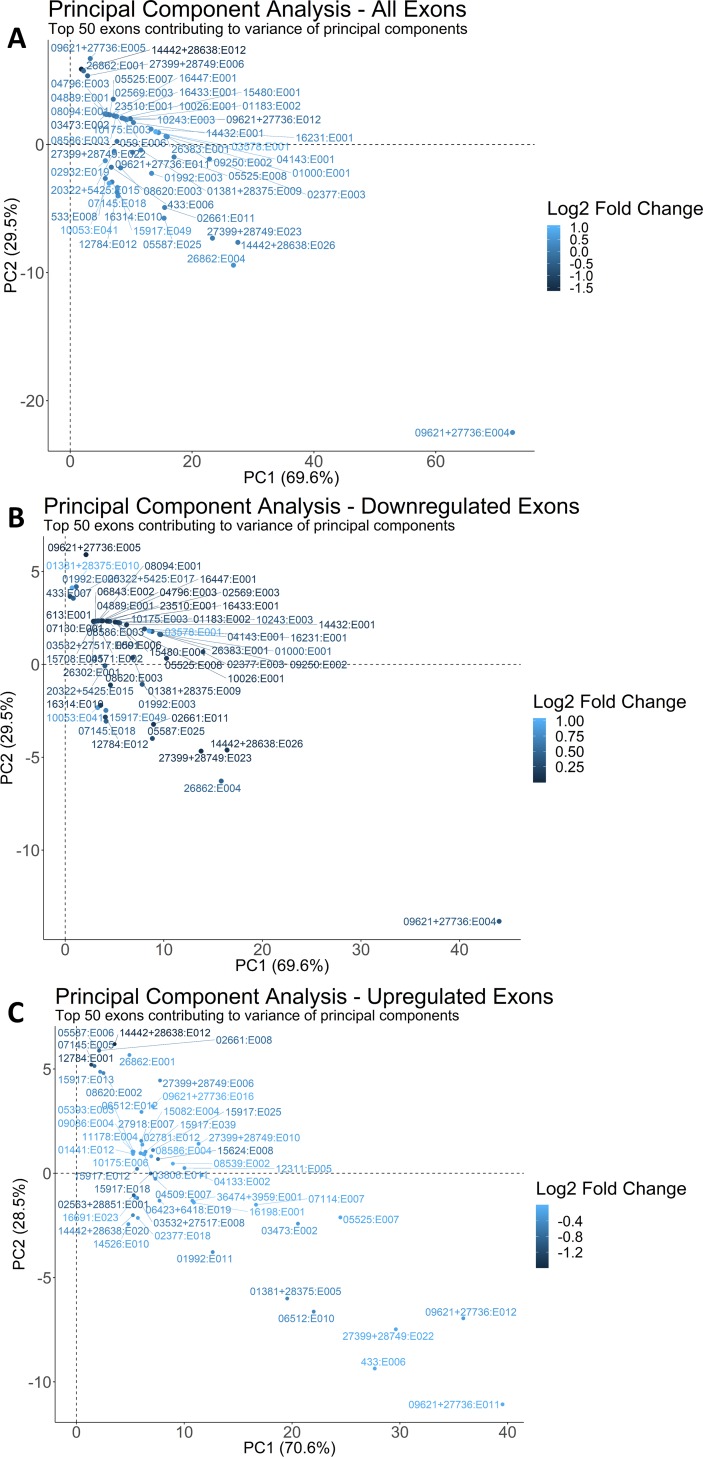
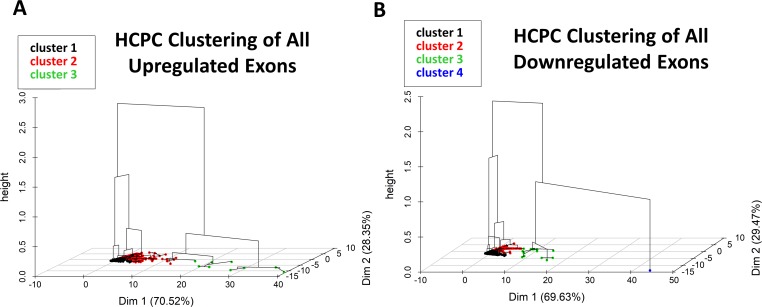
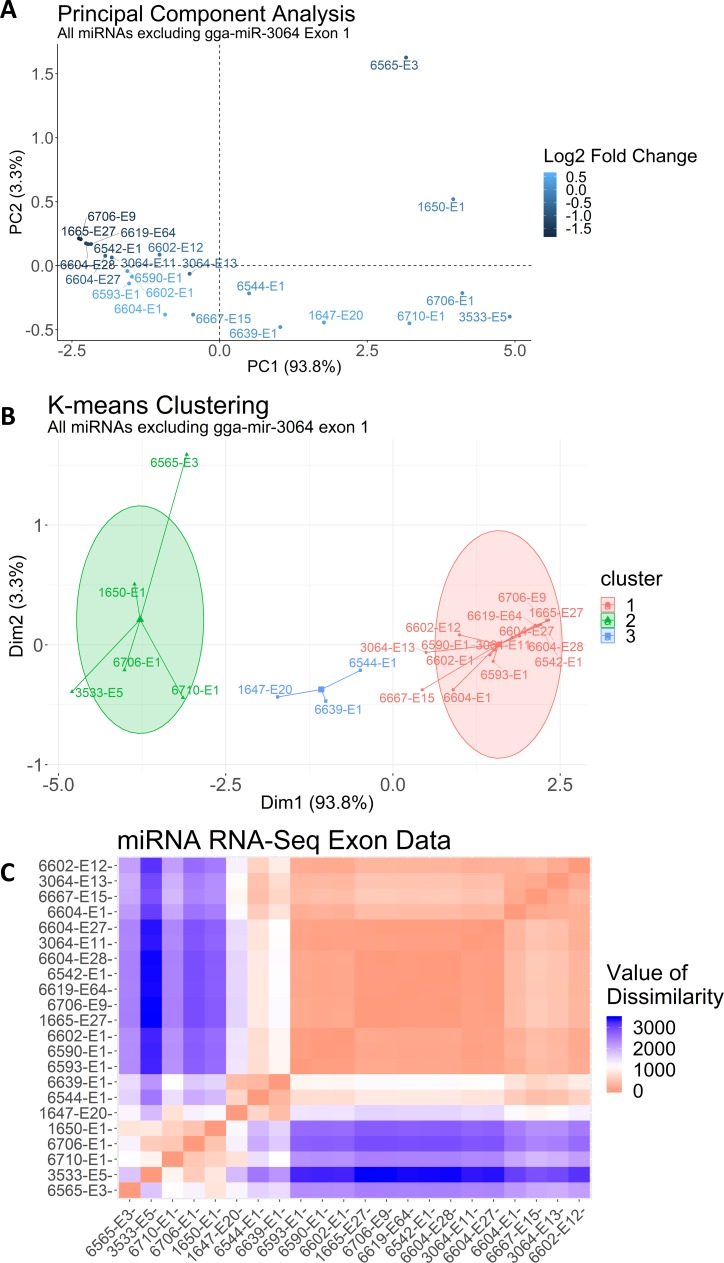
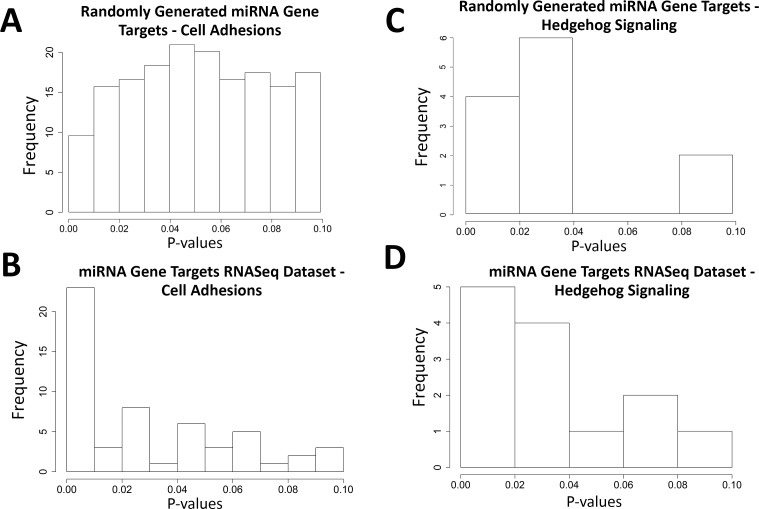
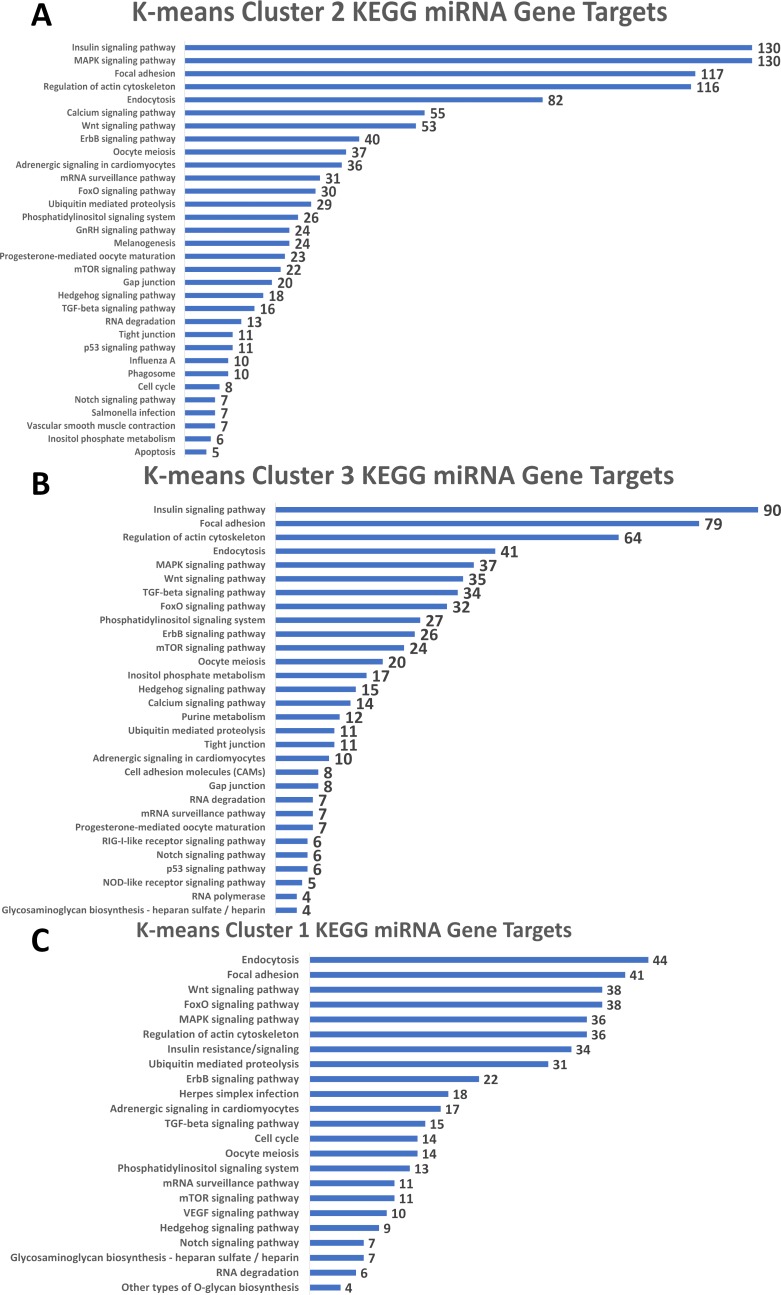
Gestational alcohol exposure causes fetal alcohol spectrum disorder (FASD) and is a prominent cause of neurodevelopmental disability. Whole transcriptome sequencing (RNA-Seq) offer insights into mechanisms underlying FASD, but gene-level analysis provides limited information regarding complex transcriptional processes such as alternative splicing and non-coding RNAs. Moreover, traditional analytical approaches that use multiple hypothesis testing with a false discovery rate adjustment prioritize genes based on an adjusted p-value, which is not always biologically relevant. We address these limitations with a novel approach and implemented an unsupervised machine learning model, which we applied to an exon-level analysis to reduce data complexity to the most likely functionally relevant exons, without loss of novel information. This was performed on an RNA-Seq paired-end dataset derived from alcohol-exposed neural fold-stage chick crania, wherein alcohol causes facial deficits recapitulating those of FASD. A principal component analysis along with k-means clustering was utilized to extract exons that deviated from baseline expression. This identified 6857 differentially expressed exons representing 1251 geneIDs; 391 of these genes were identified in a prior gene-level analysis of this dataset. It also identified exons encoding 23 microRNAs (miRNAs) having significantly differential expression profiles in response to alcohol. We developed an RDAVID pipeline to identify KEGG pathways represented by these exons, and separately identified predicted KEGG pathways targeted by these miRNAs. Several of these (ribosome biogenesis, oxidative phosphorylation) were identified in our prior gene-level analysis. Other pathways are crucial to facial morphogenesis and represent both novel (focal adhesion, FoxO signaling, insulin signaling) and known (Wnt signaling) alcohol targets. Importantly, there was substantial overlap between the exomes themselves and the predicted miRNA targets, suggesting these miRNAs contribute to the gene-level expression changes. Our novel application of unsupervised machine learning in conjunction with statistical analyses facilitated the discovery of signaling pathways and miRNAs that inform mechanisms underlying FASD.


Conflict of interest statement

The authors have declared that no competing interests exist.

Figures

Fig 1
Fig 1. Exon Quantification and RDAVID Workflows.
(A) The pipeline portrays the steps and tools used to map the raw sequence reads and quantify exon expression counts. (B) The creation process for the RDAVID program.
Fig 2
Fig 2. Exon-level principal component analyses.
Exons farthest from the origin are the most differentially expressed transcripts. Note that positive fold-changes are down-regulated exons, and negative fold-changes are up-regulated exons. The common identifier (“ENSGALG0000”) for all the exon Ensembl IDs in the PCA plots was removed for legibility. (A) PCA of the top 50 exons contributing to the variance of the dataset, irrespective of fold-change direction. (B) PCA of the top 50 exons contributing to the variance of the dataset that were down-regulated by alcohol. (C) PCA of the top 50 exons contributing to the variance of the dataset that were up-regulated by alcohol.
Fig 3
Fig 3. 3D hierarchal representation of HCPC clustering.
(A) Visualization of the HCPC clustering results for exons up-regulated by alcohol. (B) Visualization of the HCPC clustering results for exons down-regulated by alcohol.
Fig 4
Fig 4. PCA, K-means, and VAT of miRNAs.
The common identifier (“gga-miR”) for all the miRNA-exon Ensembl IDs was removed for legibility. All miRbase IDs in the plots are followed by a hyphen and the correspond exon number. (A) A PCA of the UCSC-verified miRNA-containing exons in our dataset (excluding gga-miR-3064 exon 1). Repeated miRNA IDs are due to a miRNA spanning more than one exon. Note that positive fold-changes are down-regulated exons, and negative fold-changes are up-regulated exons. (B) K-means clustering (k = 3 clusters) of all UCSC-verified miRNA exons, ellipses are drawn using Euclidean distance (excluding gga-miR-3064 exon 1). (C) A heatmap representation of the visual assessment of cluster tendency for all miRNA exons. Red corresponds to high similarity, and blue corresponds to low similarity.
Fig 5
Fig 5. P-value distributions of RDAVID results.
(A) A histogram of all p-values from the 1000 randomly generated miRNA gene targets in the cell adhesions pathway. (B) A histogram of all p-values from our RNA-Seq dataset’s miRNA gene targets in the cell adhesion pathways. (C) A histogram of all p-values from the 1000 randomly generated miRNA gene targets in the hedgehog pathway. (D) A histogram of all p-values from our RNA-Seq dataset’s miRNA gene targets in the hedgehog pathway.
Fig 6
Fig 6. KEGG Representation for miRNA Clusters Identified through K-Means Analysis.
(A) Listing of significantly enriched KEGG pathways in miRNA cluster 2, with the number of genes in each pathway indicated. (B) Listing of significantly enriched KEGG pathways in miRNA cluster 3, with the number of genes in each pathway indicated. (C) Listing of significantly enriched KEGG pathways in miRNA cluster 1, with the number of genes in each pathway indicated.

References

    1. Anders S, Reyes A, Huber W. Detecting differential usage of exons from RNA-Seq data. Genome Research. 2012. October22; 10.1101/gr.133744.111 - DOI - PMC - PubMed
    1. Bzdok D, Altman N, Krzywinski M. Points of Significance: Statistics versus machine learning. Nature Methods. 2018. April3; 15(4):233–4. 10.1038/nmeth.4642 - DOI - PMC - PubMed
    1. May PA, Chambers CD, Kalberg WO, Zellner J, Feldman H, Buckley D, et al. Prevalence of Fetal Alcohol Spectrum Disorders in 4 US Communities. JAMA. 2018. February 6; 319(5):474–482. 10.1001/jama.2017.21896 - DOI - PMC - PubMed
    1. Cook JL, Green CR, Lilley CM, Anderson SM, Baldwin ME, Chudley AE, et al. Canada Fetal Alcohol Spectrum Disorder Research Network. Fetal alcohol spectrum disorder: a guideline for diagnosis across the lifespan. CMAJ. 2016. February 16; 188(3):191–7. 10.1503/cmaj.141593 - DOI - PMC - PubMed
    1. Smith SM, Garic A, Flentke GR, Berres ME. Neural crest development in fetal alcohol syndrome. Birth Defects Res C. 2014. September15; 102(3):210–20. 10.1002/bdrc.21078 - DOI - PMC - PubMed

Publication types