

Expression and Activity of TRPA1 and TRPV1 in the Intervertebral Disc: Association with Inflammation and Matrix Remodeling
- PMID: 30974795
- PMCID: PMC6480240
- DOI: 10.3390/ijms20071767
Expression and Activity of TRPA1 and TRPV1 in the Intervertebral Disc: Association with Inflammation and Matrix Remodeling
Abstract
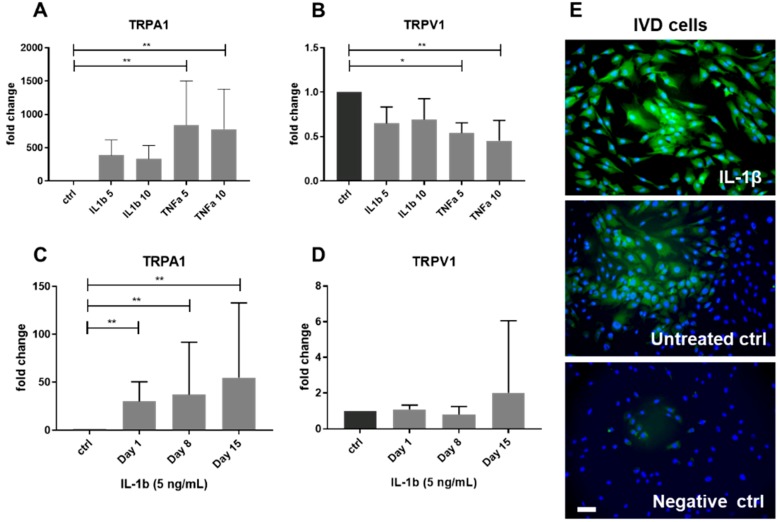
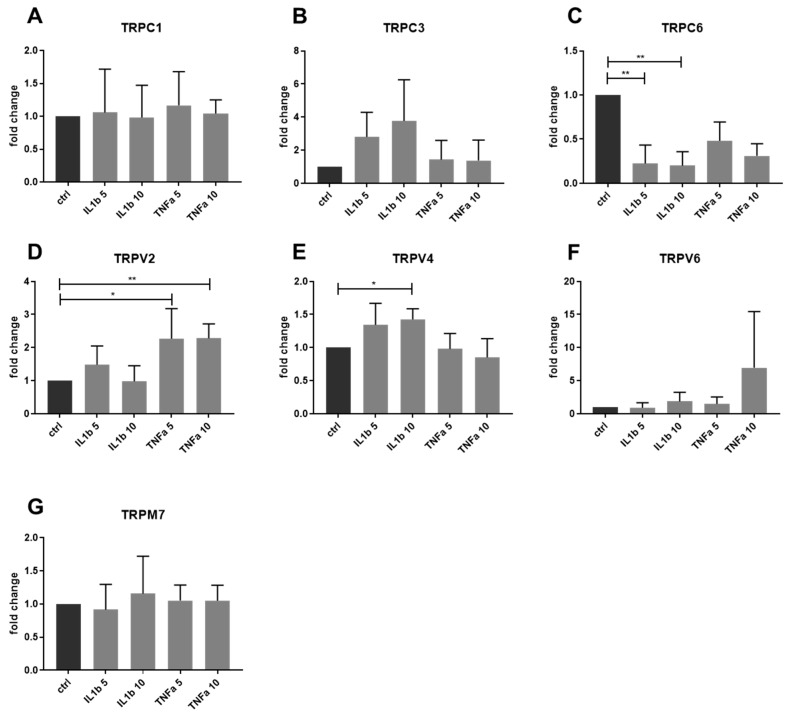
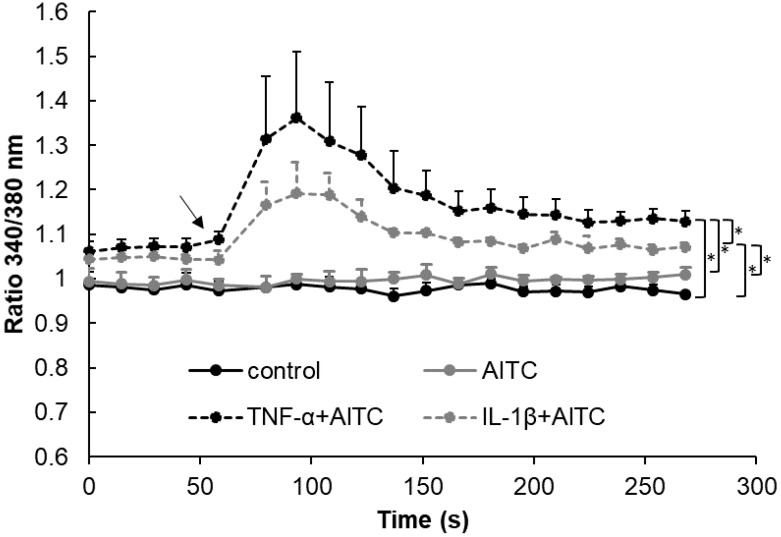
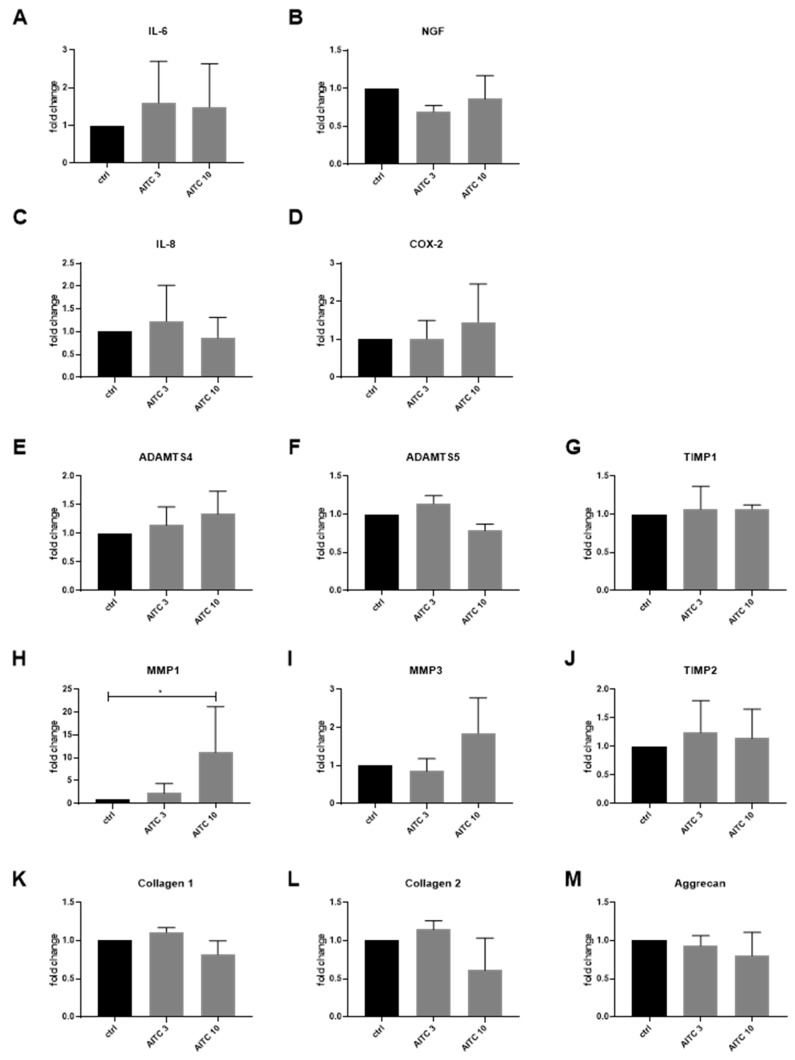
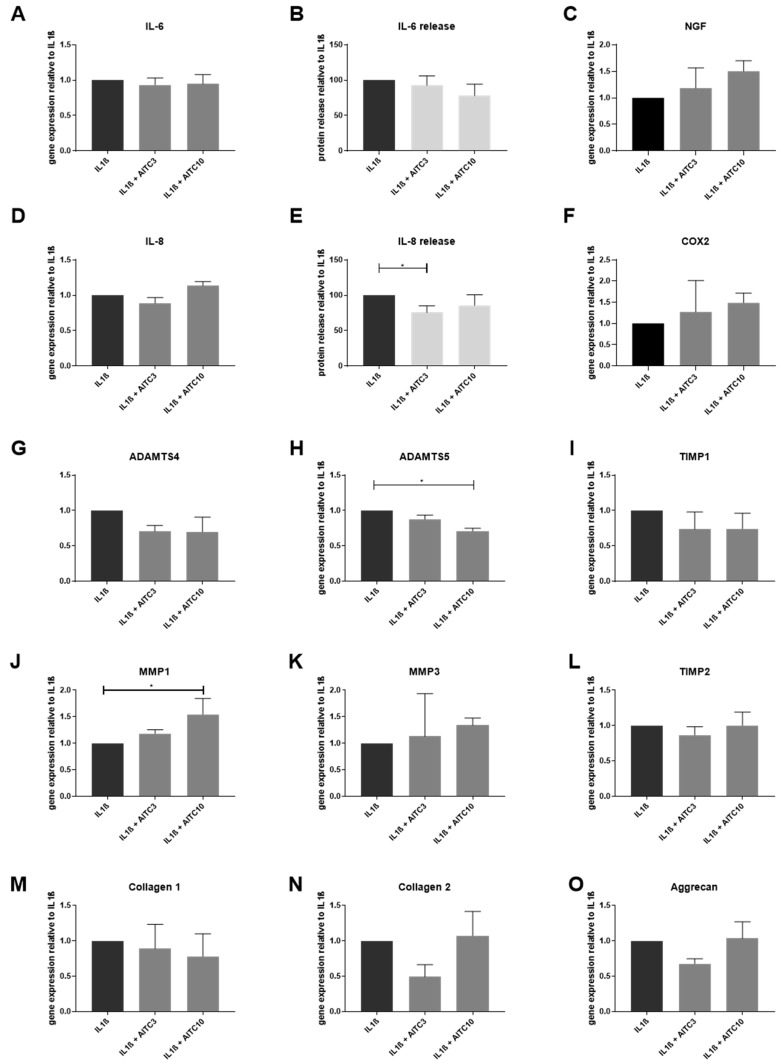
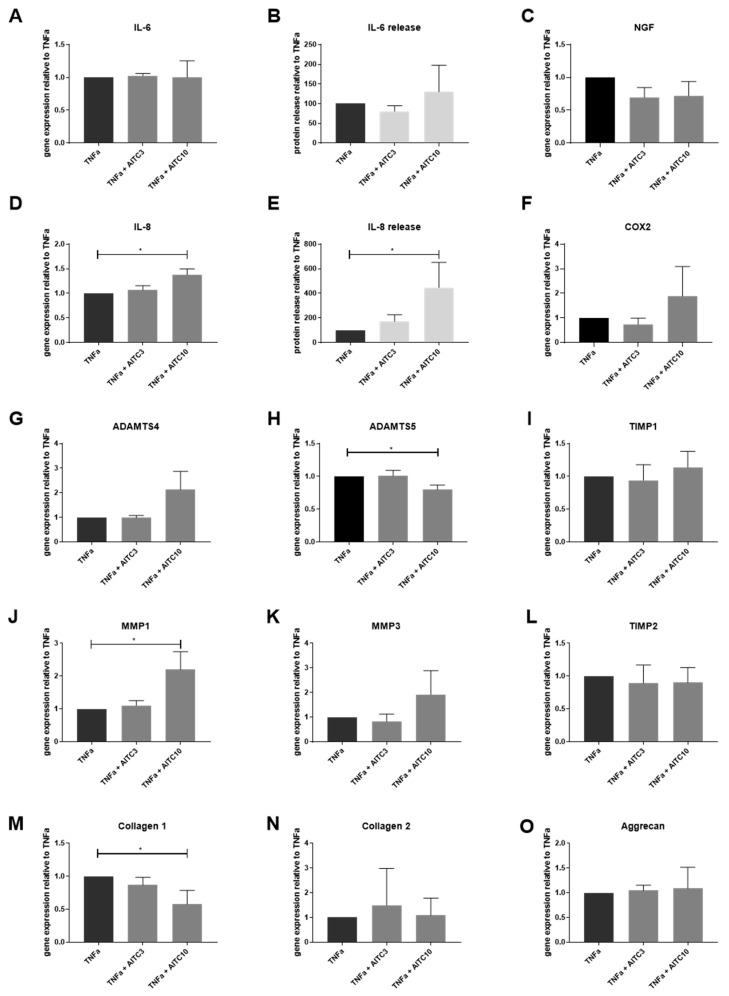
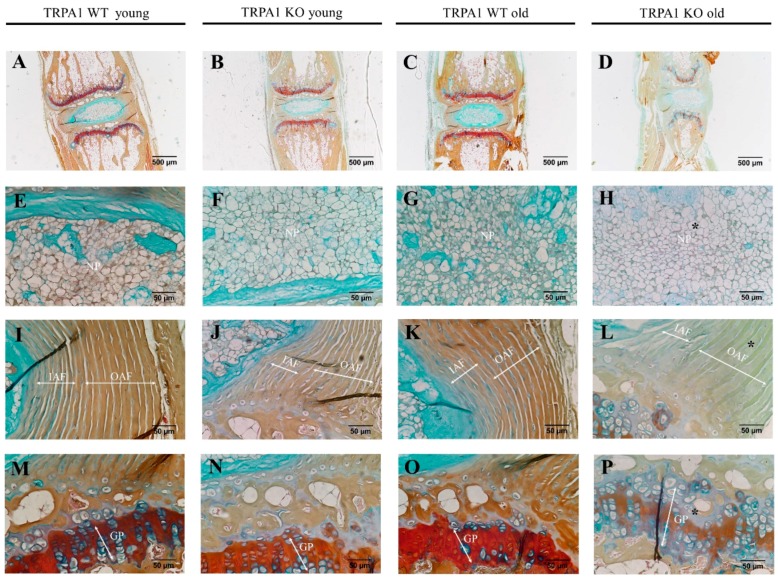
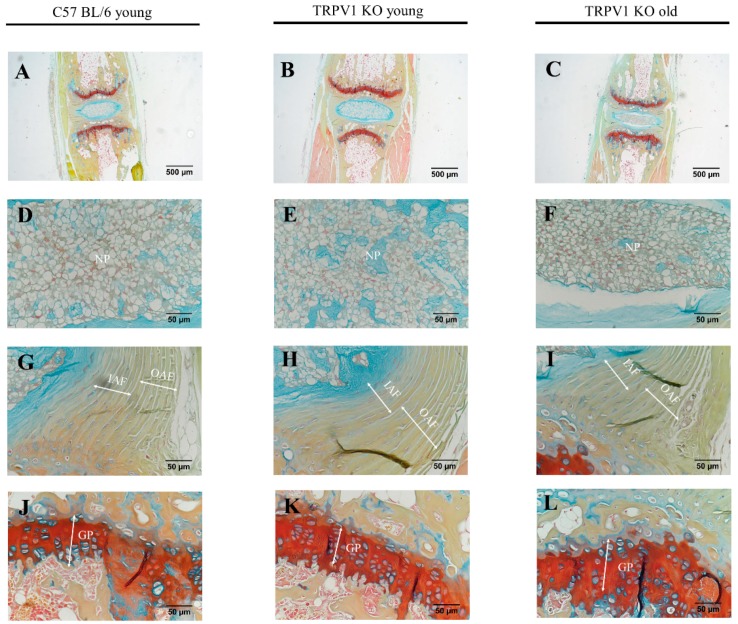
Transient receptor potential (TRP) channels have emerged as potential sensors and transducers of inflammatory pain. The aims of this study were to investigate (1) the expression of TRP channels in intervertebral disc (IVD) cells in normal and inflammatory conditions and (2) the function of Transient receptor potential ankyrin 1 (TRPA1) and Transient receptor potential vanilloid 1 (TRPV1) in IVD inflammation and matrix homeostasis. RT-qPCR was used to analyze human fetal, healthy, and degenerated IVD tissues for the gene expression of TRPA1 and TRPV1. The primary IVD cell cultures were stimulated with either interleukin-1 beta (IL-1β) or tumor necrosis factor alpha (TNF-α) alone or in combination with TRPA1/V1 agonist allyl isothiocyanate (AITC, 3 and 10 µM), followed by analysis of calcium flux and the expression of inflammation mediators (RT-qPCR/ELISA) and matrix constituents (RT-qPCR). The matrix structure and composition in caudal motion segments from TRPA1 and TRPV1 wild-type (WT) and knock-out (KO) mice was visualized by FAST staining. Gene expression of other TRP channels (A1, C1, C3, C6, V1, V2, V4, V6, M2, M7, M8) was also tested in cytokine-treated cells. TRPA1 was expressed in fetal IVD cells, 20% of degenerated IVDs, but not in healthy mature IVDs. TRPA1 expression was not detectable in untreated cells and it increased upon cytokine treatment, while TRPV1 was expressed and concomitantly reduced. In inflamed IVD cells, 10 µM AITC activated calcium flux, induced gene expression of IL-8, and reduced disintegrin and metalloproteinase with thrombospondin motifs 5 (ADAMTS5) and collagen 1A1, possibly via upregulated TRPA1. TRPA1 KO in mice was associated with signs of degeneration in the nucleus pulposus and the vertebral growth plate, whereas TRPV1 KO did not show profound changes. Cytokine treatment also affected the gene expression of TRPV2 (increase), TRPV4 (increase), and TRPC6 (decrease). TRPA1 might be expressed in developing IVD, downregulated during its maturation, and upregulated again in degenerative disc disease, participating in matrix homeostasis. However, follow-up studies with larger sample sizes are needed to fully elucidate the role of TRPA1 and other TRP channels in degenerative disc disease.
Keywords: TRP channels; TRPA1; TRPC6; TRPV1; TRPV2; TRPV4; aggrecanases; collagen; low back pain; pro-inflammatory cytokines.
Conflict of interest statement
The authors declare no conflict of interest.
Figures
Similar articles
-
Transient receptor potential vanilloid 4 regulates extracellular matrix composition and mediates load-induced intervertebral disc degeneration in a mouse model.Osteoarthritis Cartilage. 2024 Jul;32(7):881-894. doi: 10.1016/j.joca.2024.04.001. Epub 2024 Apr 9. Osteoarthritis Cartilage. 2024. PMID: 38604493
-
Reduced tissue osmolarity increases TRPV4 expression and pro-inflammatory cytokines in intervertebral disc cells.Eur Cell Mater. 2016 Jul 19;32:123-36. doi: 10.22203/ecm.v032a08. Eur Cell Mater. 2016. PMID: 27434269 Free PMC article.
-
Modulation of TRPV4 protects against degeneration induced by sustained loading and promotes matrix synthesis in the intervertebral disc.FASEB J. 2023 Feb;37(2):e22714. doi: 10.1096/fj.202201388R. FASEB J. 2023. PMID: 36583692 Free PMC article.
-
Current Knowledge and Future Therapeutic Prospects in Symptomatic Intervertebral Disc Degeneration.Yonsei Med J. 2022 Mar;63(3):199-210. doi: 10.3349/ymj.2022.63.3.199. Yonsei Med J. 2022. PMID: 35184422 Free PMC article. Review.
-
TRPV1 and TRPA1 in cutaneous neurogenic and chronic inflammation: pro-inflammatory response induced by their activation and their sensitization.Protein Cell. 2017 Sep;8(9):644-661. doi: 10.1007/s13238-017-0395-5. Epub 2017 Mar 31. Protein Cell. 2017. PMID: 28364279 Free PMC article. Review.
Cited by
-
TRPA1 aggravates osteoclastogenesis and osteoporosis through activating endoplasmic reticulum stress mediated by SRXN1.Cell Death Dis. 2024 Aug 27;15(8):624. doi: 10.1038/s41419-024-07018-5. Cell Death Dis. 2024. PMID: 39191723 Free PMC article.
-
The Effect of TGF-β3 and IL-1β on L-Type Voltage-Operated Calcium Channels and Calcium Ion Homeostasis in Osteoarthritic Chondrocytes and Human Bone Marrow-Derived Mesenchymal Stem Cells During Chondrogenesis.Pharmaceutics. 2025 Mar 7;17(3):343. doi: 10.3390/pharmaceutics17030343. Pharmaceutics. 2025. PMID: 40143007 Free PMC article.
-
Electrospray-Based Microencapsulation of Epigallocatechin 3-Gallate for Local Delivery into the Intervertebral Disc.Pharmaceutics. 2019 Sep 1;11(9):435. doi: 10.3390/pharmaceutics11090435. Pharmaceutics. 2019. PMID: 31480533 Free PMC article.
-
The protective effect and experimental research progress of pleotropic statins in intervertebral disc degeneration.J Orthop Surg Res. 2025 Jan 31;20(1):122. doi: 10.1186/s13018-025-05487-8. J Orthop Surg Res. 2025. PMID: 39891158 Free PMC article. Review.
-
Phytochemicals and Inflammation: Is Bitter Better?Plants (Basel). 2022 Nov 6;11(21):2991. doi: 10.3390/plants11212991. Plants (Basel). 2022. PMID: 36365444 Free PMC article.
References
MeSH terms
Substances
Grants and funding
LinkOut - more resources
Full Text Sources
Molecular Biology Databases
Research Materials
Miscellaneous
