. 2019 Apr 16;8(8):e011322.
doi: 10.1161/JAHA.118.011322.

Acute and 1-Year Hospitalization Costs for Acute Myocardial Infarction Treated With Percutaneous Coronary Intervention: Results From the TRANSLATE-ACS Registry

Affiliations

Acute and 1-Year Hospitalization Costs for Acute Myocardial Infarction Treated With Percutaneous Coronary Intervention: Results From the TRANSLATE-ACS Registry

Patricia A Cowper et al. J Am Heart Assoc. .

Abstract

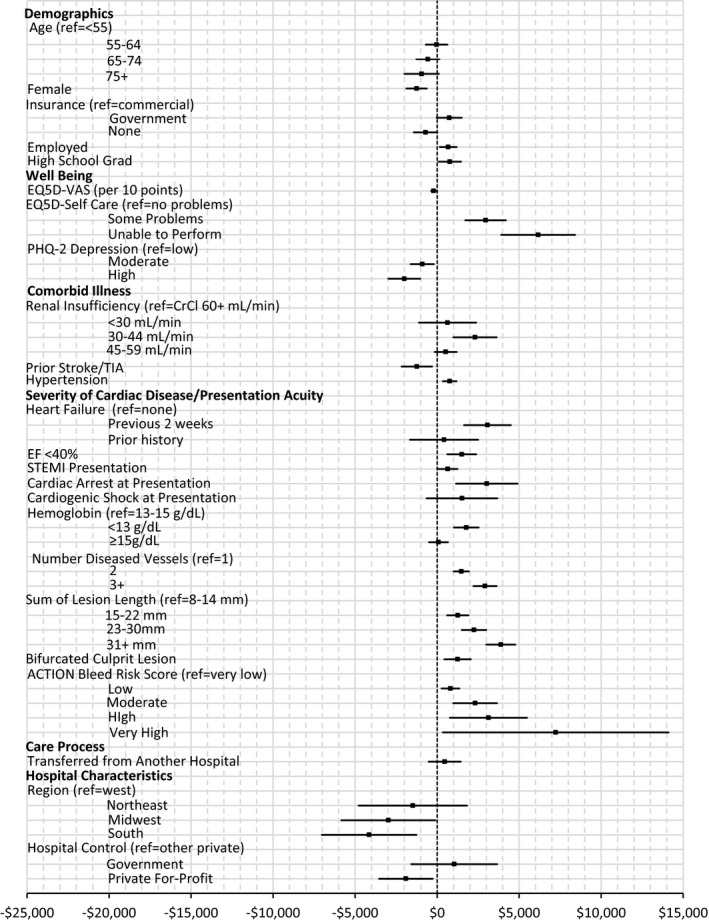
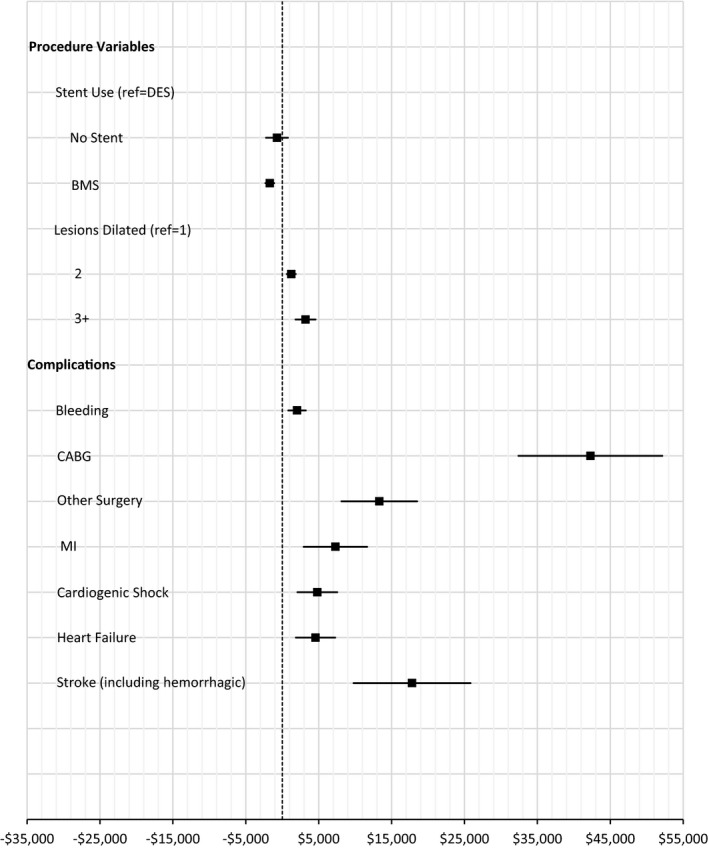
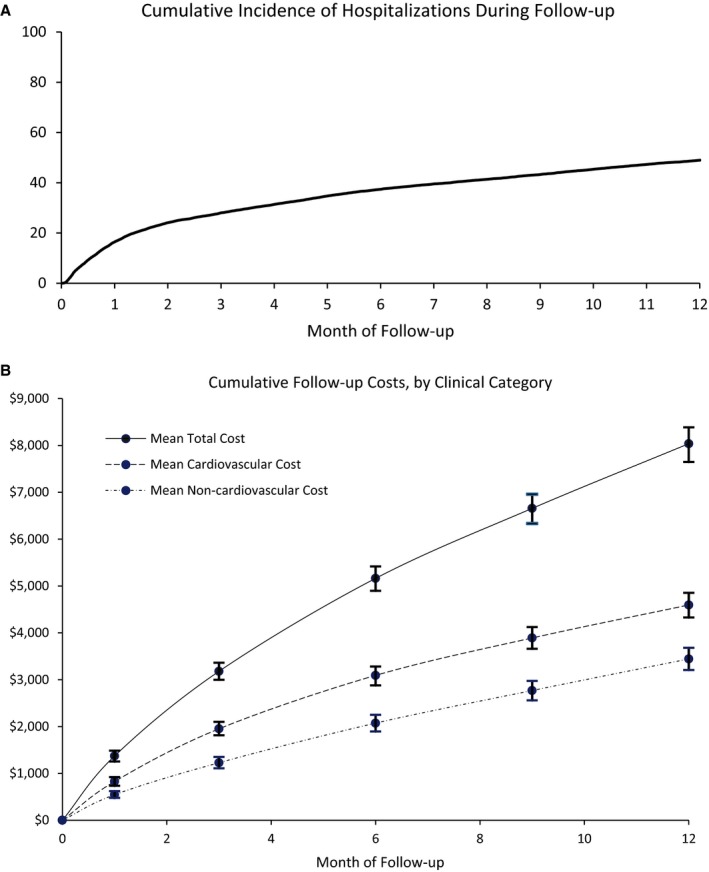
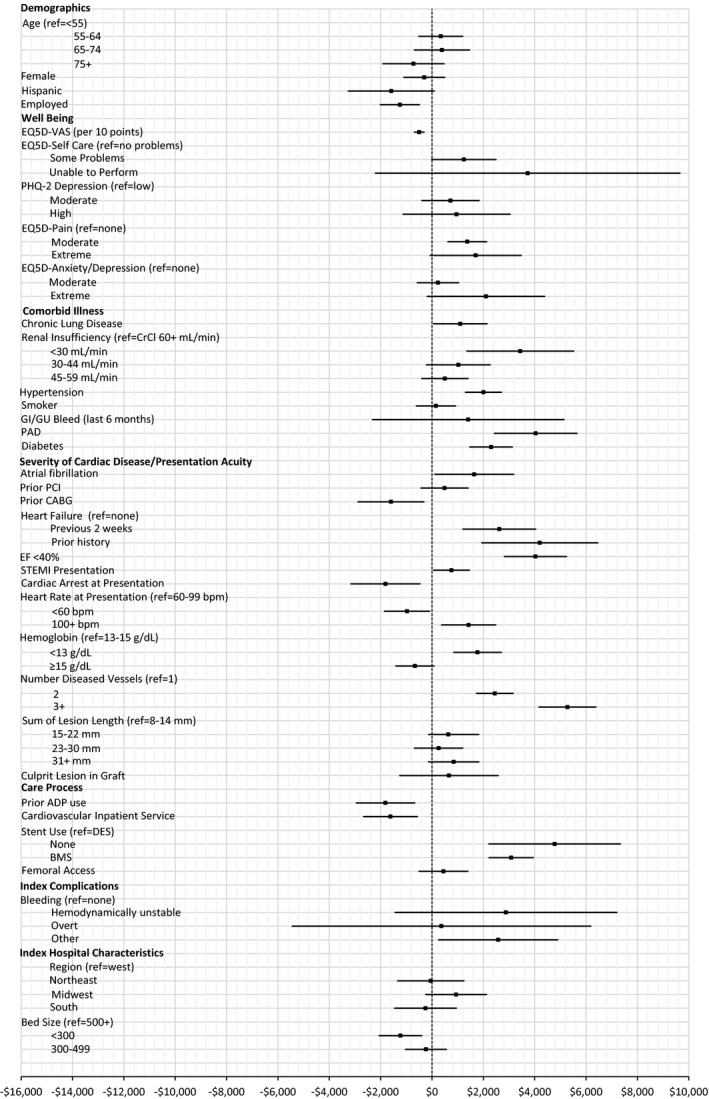
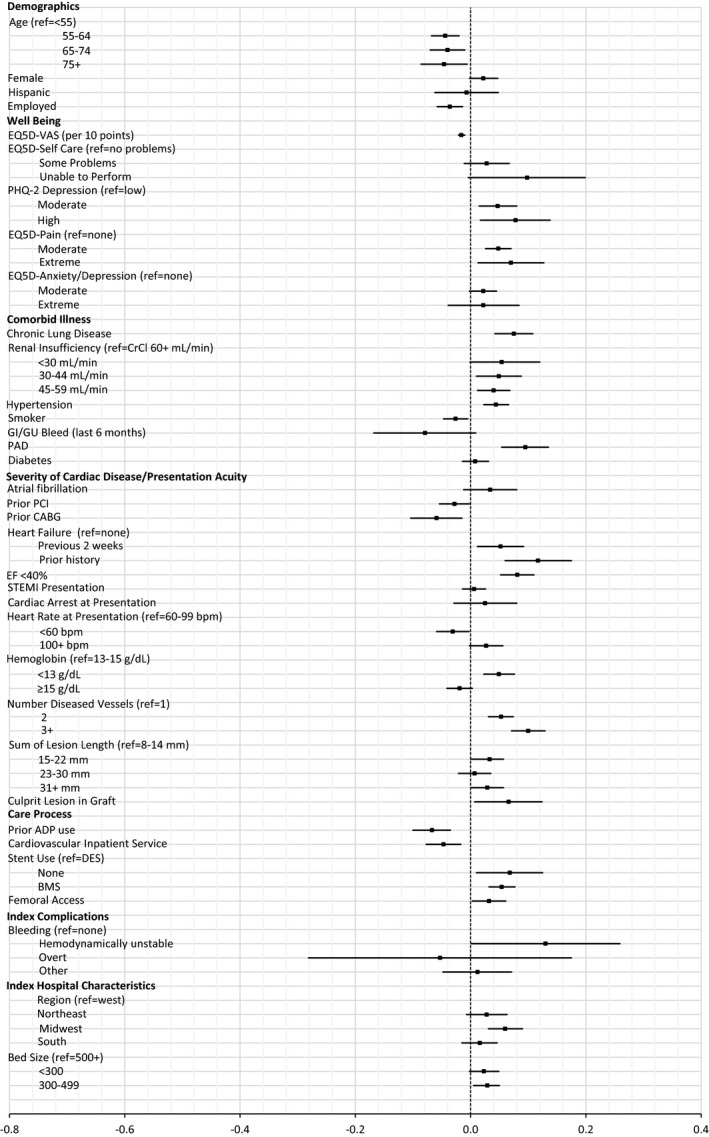
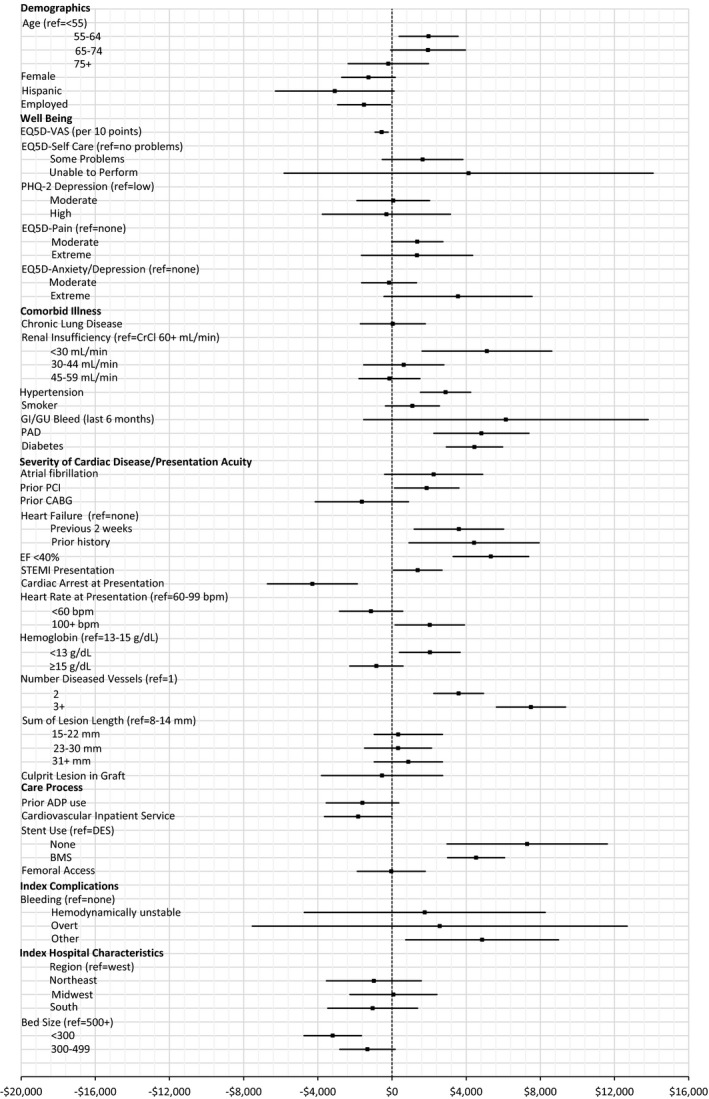
Background Hospitalization for acute myocardial infarction (MI) in the United States is both common and expensive, but those features alone provide little insight into cost-saving opportunities. Methods and Results To understand the cost drivers during hospitalization for acute MI and in the following year, we prospectively studied 11 969 patients with acute MI undergoing percutaneous coronary intervention at 233 US hospitals (2010-2013) from the TRANSLATE-ACS (Treatment With ADP Receptor Inhibitors: Longitudinal Assessment of Treatment Patterns and Events After Acute Coronary Syndrome) registry. Baseline costs were collected in a random subset (n=4619 patients, 54% ST-segment-elevation MI [STEMI]), while follow-up costs out to 1 year were collected for all patients. The mean index length of stay was 3.1 days (for both STEMI and non-STEMI) and mean intensive care unit length of stay was 1.2 days (1.4 days for STEMI and 1.0 days for non-STEMI). Index hospital costs averaged $18 931 ($19 327 for STEMI, $18 465 for non-STEMI), with 45% catheterization laboratory-related and 20% attributable to postprocedure hospital stay. Patient factors, including severity of illness and extent of coronary disease, and hospital characteristics, including for profit status and geographic region, identified significant variations in cost. Intensive care was used for 53% of non-STEMI and increased costs by $3282. Postdischarge 1-year costs averaged $8037, and 48% of patients were rehospitalized (half within 2 months and 57% with a cardiovascular diagnosis). Conclusions While much of the cost of patients with acute MI treated with percutaneous coronary intervention is probably not modifiable by the care team, cost reductions are still possible through quality-preserving practice efficiencies, such as need-based use rather than routine use of intensive care unit for patients with stable non-STEMI. Clinical Trial Registration URL: https://www.clinicaltrials.gov . Unique identifier: NCT00097591.

Keywords: acute myocardial infarction; cost; percutaneous coronary intervention.


Figures

Figure 1
Figure 1
Average marginal effects of baseline factors on index hospitalization cost. Estimated marginal effects, averaged over the sample, of baseline factors on cost of index hospitalization (point estimate with 95% CI). n=4611 (8 patients excluded because of missing independent variables). ACTION indicates Acute Coronary Treatment and Intervention Outcomes Network; CrCl, creatinine clearance; EF, ejection fraction; PHQ, Patient Health Questionnaire; STEMI, ST‐segment–elevation myocardial infarction; TIA, transient ischemic attack; VAS, visual analog scale.
Figure 2
Figure 2
Average marginal effects of procedures and complications on index hospitalization cost. Marginal effects, averaged over the sample, of procedures and complications on cost of index hospitalization (point estimate with 95% CI). Procedures and complications were added to the model with baseline factors (Figure 1). n=4611 (8 patients excluded because of missing independent variables). BMS indicates bare‐metal stent; CABG, coronary artery bypass grafting; DES, drug‐eluting stent; MI, myocardial infarction.
Figure 3
Figure 3
A, Cumulative incidence of hospitalizations during follow‐up. Cumulative incidence of first hospitalization (including emergency department encounters), accounting for the competing risk of death, over the 12‐month follow‐up period. B, Cumulative follow‐up costs, by clinical category. Cumulative mean costs at 1 month and at quarterly intervals over 1 year of follow‐up (total and stratified according to whether cardiovascular in nature). Vertical bars represent 95% CIs.
Figure 4
Figure 4
Average marginal effects of baseline and index factors on follow‐up cost. Estimated marginal effects, averaged over the sample, of baseline factors and events during index admission on cost of hospital care through 1 year (point estimate with 95% CI). n=10 328 (111 patients excluded due to missing independent variables). ADP indicates adenosine diphosphate; BMS, bare‐metal stent; bpm, beats per minute; CABG, coronary artery bypass grafting; CrCl, creatinine clearance; DES, drug‐eluting stent; EF, ejection fraction; GI/GU, gastrointestinal/genitourinary; PAD, peripheral artery disease; PCI, percutaneous coronary intervention; PHQ, Patient Health Questionnaire; STEMI, ST‐segment–elevation myocardial infarction; VAS, visual analog scale.
Figure 5
Figure 5
Estimated average marginal effects of baseline and index factors on probability of hospitalization. Estimated marginal effects, averaged over the sample, of baseline factors and events during index admission on probability of hospitalization through 1 year (point estimate with 95% CI). BMS indicates bare‐metal stent; CABG, coronary artery bypass grafting; CrCl, creatinine clearance; EF, ejection fraction; GI/GU, gastrointestinal/genitourinary; PAD, peripheral artery disease; PCI, percutaneous coronary intervention; STEMI, ST‐segment–elevation myocardial infarction; VAS, visual analog scale.
Figure 6
Figure 6
Estimated average marginal effects of baseline and index factors on hospitalization costs for those hospitalized. Estimated marginal effects, averaged over the sample, of baseline factors and events during index admission on hospitalization costs (for those hospitalized) through 1 year (point estimate with 95% CI). ADP indicates adenosine diphosphate; BMS, bare‐metal stent; bpm, beats per minute; CABG, coronary artery bypass grafting; CrCl, creatinine clearance; EF, ejection fraction; GI/GU, gastrointestinal/genitourinary; PAD, peripheral artery disease; PCI, percutaneous coronary intervention; STEMI, ST‐segment–elevation myocardial infarction; VAS, visual analog scale.

Comment in

References

    1. Torio C, Moore B. National Inpatient Hospital Costs: The Most Expensive Conditions by Payer, 2013. HCUP Statistical Brief #204. May 2016. Rockville, MD: Agency for Healthcare Research and Quality; 2013. Available at: https://www.hcup-us.ahrq.gov/reports/statbriefs/sb204-Most-Expensive-Hos.... Accessed January 29, 2019. - PubMed
    1. Sugiyama T, Hasegawa K, Kobayashi Y, Takahashi O, Fukui T, Tsugawa Y. Differential time trends of outcomes and costs of care for acute myocardial infarction hospitalizations by ST elevation and type of intervention in the United States, 2001–2011. J Am Heart Assoc. 2015;4:e001445 DOI: 10.1161/JAHA.114.001445 - DOI - PMC - PubMed
    1. Kaplan RS, Haas DA. How not to cut health care costs. Harv Bus Rev. 2014;92:142. - PubMed
    1. Dieleman JL, Squires E, Bui AL, Campbell M, Chapin A, Hamavid H, Horst C, Li Z, Matyasz T, Reynolds A, Sadat N, Schneider MT, Murray CJL. Factors associated with increases in US health care spending, 1996–2013. JAMA. 2017;318:1668–1678. - PMC - PubMed
    1. Kaplan RS, Porter ME. How to solve the cost crisis in health care. Harv Bus Rev. 2011;89:46–52, 54, 56‐61 passim. - PubMed

Publication types

Associated data