. 2019 Apr 15;35(4):573-587.e6.
doi: 10.1016/j.ccell.2019.03.002. Epub 2019 Apr 8.

Complete Regression of Advanced Pancreatic Ductal Adenocarcinomas upon Combined Inhibition of EGFR and C-RAF

Affiliations

Complete Regression of Advanced Pancreatic Ductal Adenocarcinomas upon Combined Inhibition of EGFR and C-RAF

María Teresa Blasco et al. Cancer Cell. .

Abstract

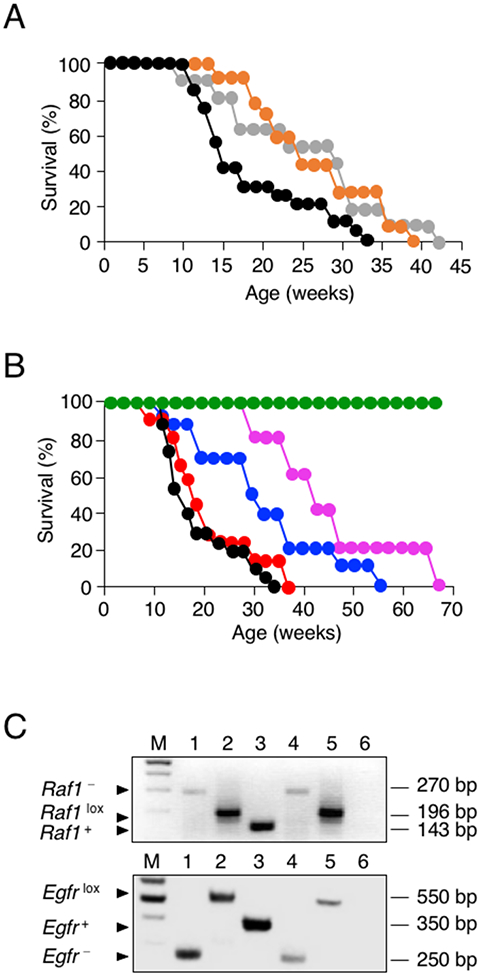
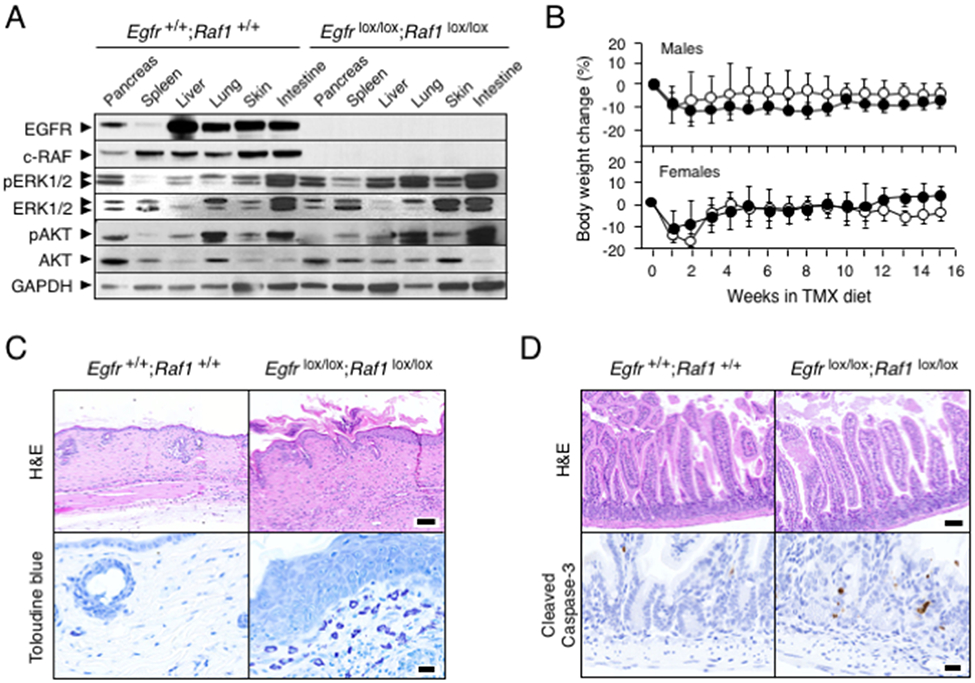
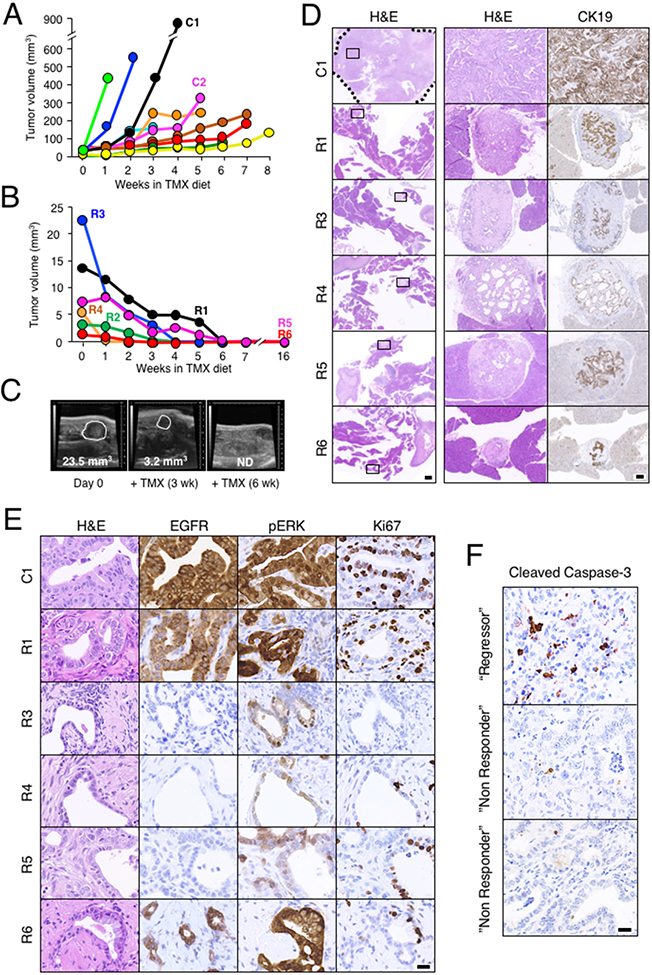
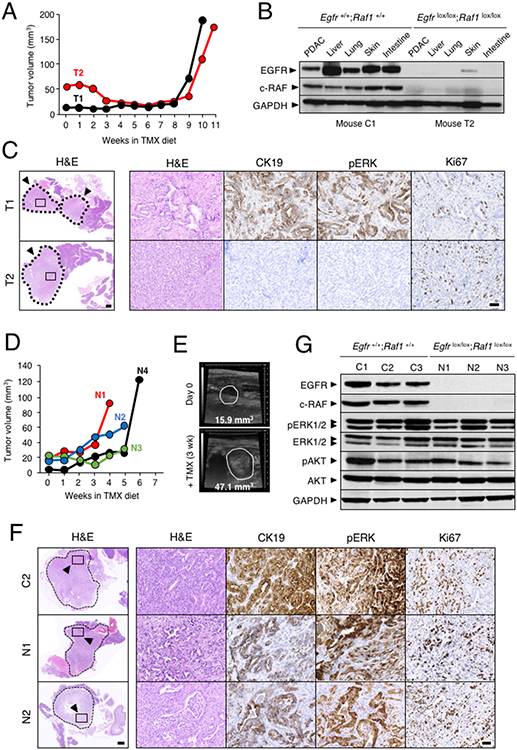
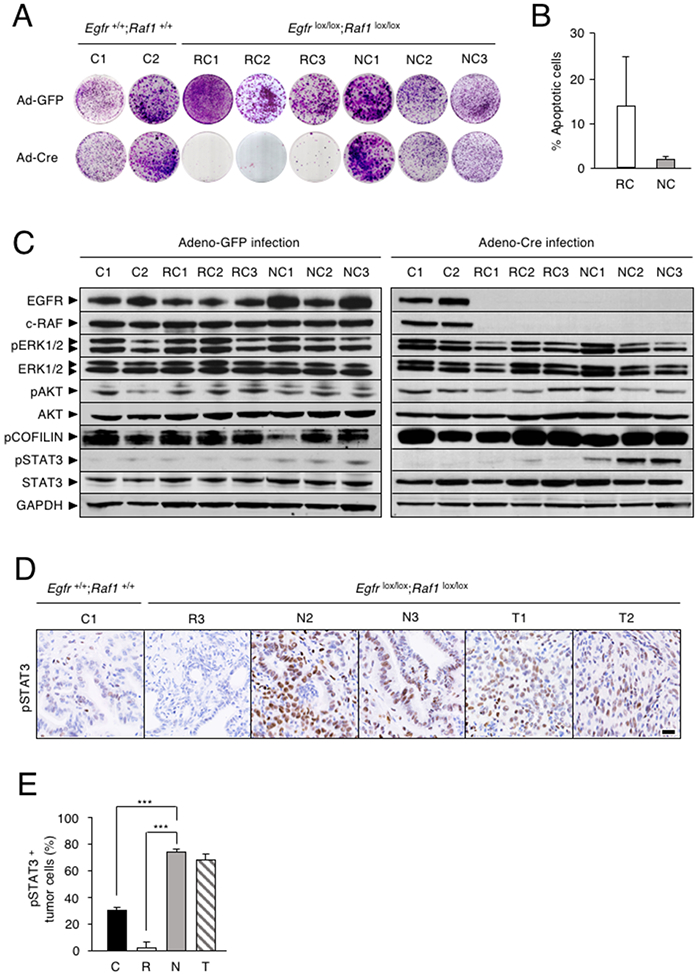
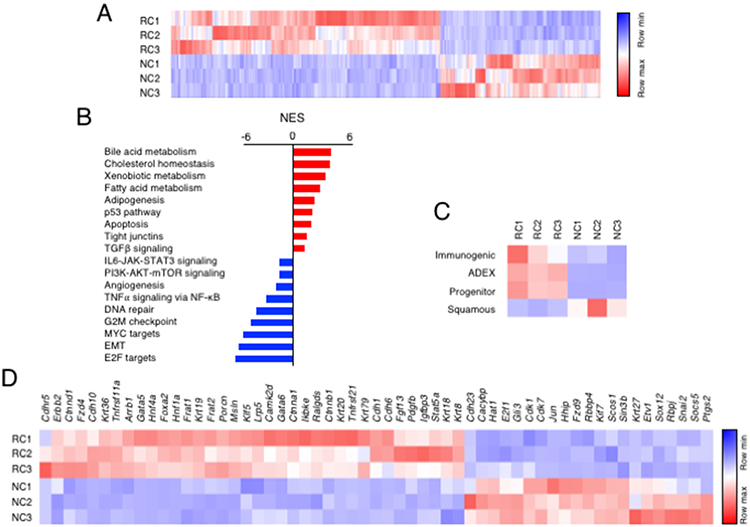
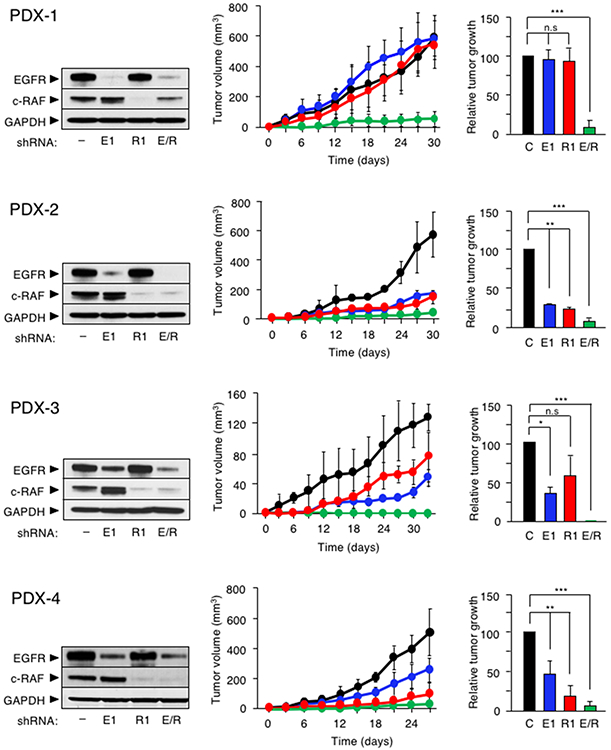
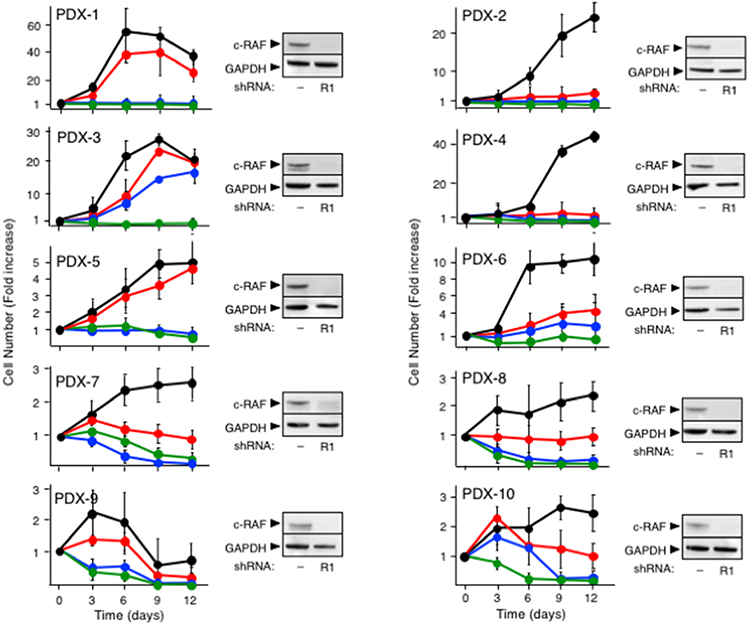
Five-year survival for pancreatic ductal adenocarcinoma (PDAC) patients remains below 7% due to the lack of effective treatments. Here, we report that combined ablation of EGFR and c-RAF expression results in complete regression of a significant percentage of PDAC tumors driven by Kras/Trp53 mutations in genetically engineered mice. Moreover, systemic elimination of these targets induces toxicities that are well tolerated. Response to this targeted therapy correlates with transcriptional profiles that resemble those observed in human PDACs. Finally, inhibition of EGFR and c-RAF expression effectively blocked tumor progression in nine independent patient-derived xenografts carrying KRAS and TP53 mutations. These results open the door to the development of targeted therapies for PDAC patients.

Keywords: Cdk4; EGFR; Erlotinib; PDX tumor models; Pancreatic cancer; c-Raf; therapeutic mouse models; transcriptional profiles; tumor regression.


Conflict of interest statement

DECLARATION OF INTERESTS

M.B. reports a research contract from Pfizer and Eli Lilly and paid consultancy from Amcure.

J.I. reports paid consultancy from Dynasio S.A. and Oncomedics, both in France.

M.H. reports research contracts and/or paid consultancy with Roche and Astra-Zeneca.

None of these relationships are related to the work reported in this manuscript.

We declare a patent application related to this work: EP18382555 Barbacid, M., Guerra C., Blasco, M.T., Navas, C. (2018). COMBINED THERAPY AGAINST CANCER.

Figures

Figure 1.
Figure 1.. Effect of Egfr, Raf1 and Cdk4 targeting on PDAC development
(A) Survival of control KPeC (black, n=20), KPeC;Cdk4K35M/K35M (orange, n=14), and KPeC;Egfrlox/lox;Cdk4K35M/K35M (gray, n=11) mice. All mice died of PDAC tumors at the indicated times. (B) Survival of control KPeC (black, n=20), KPeC;Raf1lox/lox (red, n=13), KPeC;Egfrlox/lox;Raf1+/lox (blue, n=10), KPeC;Egfr+/lox;Raf1lox/lox (pink, n=5) and KPeC;Egfrlox/lox;Raf1lox/lox (green, n=14) mice. All mice died of PDAC tumors at the indicated times. (C) PCR analysis of Egfr and Raf1 alleles using DNA extracted from laser captured acinar cells expressing K-RASG12V (identified by the X-Gal marker). Migration of recombined Egfr and Raf1 alleles (lane 1), conditional Egfrlox and Raf1lox alleles (lane 2) and wild-type Egfr+ and Raf1+ alleles (lane 3) used as controls. DNA extracted from X-Gal positive (lane 4) and negative (lane 5) acinar cells of KPeC;Egfrlox/lox;Raf1lox/lox mice. Lane 6, blank control. Lane M, DNA size markers. DNA fragment size is indicated. See also Table S1 and Figure S1.
Figure 2.
Figure 2.. Ablation of EGFR and c-RAF expression induces acceptable toxicities.
(A) Western blot analysis of EGFR, c-RAF, pERK1/2, ERK1/2, pAKT and AKT expression in tissues obtained from Egfr+/+;Raf1+/+;Tg.UBC-CreERT2 and Egfrlox/lox; Raf1lox/lox;Tg.UBC-CreERT2 mice after 3 weeks of TMX exposure. GAPDH served as a loading control. (B) Body weight change in Egfr+/+;Raf1 +/+;Tg.UBC-CreERT2 (solid circles, n=5) and Egfrlox/lox;Raf1lox/lox;Tg.UBC-CreERT2 mice (open circles n=5) exposed to TMX for the indicated length of time. Error bars indicate mean ± SD. (C) Representative H&E and Toluidine-blue staining of skin sections from Egfr+/+;Raf1+/+;Tg.UBC-CreERT2 and Egfrlox/lox;Raf1lox/lox;Tg.UBC-CreERT2 mice exposed to TMX for 15 weeks. Scale bars represent 100 μm (H&E) and 20 μm (toluidine blue). (D) Representative H&E and cleaved Caspase-3 staining in sections of small intestine of Egfr+/+;Raf1+/+;Tg.UBC-CreERT2 and Egfrlox/lox;Raf1lox/lox;Tg.UBC-CreERT2 mice exposed to TMX for 15 weeks. Scale bars represent 100 μm (H&E) and 20 μm (cleaved Caspase-3).
Figure 3.
Figure 3.. Egfr and Raf1 ablation induces regression of PDAC tumors.
(A) Total tumor volume visualized by weakly ultrasound imaging of KPeFC;Egfr+/+;Raf1+/+ control mice (n=10 mice, 15 tumors) exposed to a TMX diet for the indicated time. Each color represents a different mouse. Mice were sacrificed at humane end point due to tumor burden at the last time point indicated in the graph. C1 identifies the control mouse analyzed in panels D and E. C2 identifies the control mouse analyzed in Figure 4F (see below). (B) Total tumor volume visualized by weakly ultrasound imaging of KPeFC;Egfrlox/lox;Raf1lox/lox mice (n= 6 mice, 7 tumors) exposed to a TMX diet for the indicated time. Each color represents a different mouse. Mice were sacrificed for histopathological analysis at the last time point indicated in the graph. R1 to R6 identifies the “Regressor” mice analyzed in panels D and E (see below). (C) Representative ultrasound images of the regression of a large tumor present in the “Regressor” R3 mouse after 3 and 6 weeks of TMX exposure. Visible lesions are outlined. Tumor volumes are indicated. ND: not detectable. (D) Representative low (left, scale bar represents 1000 μm) and high (middle and right, scale bar represents 100 μm) magnification images of H&E and anti-cytokeratin19 (CK19) staining of sections of the pancreata of control KPeFC;Egfr+/+;Raf1+/+ (C1) and “Regressor” KPeFC;Egfrlox/lox;Raf1lox/lox (R1, R3-R6) mice after TMX exposure. The tumor present in the control C1 mouse is outlined by a dotted line. Box insets mark the areas shown at higher magnification in the right columns. (E) Representative images of H&E, anti-EGFR, anti-pERK and anti-Ki67 stained sections from control KPeFC;Egfr+/+;Raf1+/+ (C1) and “Regressor” KPeFC;Egfrlox/lox;Raf1lox/lox (R1, R3-R6) mice. Scale bar represents 20 μm. No scar lesions were observed in “Regressor” mouse R2. (F) Representative IHC staining of Cleaved Caspase 3 of sections of a pancreatic tumor (“Regressor”) from a KPeFC;Egfrlox/lox;Raf1lox/lox mouse that decreased 30% in volume after two weeks of TMX exposure and of tumors (“Non Responder”) from two independent KPeFC;Egfrlox/lox;Raf1lox/lox mice that continued growing during the same period of time. Scale bar represents 20 μm. See also Figure S2 and S3.
Figure 4.
Figure 4.. PDAC tumors of KPeFC mice resistant to Egfr and Raf1 ablation.
(A) Tumor volume visualized by weakly ultrasound imaging of KPeFC;Egfrlox/lox;Raf1lox/lox mice exposed to TMX. Each colour represents a different mouse. Mice were sacrificed at humane end point due to tumor burden at the last time point indicated in the graph. T1 and T2 identify “Resistant” mice analyzed in panels B and C (see below) (B) Western blot analysis of EGFR and c-RAF expression in lysates derived from PDAC present in KPeFC;Egfr+/+;Raf1+/+control C1 mouse depicted in Figure 3A and KPeFC;Egfrlox/lox;Raf1 lox/lox T2 mouse exposed to TMX for 11 weeks. GAPDH served as a loading control. (C) Representative H&E stained paraffin sections of the pancreata of KPeFC;Egfrlox/lox;Raf1lox/lox T1 and T2 mice after 10 and 11 weeks of TMX exposure, respectively. Tumors are outlined by a dotted line. Scale bar represents 1000 μm. Box insets mark areas shown at higher magnification in the adjacent images shown to the right stained for H&E, CK19, pERK and Ki67. Scale bar represents 50 μm. (D) Tumor volume visualized by weakly ultrasound imaging of KPeFC;Egfrlox/lox;Raf1lox/lox mice (n=4 mice, 4 tumors) exposed to a TMX diet for the indicated time. Each color represents a different mouse. Mice were sacrificed at humane end point due to tumor burden at the last time point indicated in the graph. N1 to N4 identify “Non Responder” mice analyzed in panels E to F (see below) (E) Representative ultrasound images of the progression of the tumor present in the “Non Responder” N2 mouse after 3 weeks of TMX exposure. Visible lesions are outlined. Tumor volumes are indicated. (F) Representative H&E stained paraffin sections of the pancreata of control C2 KPeFC;Egfr+/+;Raf1+/+ mouse (depicted in Figure 3A) and of “Non Responder” N1 and N2 KPeFC;Egfrlox/lox;Raf1lox/lox mice after four and five weeks of TMX exposure, respectively. Tumors are outlined by dotted lines. Scale bar represents 1000 μm. Box insets mark areas shown at higher magnification in the adjacent images shown to the right. stained for H&E, CK19, pERK and Ki67. Scale bar represents 50 μm. (G) Western blot analysis of EGFR and c-RAF expression in lysates obtained from PDAC present in control KPeFC;Egfr+/+;Raf1+/+ mice depicted in Figure 3A (C1-C3) and in “Non Responder” N1-N3 KPeFC;Egfrlox/lox;Raf1lox/lox mice exposed to TMX. Expression levels of pERK1/2, ERK1/2, pAKT and AKT are also shown. GAPDH served as a loading control.
Figure 5.
Figure 5.. Differential proliferative properties of PDAC cells lines upon ablation of EGFR and c-RAF expression.
(A) Colony formation assay of tumor cell lines established from individual PDACs of two KPeFC;Egfr+/+;Raf1+/+ control mice (C1 and C2) and of six KPeFC;Egfrlox/lox;Raf1lox/lox animals, 3 “Regressor cells” (RC1-RC3) and 3 “Non responder” cells (NC1-NC3). (B) Percentage of apoptotic cells (subG1 phase) at 96 hr after AdCre infection in (open bar) RC and (gray bar) NC cell lines (n=3). Error bars indicate mean ± SD. (C) Western blot analysis of EGFR, c-RAF, pERK1/2, ERK1/2, pAKT, AKT, pCOFILIN, pSTAT3 and STAT3 protein expression in whole cell extracts of the indicated cell lines obtained 5 days after AdGFP or AdCre infection. GAPDH served as a loading control. (D) pSTAT3 IHC in PDAC sections of KPeFC;Egfr+/+;Raf1+/+ (C1) mouse and KPeFC;Egfrlox/lox;Raf1lox/lox mice that harbored tumors that regressed (R3), progressed (N1, N3) or relapsed (T1, T2) upon Egfr and Raf1 ablation. Scale bar represents 20 μm. (E) Quantification of pSTAT3 positive tumor cells in PDAC sections from control KPeFC;Egfr+/+;Raf1+/+ (C, solid bar, n=3), “Regressor” KPeFC;Egfrlox/lox;Raf1lox/lox (R, open bar, n=3). “Non Responder” KPeFC;Egfrlox/lox;Raf1lox/lox (N, grey bar, n=3) and “Resistant” KPeFC;Egfrlox/lox;Raf1lox/lox (T, striped bar, n=2) mice. Error bars indicate standard deviation. p values were calculated using the unpaired Student’s t test. ***p < 0.001.
Figure 6.
Figure 6.. Differential transcriptional profiles of PDAC cells sensitive and resistant to Egfr and Raf1 ablation.
(A) Heatmap representing color-coded expression levels of differentially expressed genes in “Regressor” (RC) vs “Non Responder” (NC) cells infected with AdGFP particles. (B) GSEA pathway analysis of RC vs NC cells. Pathways enriched in “Regressor” RC (red bars) and “Non Responder” NC (blue bars) cells are indicated. The normalized enrichment score (NES) ranking was generated by the GSEA. (C) Heatmap comparing the transcriptional profiles of RC and NC cells with those of human PDAC (Bailey et al., 2016). (D) Genes selected from the two thousand genes differentially expressed between RC and NC cells based on their involvement in signaling pathways known to participate in the development and/or progression of PDAC. Genes are ordered according to the log2 fold change. See also Table S2.
Figure 7.
Figure 7.. EGFR and c-RAF expression are required for proliferation of cells derived from PDX tumor models.
Western blot analysis of EGFR and c-RAF protein expression in whole cell extracts obtained from (left), tumor growth curve (center), and quantification of tumor growth at the end of the experiment (right) of the indicated PDX cell line infected with a scramble shRNA (–, black) or with shRNAs against EGFR (E1, blue), c-RAF (R1, red) and EGFR plus c-RAF (E/R, green). GAPDH served as a loading control. Error bars indicate mean ± SD. p values were calculated using the unpaired Student’s t test. *p < 0.05, **p < 0.01, ***p < 0.001. n.s: no significant. See also Table S3 and Figure S4.
Figure 8.
Figure 8.. Pharmacologic inhibition of EGFR in combination with c-RAF knockdown inhibits proliferation of PDAC cells derived from PDX tumor models.
Cell proliferation of the indicated PDX-derived cells infected with scramble shRNA (black), infected with shRNA R1 against c-RAF (red), infected with shRNA R1 against c-RAF and exposed to Gefitinib (IC50) (green), infected with shRNA R1 against c-RAF and exposed to Erlotinib (IC50) (blue) (left) and Western blot analysis of c-RAF expression in whole cell extracts obtained from the indicated PDX-derived cells using either a scramble shRNA (−) or a shRNAs against c-RAF (R1) (right). Proliferation was determined by CellTiter-Glo and expressed as fold increase in the number of cells determined at each of the indicated days. Error bars indicate mean ± SD. GAPDH served as loading control in Western blot. See also Table S4.

References

    1. Aguirre AJ, Nowak JA, Camarda ND, Moffitt RA, Ghazani AA, Hazar-Rethinam M, Raghavan S, Kim J, Brais LK, Ragon D, et al. (2018). Real-time genomic characterization of advanced pancreatic cancer to enable precision medicine. Cancer Discov. CD-18-0275 - PMC - PubMed
    1. Ardito CM, Grüner BM, Takeuchi KK, Lubeseder-Martellato C, Teichmann N, Mazur PK, DelGiorno KE, Carpenter ES, Halbrook CJ, Hall JC, et al. (2012). EGF Receptor Is Required for KRAS-Induced Pancreatic Tumorigenesis. Cancer Cell 22, 304–317. - PMC - PubMed
    1. Bailey P, Chang DK, Nones K, Johns AL, Patch A-M, Gingras M-C, Miller DK, Christ AN, Bruxner TJC, Quinn MC, et al. (2016). Genomic analyses identify molecular subtypes of pancreatic cancer. Nature 531, 47–52. - PubMed
    1. Biankin AV, Waddell N, Kassahn KS, Gingras M-C, Muthuswamy LB, Johns AL, Miller DK, Wilson PJ, Patch A-M, Wu J, et al. (2012). Pancreatic cancer genomes reveal aberrations in axon guidance pathway genes. Nature 491, 399–405. - PMC - PubMed
    1. Blasco RB, Francoz S, Santamaría D, Cañamero M, Dubus P, Charron J, Baccarini M, and Barbacid M (2011). C-Raf, but Not B-Raf, Is Essential for Development of K-Ras Oncogene-Driven Non-Small Cell Lung Carcinoma. Cancer Cell 19, 652–663. - PMC - PubMed

Publication types

MeSH terms