. 2019 May:43:537-552.
doi: 10.1016/j.ebiom.2019.04.007. Epub 2019 Apr 8.

Unmasking a new prognostic marker and therapeutic target from the GDNF-RET/PIT1/p14ARF/p53 pathway in acromegaly

Affiliations

Unmasking a new prognostic marker and therapeutic target from the GDNF-RET/PIT1/p14ARF/p53 pathway in acromegaly

Miguel Chenlo et al. EBioMedicine. 2019 May.

Abstract

Background: Acromegaly is produced by excess growth hormone secreted by a pituitary adenoma of somatotroph cells (ACRO). First-line therapy, surgery and adjuvant therapy with somatostatin analogs, fails in 25% of patients. There is no predictive factor of resistance to therapy. New therapies are investigated using few dispersed tumor cells in acute primary cultures in standard conditions where the cells do not grow, or using rat pituitary cell lines that do not maintain the full somatotroph phenotype. The RET/PIT1/p14ARF/p53 pathway regulates apoptosis in normal pituitary somatotrophs whereas the RET/GDNF pathway regulates survival, controlling PIT1 levels and blocking p14ARF (ARF) and p53 expression.

Methods: We investigated these two RET pathways in a prospective series of 32 ACRO and 63 non-functioning pituitary adenomas (NFPA), studying quantitative RNA and protein gene expression for molecular-clinical correlations and how the RET pathway might be implicated in therapeutic success. Clinical data was collected during post-surgical follow-up. We also established new'humanized' pituitary cultures, allowing 20 repeated passages and maintaining the pituitary secretory phenotype, and tested five multikinase inhibitors (TKI: Vandetanib, Lenvatinib, Sunitinib, Cabozantinib and Sorafenib) potentially able to act on the GDNF-induced RET dimerization/survival pathway. Antibody arrays investigated intracellular molecular pathways.

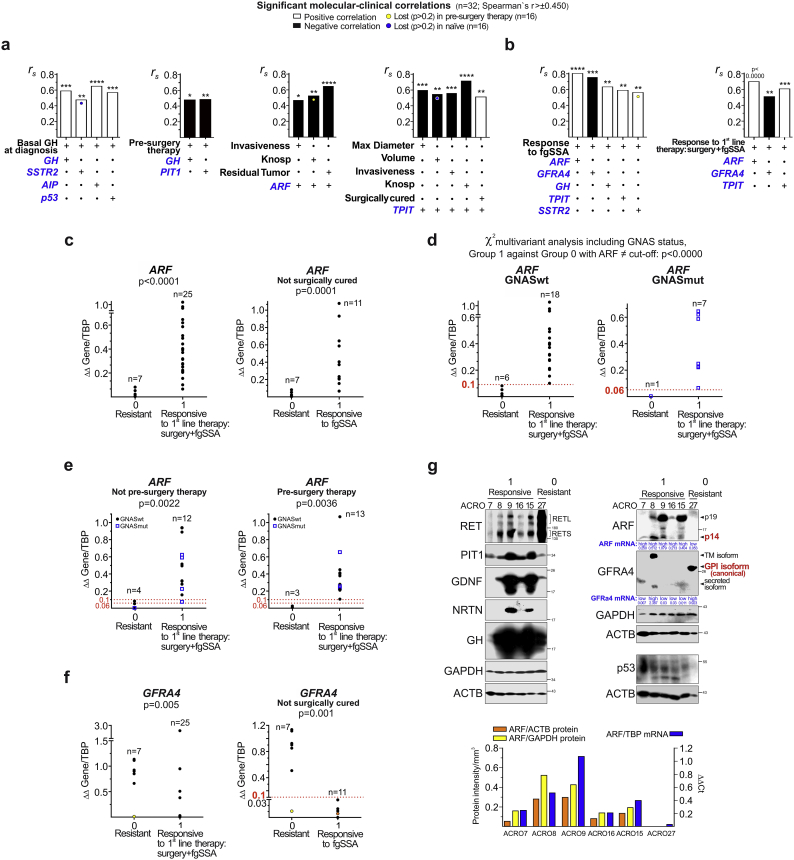
Findings: In ACRO, there was specific enrichment of all genes in both RET pathways, especially GDNF. ARF and GFRA4 gene expression were found to be opposing predictors of response to first-line therapy. ARF cut-off levels, calculated categorizing by GNAS mutation, were predictive of good response (above) or resistance (below) to therapy months later. Sorafenib, through AMPK, blocked the GDNF/AKT survival action without altering the RET apoptotic pathway.

Interpretation: Tumor ARF mRNA expression measured at the time of the surgery is a prognosis factor in acromegaly. The RET inhibitor, Sorafenib, is proposed as a potential treatment for resistant ACRO. FUND: This project was supported by national grants from Agencia Estatal de Investigación (AEI) and Instituto Investigación Carlos III, with participation of European FEDER funds, to IB (PI150056) and CVA (BFU2016-76973-R). It was also supported initially by a grant from the Investigator Initiated Research (IIR) Program (WI177773) and by a non-restricted Research Grant from Pfizer Foundation to IB. Some of the pituitary acromegaly samples were collected in the framework of the Spanish National Registry of Acromegaly (REMAH), partially supported by an unrestricted grant from Novartis to the Spanish Endocrine Association (SEEN). CVA is also supported from a grant of Medical Research Council UK MR/M018539/1.

Keywords: ARF; Acromegaly; Endoscopy surgery; GFRA4; Human pituitary cultures; Pituitary tumors; SSA-resistance; Somatotropinomas; Sorafenib.


Figures

Fig. 1
Fig. 1
mRNA expression characterizing ACRO and the RET pathway. a) Quantitative RNA expression comparing mean ± SEM ACRO (n = 32, blue bars) and NFPA (n = 56–63, pink bars). In every sample, gene expression was normalized to a commercial pool of pituitary poly-A mRNA (technical control; white bars). Genes most highly expressed in ACRO were characteristic of functional pituitary somatotrophs, related to GH secretion (GHTaq (22 KDa), GHSybr (22, 20 and 17 KDa)), or PIT1 and hypothalamic regulation (GHRHR, SSTR2, SSTR5). However, the RET receptor (RETN), its ligand GDNF and genes in the RET pathway regulated at the RNA level (ARF and PIT1) were significantly more abundant in ACRO than NFPA. p53 was slightly upregulated in ACRO. SF-1 was characteristic of NFPA, and T-PIT of ACTH-secreting adenomas (orange bar). (Mann-Whitney test). b) Cartoon representing isoforms of the RET receptor, differing at the C-terminal tail (long RETL and short RETS), its four ligands and its GFR-alpha co-receptors (GFRA1–4). Although there is preference of a ligand for a co-receptor, cross-interaction exists. In somatotrophs in the absence of ligand, RET is processed by Caspase-3 generating an intracellular fragment (IC-RET) that triggers a cell-death pathway through overexpression of PIT1 gene inducing p14ARF expression, p53 accumulation and apoptosis. When the ligand is present, RET dimerizes and activates its cytoplasmic tyrosine kinase activity leading to AKT phosphorylation and survival. c) In ACRO, both RETL and RETS are expressed in approximately equal amounts. Although all four RET co-receptors were expressed, the most highly expressed was GFRA1 (high affinity for GDNF), followed by GFRA4. (ANOVA). d) GDNF was by far the most highly expressed ligand, with NTRN and PSPN also abundantly expressed. (ANOVA). e) Significant correlations among all the genes studied in ACRO (rs > 0·36) revealed that GDNF expression was significantly and positively correlated with expression of RET isoforms and the other ligands. GDNF (and NRTN) were negatively correlated with PIT1 expression but positively correlated with PROP1. As expected, expression of both transcription factors PIT1 and PROP1 were negatively correlated. PROP1 was also correlated with GFRA1 and SF1. ARF expression was significantly correlated with the somatotroph phenotype (GH, GHRHR, AIP), T-PIT and the ligand ARTN. (Spearman test). Weakest correlations were lost (p > .2) when the naïve group (N = 16) was analysed separately from the group receiving pre-surgery therapy (N = 16). Yellow dots: correlations lost in pre-surgery therapy group; Blue dots: correlations lost in naïve group. f) Genes implicated in lost correlations were not differentially expressed between both groups except for PIT1 and GH that were significantly reduced in the pre-surgery therapy group (all Mann-Whitney test except ARF t-Test). (p < 0·05; **, p < 0·01; ***, p < 0·001; ****, p < 0·0001; 0·0000 means lower p). (For interpretation of the references to colour in this figure legend, the reader is referred to the web version of this article.)
Fig. 2
Fig. 2
ARF mRNA expression as a prognostic marker for ACRO resistant to first-line combined treatment (sugery + fgSSA). GFRA4 as a prognostic marker only for those not cured by surgery. a-b: Significant correlations (Spearman test, rs > 0·5) between mRNA expression and clinical variables (diagnostic, pathologic and prognostic/follow-up) (See also Supplementary Table 1). Dots: blue, correlations not existing in naïve samples; yellow: correlations lost in the pre-surgery therapy group. a) Left: serum GH at diagnosis was correlated with GH, SSTR2 (only if pre-treated), AIP and p53. Centre: Pre-surgery therapy was negatively correlated with GH and PIT1. ARF was negatively correlated with the negative characteristics of the tumor (invasiveness (only if naïve), Knosp grade, residual tumor). Right: TPIT was negatively correlated with negative tumor characteristics (diameter, volume (only if pre-treated), invasiveness and Knosp) but positively correlated with surgical cure. b) Left: ARF was the strongest positive marker for response to adjuvant treatment with fgSSA (rs > 0·8). GFRA4 was the second-strongest marker but negatively correlated with response (rs > 0·7). GH, TPIT and SSTR2 (only if naïve) showed some positive correlation with response to analogs (rs 0·5–0·6). Right: Combining first-line treatments (surgery+fgSSA) into a single category, ARF (rs > 0·7) and GFRA4 (rs = 0·5) were the most significant positively and negatively correlated markers, respectively, followed by TPIT (rs = 0·6) as a positive marker. c-f: Patients were categorized into two groups, Group 0 (Resistant: Not cured by surgery and resistant to analogs) and Group 1 (Responsive to first-line treatment, either cured by surgery or controlled with analogs). A subanalysis of patients not cured by surgery was also performed. c) ARF expression was a good discriminator of Group 0 and Group 1, both in the series as a whole (p < 0·0001) and in patients not cured by surgery (p = 0·0002). d) Samples were categorized with different cutoffs for non-mutated (GNASwt cutoff 0·1) or mutated (GNASmut, cutoff 0·06) GNAS; Chi-squared tests classified all samples. e) A subanalysis of naïve patients and those with pre-surgery therapy including categorizing by GNAS demonstrated the ability of ARF to separate Group 0 from Group 1 in either group of patients with similar cutoffs. f) Left: Enhanced GFRA4 expression was not a good classifier for ACRO as some in Group 1 (Responsive, high ARF) had high GFRA4 expression. Right: In the group of non-surgically cured, GFRA4 was a good classifier in the opposite way to ARF, with high levels in Group 0 (Resistant to first-line therapy). Coloured dots show reoperations after radiotherapy (Group 0, yellow; Group 1, orange). g) Western blots of RET pathway (RET, PIT1, ARF, p53) and ligand (GDNF, NRTN) proteins with controls (GH, GAPDH, ACTB) from ACRO tissue extracts (Group 1 (Responsive) and Group 0 (Resistant)). ARF and GFRa4 protein levels corroborated mRNA levels described above. ACRO27 (Group 0) expressed high RET but low PIT-1 protein levels, correlating with absence of p14ARF and p53. GFRA4 showed three different molecular weights corresponding to distinct isoforms. The RET co-receptor (GPI, canonical isoform) was highly expressed in ACRO27 (Group 0) while ACRO7 and ACRO8 (Group 1) expressed different non-RET co-receptor isoforms. Quantification of ARF protein band intensity respect to controls, ACTB (yellow bars) or GAPDH (orange bars), in relation to the ARF mRNA expression (blue bars). (c-e-f Mann-Whitney test; d Chi-square test. *, p < 0·05; **, p < 0·01; ***, p < 0·001; ****, p < 0·0001; 0·0000 means lower p). (For interpretation of the references to colour in this figure legend, the reader is referred to the web version of this article.)
Fig. 3
Fig. 3
Primary cultures of human acromegaly in humanized conditions (h7H) unveiled Sorafenib as a potential new treatment. a) Acromegaly (P-ACRO28, P-ACRO30 and P-ACRO32) and NFPA (P-NFPA41) cultured in h7H conditions grew for many passages while maintaining mRNA expression of key genes from Fig. 1: in ACRO, GH, PIT1, GHRHR, RETL and RETS isoforms, SSTR2 and 5; in NFPA, SF1. Data are normalized to the first acromegaly P-ACRO28. Passage was performed by splitting the culture in two (shown by small ‘p’). b) Left: Human GH (hGH) was secreted by cultured ACRO into the medium as demonstrated by western blot. Centre: Quantitative hGH (pg/mL) measurements performed in whole medium taken just before passaging. Right: Secretion was normalized by cell count and length of incubation with the cells (3–4 days). c) Human GDNF (hGDNF) was secreted into the medium by ACRO, but not by NFPA, as demonstrated by ELISA. Secretion was increased as cells grew, as shown for ACRO32. d) When cells were deprived of GDNF, RET processing induced apoptosis (white bar) that was blocked by addition of GDNF (hatched white bars). Five TKIs used for other neuroendocrine tumors (Vandetanib (V), Lenvatinib (L), Sunitinib (Su), Cabozantinib (C) and Sorafenib (So)) were tested against the survival action of GDNF at clinically relevant concentrations. Three independent cultures are shown: P-ACRO28, P-ACRO30 and P-ACRO32. Some of the inhibitors enhanced RET-dependent apoptosis in the absence of GDNF (black bars) but did not have a strong effect on GDNF-induced survival (black hatched bars). Sorafenib was the only TKI that potently blocked the GDNF survival effect in the three ACRO without exacerbating RET apoptosis in the absence of GDNF (which we assumed to be a toxic effect). e) Dose-response curve of Sorafenib in P-ACRO30 and P-ACRO32, demonstrating a GDNF-counteracting effect at lower doses than those used in cancer treatment. f) Sorafenib could also block the survival effect of NRTN and combined GDNF+NRTN. g) Sorafenib could block the survival effect of GDNF on both human RETL and RETS isoforms, transfected in the non-RET-expressing rat pituitary somatotroph cell line GH4C1. (n.d. = not detected). (d-g: Mean ± SEM. ANOVA test, all bars compared to white bar –deprived in the absence of GDNF-) (*, p < 0·05; **, p < 0·01; ***, p < 0·001; ****, p < 0·0001).
Fig. 4
Fig. 4
Blocking of RET signal transduction by Sorafenib exchanged the RET-GDNF survival pathway for the RET apoptotic pathway. a) Antibody array performed with extracts from P-ACRO30 and P-ACRO32 following one- hour incubations in each of four conditions: deprivation (no GDNF), GDNF (500 ng/mL), Sorafenib (4 microg/mL) or Sorafenib+GDNF. b) Signal quantification (Mean ± SEM. ANOVA test): GDNF induced AKT/MTOR phosphorylation, and downregulated active p-p53 (Ser15 p-p53), as well as cleaved PARP (cl-PARP) and Caspase-3 (cl-CASP3), hallmarks of apoptosis. Sorafenib blocked the AKT pathway, inducing phosphorylation of AMPK, p53 and apoptotic markers. c-e) Western blots with different cell extracts confirmed the results of the array. c) At 1 h in membrane extracts, GDNF induced full-length RET phosphorylation and blocked Caspase-3 cleavage; both were prevented by Sorafenib. d) At 1 h in cytoplasmic extracts, GDNF phosphorylated AKT, mTOR and, less intensely, S6K while preventing p53 phosphorylation. In the presence of Sorafenib, GDNF was unable to activate the AKT/MTOR pathway, but induced phosphorylation of AMPK and p53. As expected, the caspase-processed cytoplasmic fragment of RET (IC-RET) was strongly expressed in deprived cells in the absence of GDNF, reduced in the presence of GDNF and recovered with Sorafenib. e) In cells deprived of GDNF for 24 h, PIT1 was induced, activating ARF expression and p53 accumulation, thus leading to apoptosis. GDNF reduced PIT1, ARF and p53 expression, all of which recovered in the presence of Sorafenib. (*, p < 0·05; **, p < 0·01; ***, p < 0·001).

References

    1. Ezzat S., Asa S.L., Couldwell W.T., Barr C.E., Dodge W.E., Vance M.L. The prevalence of pituitary adenomas: a systematic review. Cancer. 2004;101:613–619. - PubMed
    1. Hernández-Ramírez L.C., Gabrovska P., Dénes J., Stals K., Trivellin G., Tilley D. Landscape of familial isolated and young-onset pituitary adenomas: prospective diagnosis in AIP mutation carriers. J Clin Endocrinol Metab. 2015;100:E1242–E1254. - PMC - PubMed
    1. Pivonello R., Auriemma R.S., Grasso L.F., Pivonello C., Simeoli C., Patalano R. Complications of acromegaly: cardiovascular, respiratory and metabolic comorbidities. Pituitary. 2017;20:46–62. - PubMed
    1. Terzolo M., Reimondo G., Berchialla P., Ferrante E., Malchiodi E., De Marinis L. Italian Study Group of Acromegaly. Acromegaly is associated with increased cancer risk: a survey in Italy. Endocr Relat Cancer. 2017;24:495–504. - PubMed
    1. Gadelha M.R., Kasuki L., Lim D.S., Fleseriu M. Systemic complications of acromegaly and the impact of the current treatment landscape: an update. Endocr Rev. 2018 - PubMed

MeSH terms

Substances