. 2019 Jul;18(7):1454-1467.
doi: 10.1074/mcp.TIR119.001431. Epub 2019 Apr 11.

Sensitive Quantitative Proteomics of Human Hematopoietic Stem and Progenitor Cells by Data-independent Acquisition Mass Spectrometry

Affiliations

Sensitive Quantitative Proteomics of Human Hematopoietic Stem and Progenitor Cells by Data-independent Acquisition Mass Spectrometry

Sabine Amon et al. Mol Cell Proteomics. 2019 Jul.

Abstract

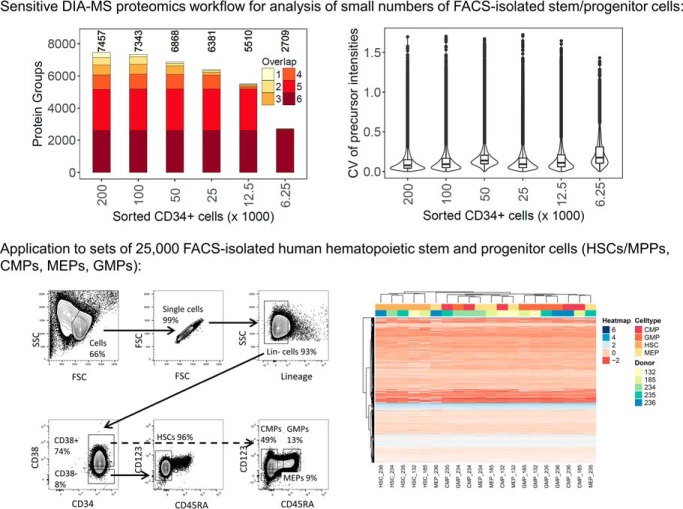
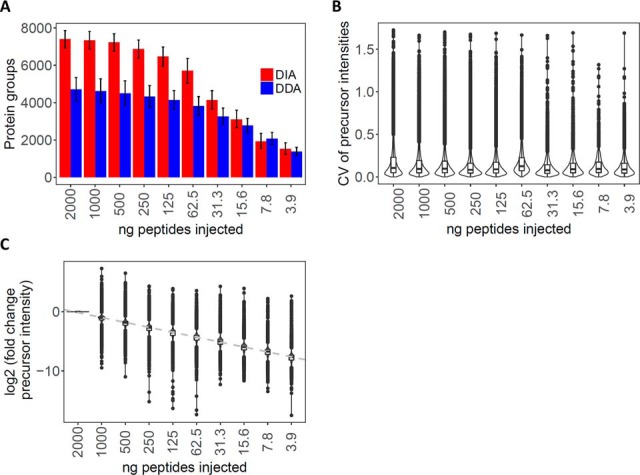
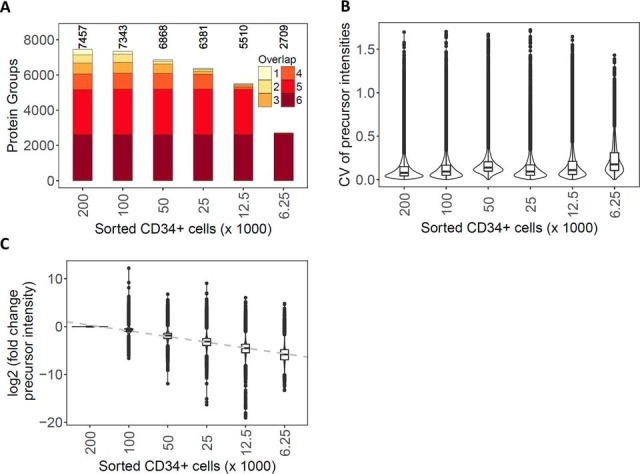
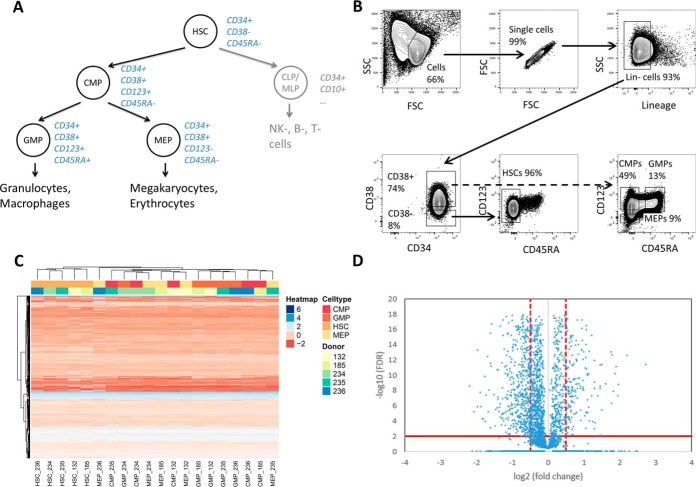
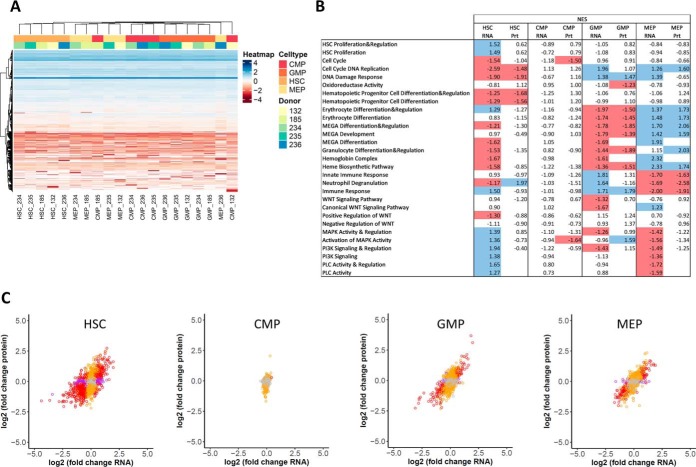
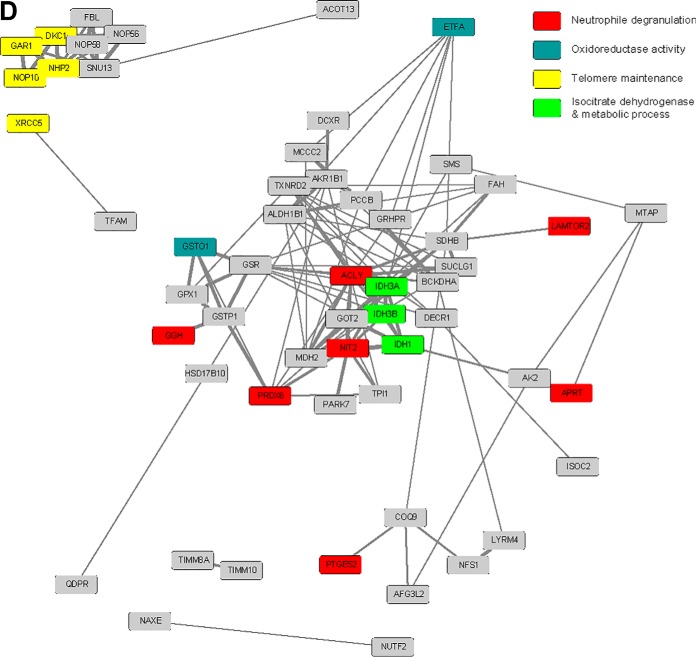
Physiological processes in multicellular organisms depend on the function and interactions of specialized cell types operating in context. Some of these cell types are rare and thus obtainable only in minute quantities. For example, tissue-specific stem and progenitor cells are numerically scarce, but functionally highly relevant, and fulfill critical roles in development, tissue maintenance, and disease. Whereas low numbers of cells are routinely analyzed by genomics and transcriptomics, corresponding proteomic analyses have so far not been possible due to methodological limitations. Here we describe a sensitive and robust quantitative technique based on data-independent acquisition mass spectrometry. We quantified the proteome of sets of 25,000 human hematopoietic stem/multipotent progenitor cells (HSC/MPP) and three committed progenitor cell subpopulations of the myeloid differentiation pathway (common myeloid progenitors, megakaryocyte-erythrocyte progenitors, and granulocyte-macrophage progenitors), isolated by fluorescence-activated cell sorting from five healthy donors. On average, 5,851 protein groups were identified per sample. A subset of 4,131 stringently filtered protein groups was quantitatively compared across the 20 samples, defining unique signatures for each subpopulation. A comparison of proteomic and transcriptomic profiles indicated HSC/MPP-specific divergent regulation of biochemical functions such as telomerase maintenance and quiescence-inducing enzymes, including isocitrate dehydrogenases. These are essential for maintaining stemness and were detected at proteome, but not transcriptome, level. The method is equally applicable to almost any rare cell type, including healthy and cancer stem cells or physiologically and pathologically infiltrating cell populations. It thus provides essential new information toward the detailed biochemical understanding of cell development and functionality in health and disease.

Keywords: Cell Sorting; Clinical Proteomics; Data-Independent Acquisition Mass Spectrometry; Differentiation*; Fluorescence-Activated Cell Sorting; Hematopoietic Stem and Progenitor Cells; Low Cell Number; Mass Spectrometry; Proteomics; Quantification.


Conflict of interest statement

R.A. holds shares of Biognosys AG, which operates in the field covered by the article. The remaining authors declare no competing financial interests

Figures

None
Graphical abstract
Fig. 1.
Fig. 1.
HEK293 tryptic digests dilution series. (A) Number of protein groups identified in DDA (blue) and DIA (red) mode, respectively, for decreasing loads of HEK293 tryptic peptides. The bars in the negative and positive directions represent the number of protein groups identified in common (intersection) or in total (union) for the technical triplicate injections at the indicated peptide loads, respectively. (B) Distribution of the CV for the peptide precursor intensities for the technical (process) triplicate injections for each sample load. (C) Distribution of the fold change (log2 scale) of the average precursor intensities between a given sample load and that at 2,000 ng sample load.
Fig. 2.
Fig. 2.
Dilution series of human CD34+ hematopoietic cells isolated by FACS. (A) Number of protein groups cumulatively identified across the technical replicates for decreasing numbers of FACS-isolated human CD34+ hematopoietic cells. The color scale represents the consistency of protein group identifications across the runs. (B) Distribution of the CV for the peptide precursor intensities for the technical (process) triplicate injections of processed FACS-isolated cells. (C) Distribution of the fold change (in log2 scale) of the average precursor intensities between a given sample load and that at 200,000 FACS-isolated human CD34+ hematopoietic cells.
Fig. 3.
Fig. 3.
Proteome profiles of human hematopoietic stem and progenitor cell subpopulations. (A) Human hematopoietic cell hierarchy with respective cell surface markers depicted in blue (–17). (B) FACS strategy, depicted on magnetic-activated cell sorting-preselected CD34+ hematopoietic cells isolated from healthy HSPC donors. Shown are the analysis gates. Highly enriched HSCs/MPPs (referred to as HSCs) are CD34+CD38-CD45RA-, highly enriched CMPs are CD34+CD38+CD123+CD45RA-, highly enriched GMPs are CD34+CD38+CD123+CD45RA+, and highly enriched MEPs are CD34+CD38+CD123-CD45RA-. (C) Nonsupervised hierarchical clustering (Euclidean distance) heatmap (78) of intensities for the peptides identified in HSCs, CMPs, GMPs, and MEPs (shades of red) isolated from five different donors (shades of blue). The peptide intensities are centered and scaled and depicted in color shades from red to blue. The missing peptide intensity values are shown in white. (D) Volcano plot of differential analysis of proteins. Comparison of HSCs to the average of the three other cell types. Abbreviations: HSPC, hematopoietic stem and progenitor cell; HSC, hematopoietic stem/multipotent progenitor cell; CMP, common myeloid progenitor; CLP/MLP, common/multipotent lymphoid progenitor; GMP, granulocyte-macrophage progenitor; MEP, megakaryocyte-erythrocyte progenitor; SSC, side scatter; FSC, forward scatter.
Fig. 4.
Fig. 4.
Proteome-transcriptome correlation in human hematopoietic stem and progenitor cell subpopulations. (A) Nonsupervised hierarchical clustering (Euclidean distance) heatmap (78) of the intensity for the transcripts identified in HSCs/MPPs (referred to as HSCs), CMPs, GMPs, and MEPs (shades of red) isolated from five different HSPC donors (shades of blue). The transcript intensities are centered and scaled and depicted in color shades from red to blue. The transcripts with missing transcript intensity values in all samples were removed because they could not be handled by the clustering algorithm. Remaining missing transcript intensity values are shown in white. Clustering was observed mostly according to cell type, not according to donor. (B) GO enrichment analysis showed good alignment of protein and mRNA data. GSEA was performed for ranked mRNA and protein lists using GO processes from the Gene Ontology Consortium database as gene sets. Shown are normalized enrichment scores for the individual gene sets. Significantly up-regulated gene sets are marked in blue color; significantly downregulated gene sets are marked in red color. Significance was defined as FDR < 0.25, specific cell subpopulations were compared with the average of the remaining three cell types, and log2(fold change) was used as ranking criterion. Empty fields mean that no enrichment could be calculated. Abbreviations: MEGA, megakaryocyte; MAPK, mitogen-activated protein kinase; PI3K, phosphoinositide-3-kinase; PLC, phospholipase C. (C) Correlation between proteomics and transcriptomics data for HSCs/MPPs (referred to as HSCs), CMPs, GMPs, and MEPs. Dots are depicted in red when the FDR was below 0.01 both for protein and RNA data, orange when FDR < 0.01 for protein data, purple when FDR < 0.01 for RNA data, and gray when FDR ≥ 0.01 for both protein and RNA data. (D) Network analysis of significantly up-regulated proteins with concomitant significantly downregulated mRNA in HSCs/MPPs. Two clusters were especially prominent, including the snoRNPs and telomerase complex proteins GAR1, DKC1, NOP10, NHP2, and the quiescence-inducing NAD(P)H-producing proteins IDH1, IDH3A, and IDH3B. HSCs/MPPs were compared with the average of the other three subpopulations; cutoffs were set at FDR < 0.01 for protein and RNA data. Colors depict GO terms found enriched in Fig 4B.
Fig. 4.
Fig. 4.
Proteome-transcriptome correlation in human hematopoietic stem and progenitor cell subpopulations. (A) Nonsupervised hierarchical clustering (Euclidean distance) heatmap (78) of the intensity for the transcripts identified in HSCs/MPPs (referred to as HSCs), CMPs, GMPs, and MEPs (shades of red) isolated from five different HSPC donors (shades of blue). The transcript intensities are centered and scaled and depicted in color shades from red to blue. The transcripts with missing transcript intensity values in all samples were removed because they could not be handled by the clustering algorithm. Remaining missing transcript intensity values are shown in white. Clustering was observed mostly according to cell type, not according to donor. (B) GO enrichment analysis showed good alignment of protein and mRNA data. GSEA was performed for ranked mRNA and protein lists using GO processes from the Gene Ontology Consortium database as gene sets. Shown are normalized enrichment scores for the individual gene sets. Significantly up-regulated gene sets are marked in blue color; significantly downregulated gene sets are marked in red color. Significance was defined as FDR < 0.25, specific cell subpopulations were compared with the average of the remaining three cell types, and log2(fold change) was used as ranking criterion. Empty fields mean that no enrichment could be calculated. Abbreviations: MEGA, megakaryocyte; MAPK, mitogen-activated protein kinase; PI3K, phosphoinositide-3-kinase; PLC, phospholipase C. (C) Correlation between proteomics and transcriptomics data for HSCs/MPPs (referred to as HSCs), CMPs, GMPs, and MEPs. Dots are depicted in red when the FDR was below 0.01 both for protein and RNA data, orange when FDR < 0.01 for protein data, purple when FDR < 0.01 for RNA data, and gray when FDR ≥ 0.01 for both protein and RNA data. (D) Network analysis of significantly up-regulated proteins with concomitant significantly downregulated mRNA in HSCs/MPPs. Two clusters were especially prominent, including the snoRNPs and telomerase complex proteins GAR1, DKC1, NOP10, NHP2, and the quiescence-inducing NAD(P)H-producing proteins IDH1, IDH3A, and IDH3B. HSCs/MPPs were compared with the average of the other three subpopulations; cutoffs were set at FDR < 0.01 for protein and RNA data. Colors depict GO terms found enriched in Fig 4B.

References

    1. Laurenti E., Doulatov S., Zandi S., Plumb I., Chen J., April C., Fan J. B., and Dick J. E. (2013) The transcriptional architecture of early human hematopoiesis identifies multilevel control of lymphoid commitment. Nat Immunol 14, 756–763 - PMC - PubMed
    1. Notta F., Zandi S., Takayama N., Dobson S., Gan O. I., Wilson G., Kaufmann K. B., McLeod J., Laurenti E., Dunant C. F., McPherson J. D., Stein L. D., Dror Y., and Dick J. E. (2016) Distinct routes of lineage development reshape the human blood hierarchy across ontogeny. Science 351, aab2116. - PMC - PubMed
    1. Jan M., Snyder T. M., Corces-Zimmerman M. R., Vyas P., Weissman I. L., Quake S. R., and Majeti R. (2012) Clonal evolution of preleukemic hematopoietic stem cells precedes human acute myeloid leukemia. Sci. Transl. Med. 4, 149ra118 - PMC - PubMed
    1. Corces-Zimmerman M. R., Hong W. J., Weissman I. L., Medeiros B. C., and Majeti R. (2014) Preleukemic mutations in human acute myeloid leukemia affect epigenetic regulators and persist in remission. Proc. Natl. Acad. Sci. U.S.A. 111, 2548–2553 - PMC - PubMed
    1. Shlush L. I., Zandi S., Mitchell A., Chen W. C., Brandwein J. M., Gupta V., Kennedy J. A., Schimmer A. D., Schuh A. C., Yee K. W., McLeod J. L., Doedens M., Medeiros J. J., Marke R., Kim H. J., Lee K., McPherson J. D., Hudson T. J., HALT Pan-Leukemia Gene Panel Consortium, Brown A. M., Yousif F., Trinh Q. M., Stein L. D., Minden M. D., Wang J. C., and Dick J. E. (2014) Identification of pre-leukaemic haematopoietic stem cells in acute leukaemia. Nature 506, 328–333 - PMC - PubMed

Publication types