. 2020 Jan;105(1):148-160.
doi: 10.3324/haematol.2018.208835. Epub 2019 Apr 11.

Homoharringtonine exhibits potent anti-tumor effect and modulates DNA epigenome in acute myeloid leukemia by targeting SP1/TET1/5hmC

Affiliations

Homoharringtonine exhibits potent anti-tumor effect and modulates DNA epigenome in acute myeloid leukemia by targeting SP1/TET1/5hmC

Chenying Li et al. Haematologica. 2020 Jan.

Abstract

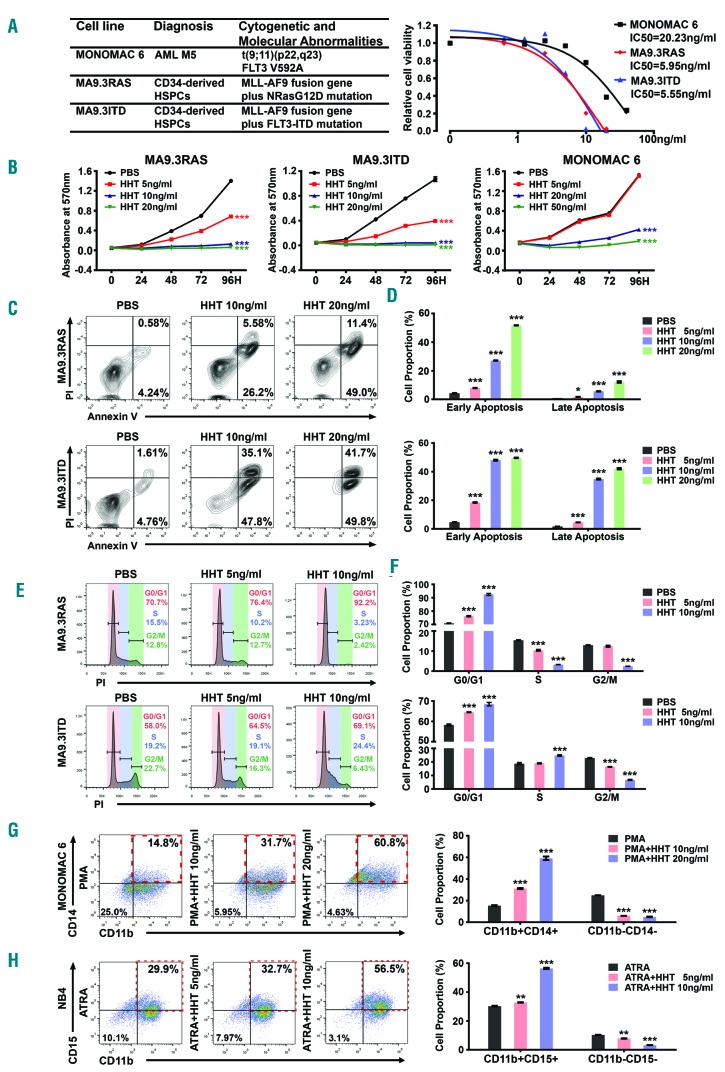
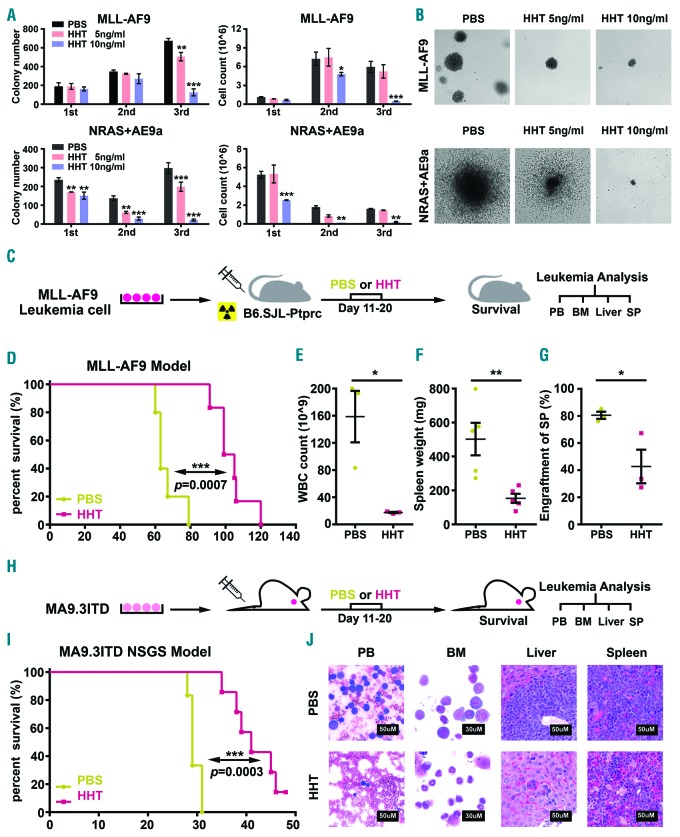
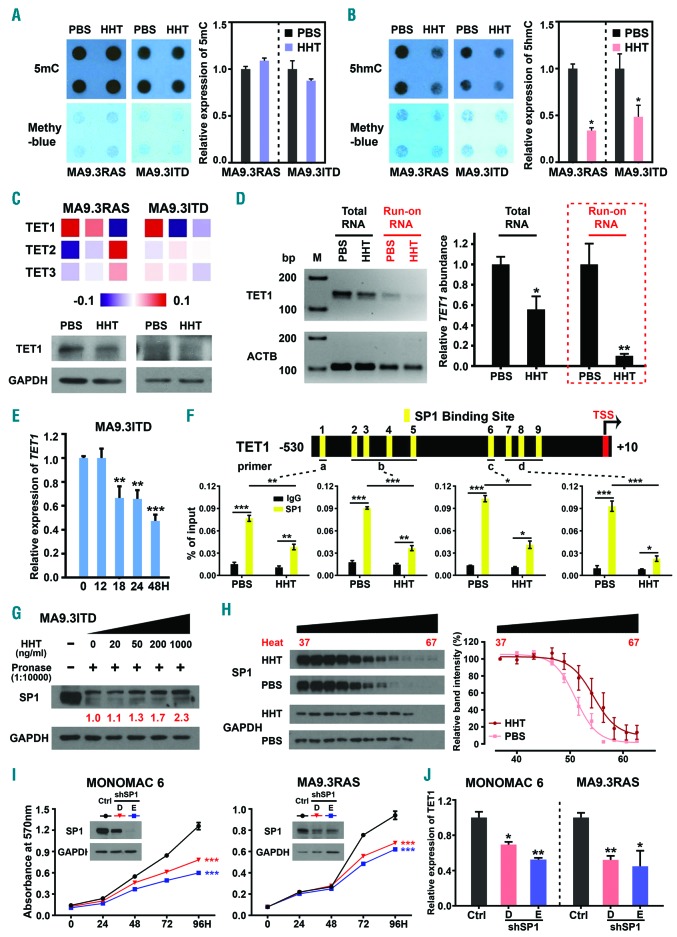
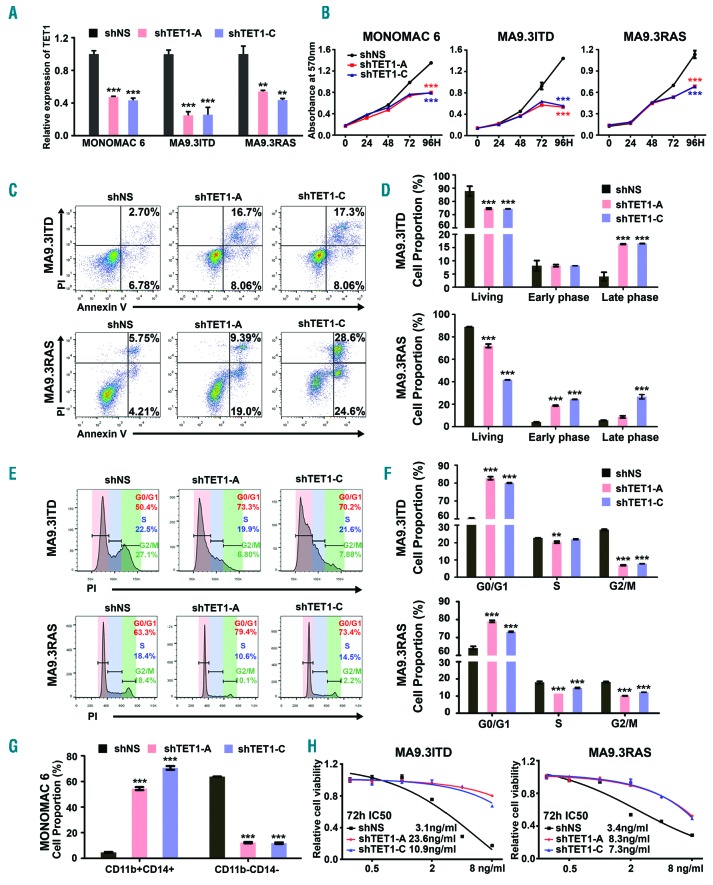
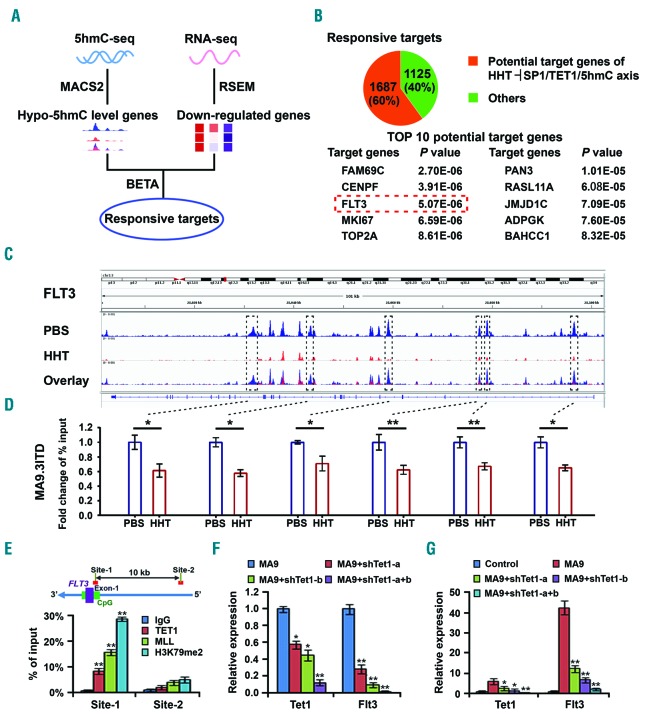
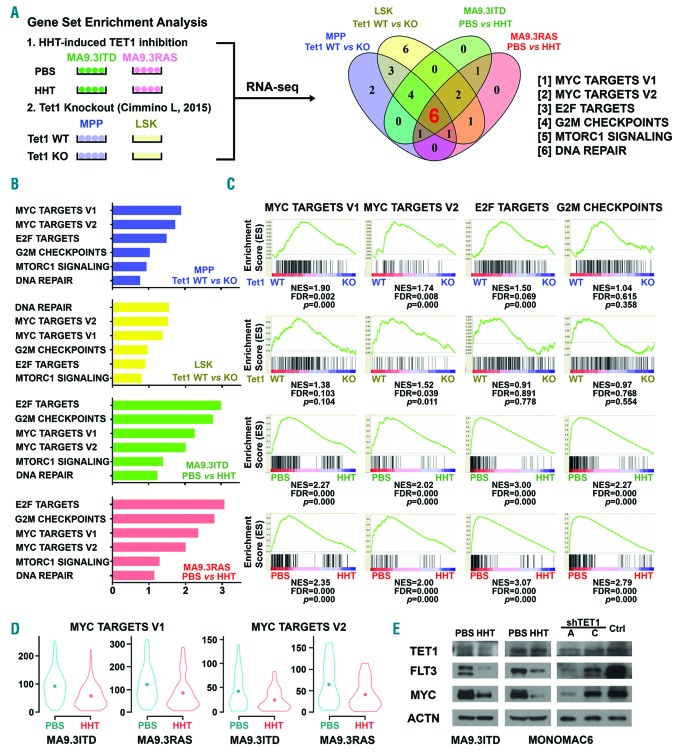
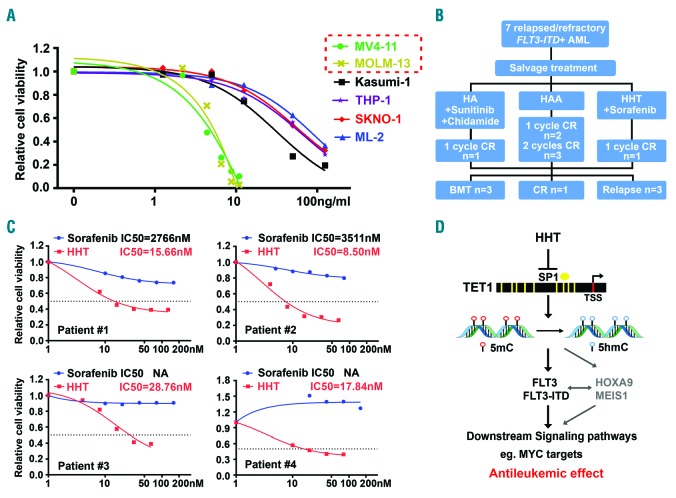
Homoharringtonine, a plant alkaloid, has been reported to suppress protein synthesis and has been approved by the US Food and Drug Administration for the treatment of chronic myeloid leukemia. Here we show that in acute myeloid leukemia (AML), homoharringtonine potently inhibits cell growth/viability and induces cell cycle arrest and apoptosis, significantly inhibits disease progression in vivo, and substantially prolongs survival of mice bearing murine or human AML. Strikingly, homoharringtonine treatment dramatically decreases global DNA 5-hydroxymethylcytosine abundance through targeting the SP1/TET1 axis, and TET1 depletion mimics homoharringtonine's therapeutic effects in AML. Our further 5hmC-seq and RNA-seq analyses, followed by a series of validation and functional studies, suggest that FLT3 is a critical down-stream target of homoharringtonine/SP1/TET1/5hmC signaling, and suppression of FLT3 and its downstream targets (e.g. MYC) contributes to the high sensitivity of FLT3-mutated AML cells to homoharringtonine. Collectively, our studies uncover a previously unappreciated DNA epigenome-related mechanism underlying the potent antileukemic effect of homoharringtonine, which involves suppression of the SP1/TET1/5hmC/FLT3/MYC signaling pathways in AML. Our work also highlights the particular promise of clinical application of homoharringtonine to treat human AML with FLT3 mutations, which accounts for more than 30% of total cases of AML.


Figures

Figure 1.
Figure 1.
Acute myeloid leukemia (AML) cells display high sensitivity to homoharringtonine (HHT) treatment in vitro. (A) (Left) Genetic information of MA9.3RAS, MA9.3ITD and MONOMAC 6 and (right) the inhibitory concentration of 50% (IC50) values with HHT treatment at 48 hours (h) for these three AML cell lines. (B) Effects of HHT treatment on cell growth/proliferation in MA9.3RAS, MA9.3ITD and MONOMAC 6 at different time points (0, 24, 48, 72 and 96 h). The colors represent different HHT concentrations (0, 5, 10, 20 ng/mL; or, 0, 9.2, 18.3, 36.7 nM). (C) Effect of HHT on apoptosis in AML cells. All the cells were treated with HHT for 48 h and representative flow cytometric plots and percentages of cell apoptosis are shown. (D) Statistical apoptosis analysis from three independent experiments determined by flow cytometry. (E) Function of HHT on cell cycle arrest in AML cells. All the cells were treated with HHT for 48 h and representative flow cytometric percentages of cell cycle phases are shown. (F) Statistical analysis of cell cycle assays from three independent experiments determined by flow cytometry. (G) Staining of CD11b and CD14 in MONOMAC 6 cells upon HHT treatment for 96 h during PMA-induced monocytic differentiation (left panel), along with statistical analysis of cell proportions of CD11b+CD14+ and CD11bCD14 in MONOMAC 6 (right panel). (H) Staining of CD11b and CD15 in NB4 cells [carrying t(15;17)/PML-RARA; AML-M3] upon treatment with HHT for 96 h during ATRA-induced granulocytic differentiation (left panel), along with statistical analysis of cell proportions of CD11b+CD15+ and CD11bCD15 in NB4 (right panel). Red boxes in (G) and (H) represent the differentiated cell population with double positive markers. *P<0.05; **P<0.01; ***P<0.001; t-test. Error bar, mean±Standard Deviation.
Figure 2.
Figure 2.
Homoharringtonine (HHT) inhibits the progression of acute myeloid leukemia (AML) in vivo. (A) Effects of HHT on colony forming activity of mouse hematopoietic stem/progenitor cells (HSPC) transformed by MLL-AF9 or NRAS plus AML-ETO9a (AE9a). Colony numbers (left panel) and cell counts (right panel) from colony forming assay (CFA) were displayed. (B) Representative images of the 3rd generation of colonies under treatment with different HHT concentrations (0, 5 and 10 ng/mL) (5× microscope). (C) Schematic illustration of secondary MLL-AF9 AML transplantation mouse model coupled with HHT or phosphate-buffered saline (PBS) treatment. (D) Kaplan-Meier curves of PBS- and HHT-treated mice that were transplanted with mouse MLL-AF9 AML cells. (E-G) White blood cell (WBC) count (E), spleen (SP) weight (F), and the engraftment ratio of leukemic cells into SP (G) at the end point of the PBS- or HHT-treated MLL-AF9 AML mice. (H) Schematic illustration of the MA9.3ITD AML xenograft NOD/LtSz-scid IL2RG-SGM3 (NSGS) model coupled with HHT or PBS treatment. (I) Kaplan-Meier curves of PBS- and HHT-treated NSGS mice that were xenotransplanted with human MA9.3ITD AML cells. (J) Wright-Giemsa staining of mouse peripheral blood (PB) and bone marrow (BM), and Hematoxylin and Eosin (H&E) staining of liver and spleen (SP) from PBS- or HHT-treated MA9.3ITD leukemic mice. Bars represent 50 mM for PB, SP and liver; 30 mM for BM. *P<0.05; **P<0.01; ***P<0.001; t-test. Error bar, mean±Standard Deviation. For Kaplan-Meier curve, P-values were calculated by log-rank test.
Figure 3.
Figure 3.
Homoharringtonine (HHT) substantially reduces global 5hmC abundance via targeting SP1/TET1 in acute myeloid leukemia (AML). (A and B) Effects of HHT on global 5mC (A) and 5hmC (B) abundance in MA9.3RAS and MA9.3ITD AML cells upon treatment with 5 ng/mL HHT for 48 hours (h). (C) Relative expression of TET1 in HHT-treated MA9.3ITD at different time points, including 0, 12, 18, 24 and 48 h. (D) Heat map showing gene expression of the individual TET family members in MA9.3RAS and MA9.3ITD AML cells treated with phosphate-buffered saline (PBS) or HHT (5 or 10 ng/mL) for 48 h as detected by RNA-sequencing (RNA-seq) (top panel), along with western blotting result of TET1 in MA9.3RAS and MA9.3ITD AML cells treated with PBS or HHT (5 ng/mL) for 48 h (bottom panel). (E) RNA levels of TET1 and ACTB in Total RNA (in black) and Run-on RNA (in red) were determined by reverse transcription polymerase chain reaction (RT-PCR) (left panel, M, Marker). Qualitative PCR (qPCR) analysis of relative TET1 abundance in Total RNA and Run-on RNA isolated from PBS- or HHT-treated MA9.3ITD cells (right panel). (F) Schematic presentation of SP1 binding sites within the promoter region of TET1 (top panel). Chromatin immune-precipitation (ChIP)-qPCR assay was used to determine the binding of SP1 to the TET1 promoter in MA9.3ITD treated with PBS or 5 ng/mL HHT for 48 h. IgG was used as a negative control. (G) Identification of direct binding between HHT and SP1 via DARTS assay in MA9.3ITD cells. Western blot analysis of the DARTS samples. (H) Identification of direct binding between HHT and SP1 via CETSA assay in MA9.3ITD cells. Western blot analysis of the CETSA samples. (I) Western blotting analysis of SP1 knockdown efficacy and effects of SP1 knockdown on the growth/proliferation of MA9.3RAS and MONOMAC 6 AML cells. (J) Relative expression of TET1 in MA9.3RAS and MONOMAC 6 AML cells with or without SP1 knockdown. *P<0.05; **P<0.01; ***P<0.001; t-test. Error bar, mean±Standard Deviation.
Figure 4.
Figure 4.
Knockdown of TET1 expression recapitulates effects of homoharringtonine (HHT) treatment in acute myeloid leukemia (AML) cells. (A) Qualitative polymerase chain reaction (qPCR) analysis of TET1 knockdown efficacy in MONOMAC 6, MA9.3ITD and MA9.3RAS cells. (B) Effects of TET1 knockdown on cell growth/proliferation of these three AML cell lines at different time points [0, 24, 48, 72 and 96 hours (h)]. (C) Effects of TET1 knockdown on apoptosis in MA9.3ITD and MA9.3RAS AML cells. (D) Statistical analysis of apoptosis assay in AML cells from three independent experiments determined by flow cytometry. (E) Effects of TET1 knockdown on cell cycle arrest in AML cells. (F) Statistical analysis of cell cycle assays from three independent experiments determined by flow cytometry. (G) Statistical analysis of cell proportions of CD11b+CD14+ and CD11bCD14 in TET1 knockdown or control MONOMAC 6 cells. (H) HHT IC50 in MA9.3ITD and MA9.3RAS cells with or without TET1 knockdown. These cells were exposed to HHT for 72 h. *P<0.05; **P<0.01; ***P<0.001; t-test. Error bar, mean±Standard Deviation.
Figure 5.
Figure 5.
FLT3 is a critical target of the homoharringtonine (HHT) SP1/TET1/5hmC axis. (A) Scheme of identification of response targets of the HHTSP1/TET1/5hmC axis by 5hmC-sequencing (5hmC-seq) and RNA-seq of MA9.3 RAS and MA9.3ITD acute myeloid leukemia (AML) cells treated with phosphate-buffered saline (PBS) or HHT (10 ng/mL for 5hmC-seq samples) for 48 hours (h). Responsive targets refer to genes with downregulation in both 5hmC abundance and RNA level upon HHT treatment. (B) Potential HHTSP1/TET1/5hmC targets found by overlap analysis of the responsive targets and putative TET1 targets (top panel). Top ten target genes were shown (bottom panel). (C) The view of 5hmC abundance across FLT3 genomic locus in MA9.3ITD cells with PBS or HHT (10 ng/mL) treatment. (D) The verification of decreased 5hmC abundance on FLT3 via Chromatin immune-precipitation (ChIP)-qPCR analysis with different primers covering corresponding 5hmC peaks shown in boxes in (C). (E) ChIP-qPCR analysis of the binding of TET1, as well as MLL-fusion proteins, to the loci of FLT3 in MONOMAC 6 cells. Green bar represents the CpG island and purple bar represents exons of FLT3. Both MLL and H3K79me2 were used as positive controls. (F and G) The effects of knockdown of Tet1 on expression of Flt3 in MLL-AF9 transformed colony cells (F) and in leukemic bone marrow (BM) blast cells of bone marrow transplantation (BMT) recipient mice that developed MLL-AF9-induced AML (G). *P<0.05; **P<0.01; ***P<0.001; t-test. Error bar, mean±Standard Deviation.
Figure 6.
Figure 6.
Pathways affected by the homoharringtonine (HHT)-SP1/TET1/5hmC axis. (A) Integrative analysis of our HHT-treatment RNA-sequencing (RNA-seq) data with published Tet1 knockout RNA-seq data to identify pathways or gene sets that were commonly affected by both HHT treatment and Tet1 knockout. RNA-seq data from MA9.3RAS and MA9.3ITD AML cells treated with phosphate-buffered saline (PBS) or HHT (10 ng/mL) for 48 hours (h), along with RNA-seq data from mouse BM Lin/c-Kit+/Sca1+ (LSK) and multipotent progenitor (MPP) cells with or without Tet1 knockout, were used in the analysis. Six gene sets were identified to be affected by both HHT treatment and Tet1 knockout in all four conditions. (B) Normalized enrichment score (NES) of the six gene sets. (C) Among the six signaling pathways, MYC targets V1, MYC targets V2, E2F targets, and G2M checkpoints gene sets were significantly suppressed upon both HHT treatment and Tet1 knockout. (D) Decreased relative expression levels of genes of the MYC targets V1/V2 gene sets in MA9.3ITD and MA9.3RAS upon HHT treatment. The dot inside represents the median expression levels of the gene sets. (E) Western blot analysis of TET1, FLT3, and MYC in PBS- or HHT-treated MA9.3ITD and MONOMAC-6 cells and in MONOMAC-6 cells with or without TET1 knockdown. ACTIN was used as an endogenous control.
Figure 7.
Figure 7.
Acute myeloid leukemia (AML) with FLT3 mutations are highly sensitive to homoharringtonine (HHT) treatment. (A) The sensitivity of AML cells with and without FLT3 mutations to HHT treatment. The AML cells were treated with a series of concentrations of HHT for 48 hours. (B) The HHT-based treatment regimen used for seven relapsed/refractory FLT3-ITD AML patients in clinic. HA: HHT plus cytarabine; HAA: HHT plus cytarabine and aclarubicin. (C) The IC50 values of HHT and sorafenib in primary FLT3-ITD AML patients’ samples.(C) The HHT-based treatment regimen used for seven relapsed/refractory FLT3-ITD AML patients in clinic. HA: HHT plus cytarabine; HAA: HHT plus cytarabine and aclarubicin. (D) Schematic illustration of the molecular mechanism underlying the anti-tumor effects of HHT mainly through suppression of the SP1/TET1/5hmC/FLT3-HOXA9-MEIS1/MYC axis.

Comment in

References

    1. Powell RG, Weisleder D, Smith CR., Jr Antitumor alkaloids for Cephalataxus harringtonia: structure and activity. J Pharm Sci. 1972;61(8):1227–1230. - PubMed
    1. Nazha A, Kantarjian H, Cortes J, Quintas-Cardama A. Omacetaxine mepesuccinate (synribo) - newly launched in chronic myeloid leukemia. Expert Opin Pharmacother. 2013;14(14):1977–1986. - PubMed
    1. Cephalotaxine esters in the treatment of acute leukemia. A preliminary clinical assessment. Chin Med J (Engl). 1976; 2(4):263–272. - PubMed
    1. Jin J, Jiang DZ, Mai WY, et al. Homoharringtonine in combination with cytarabine and aclarubicin resulted in high complete remission rate after the first induction therapy in patients with de novo acute myeloid leukemia. Leukemia. 2006; 20(8):1361–1367. - PubMed
    1. Jin J, Wang JX, Chen FF, et al. Homoharringtonine-based induction regimens for patients with de-novo acute myeloid leukaemia: a multicentre, open-label, randomised, controlled phase 3 trial. Lancet Oncol. 2013;14(7):599–608. - PubMed

Publication types