. 2019 Nov;104(11):2215-2224.
doi: 10.3324/haematol.2018.205351. Epub 2019 Apr 11.

Cell-intrinsic depletion of Aml1-ETO-expressing pre-leukemic hematopoietic stem cells by K-Ras activating mutation

Affiliations

Cell-intrinsic depletion of Aml1-ETO-expressing pre-leukemic hematopoietic stem cells by K-Ras activating mutation

Cristina Di Genua et al. Haematologica. 2019 Nov.

Abstract

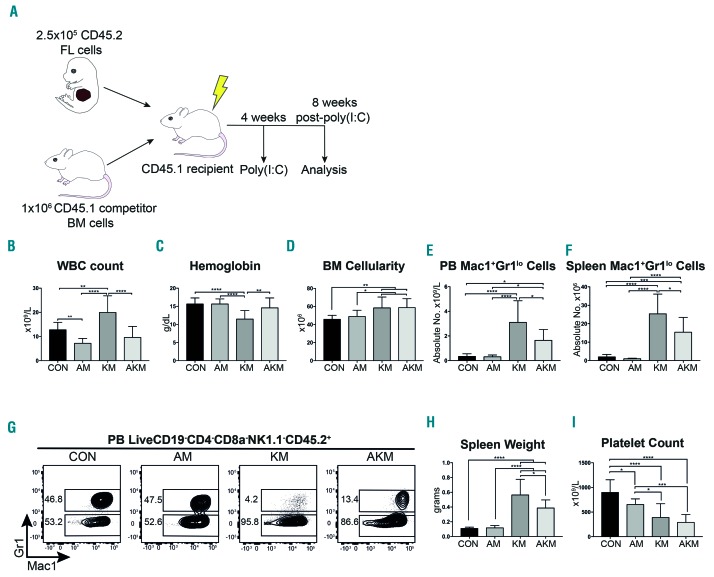
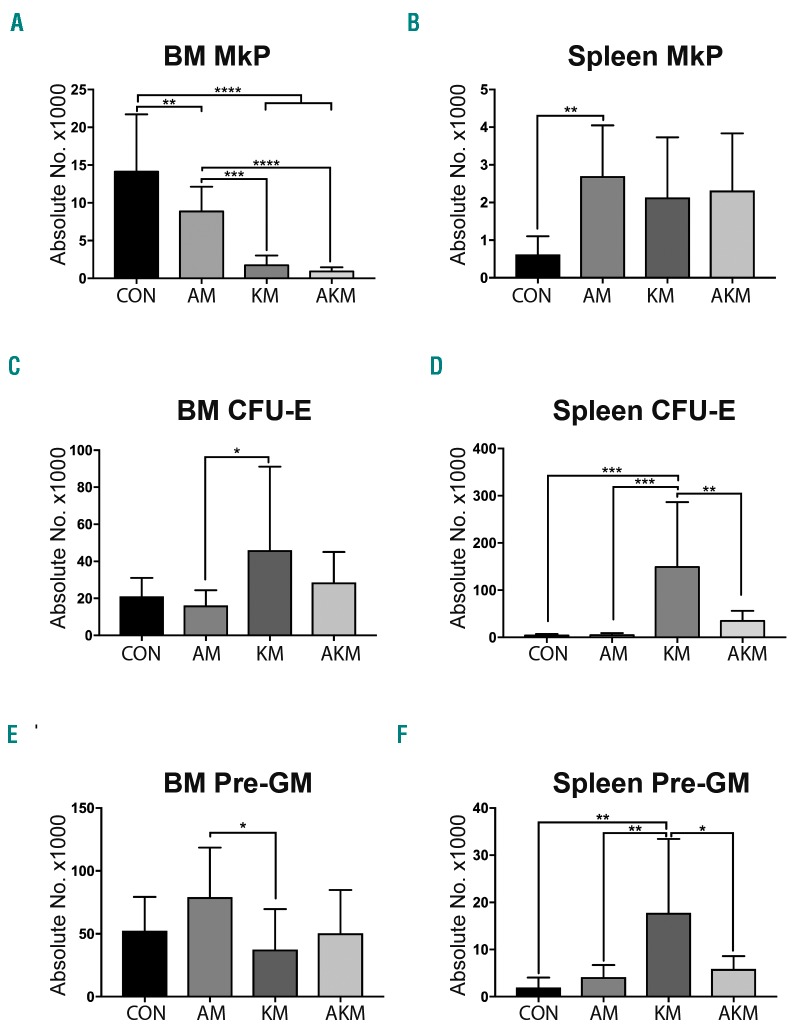
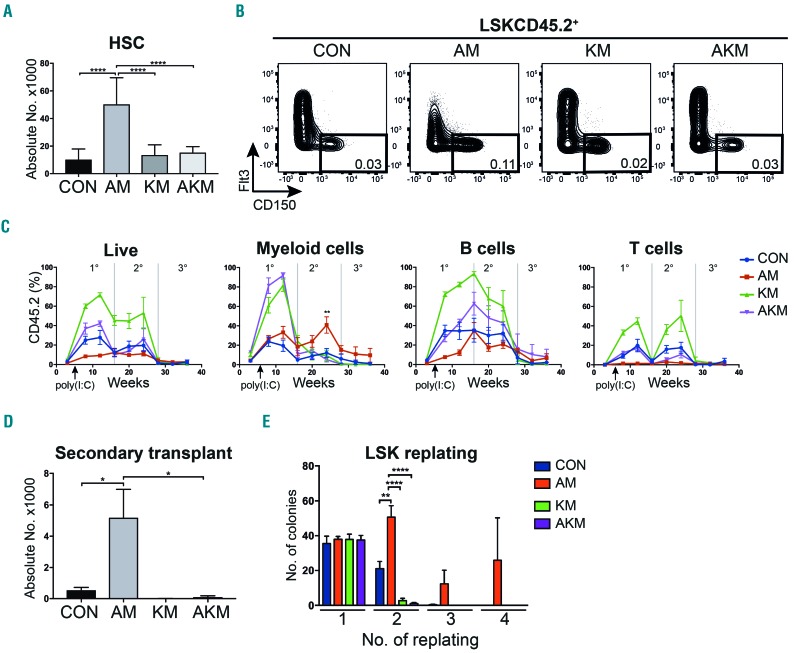
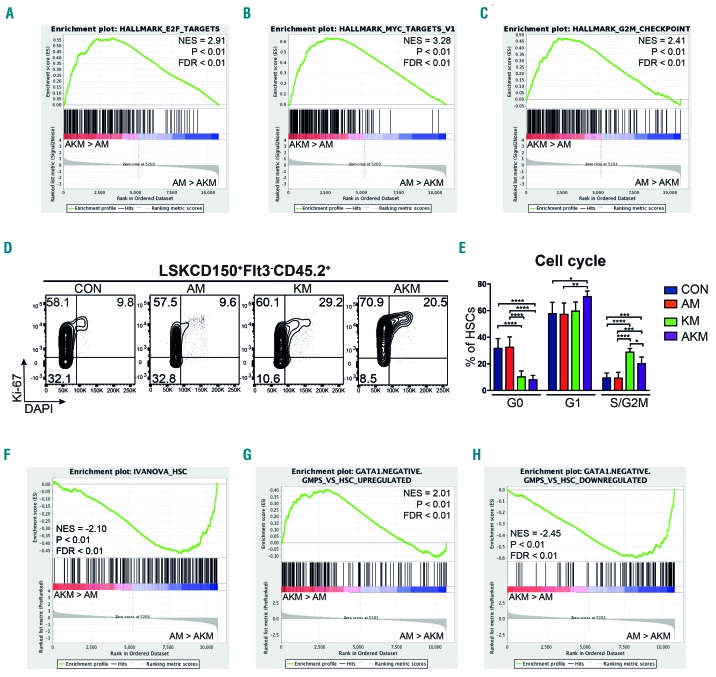
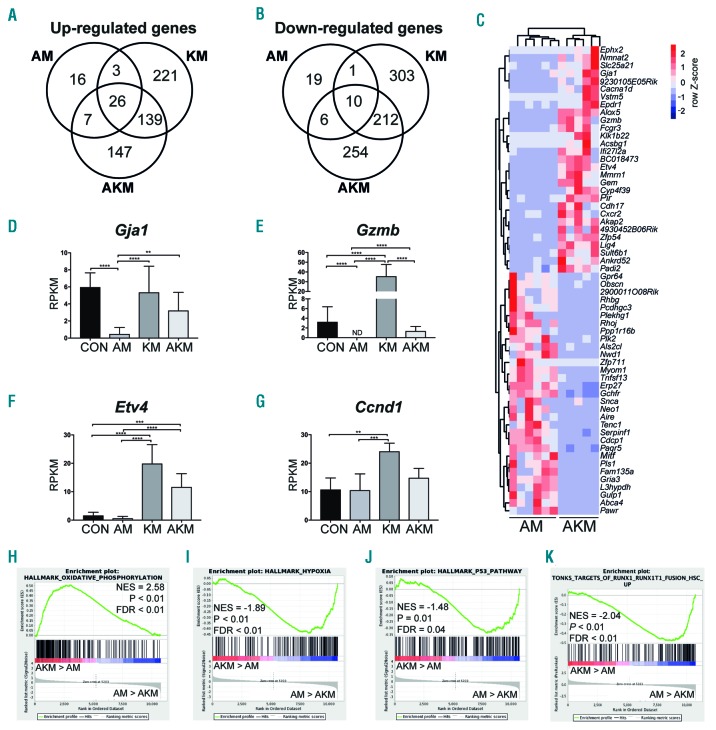
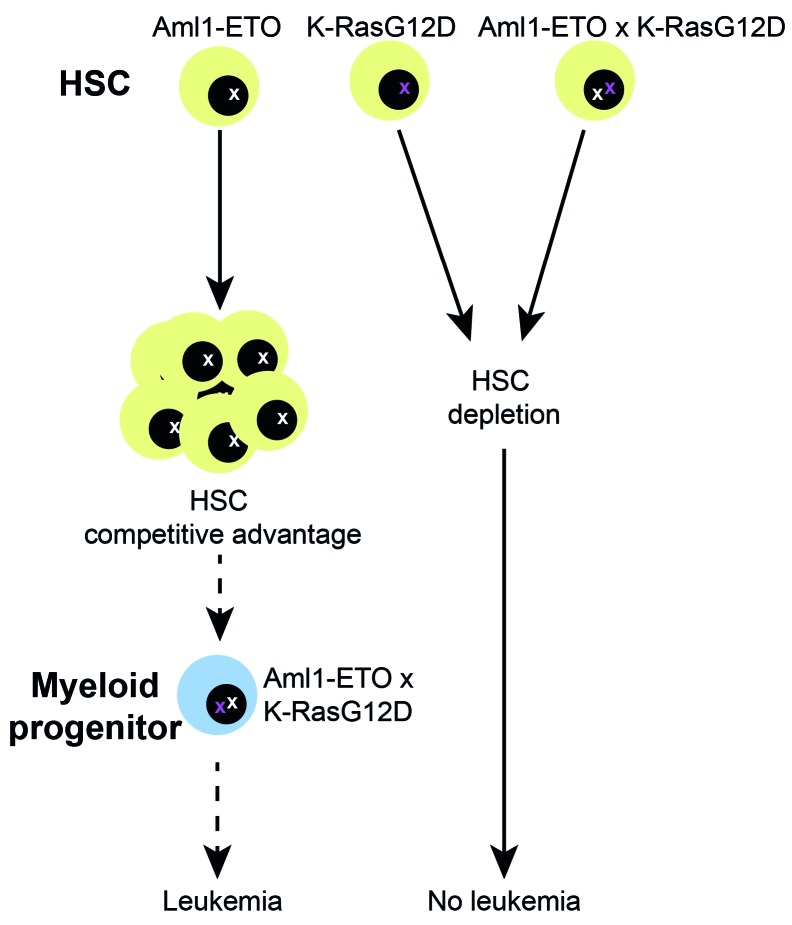
Somatic mutations in acute myeloid leukemia are acquired sequentially and hierarchically. First, pre-leukemic mutations, such as t(8;21) that encodes AML1-ETO, are acquired within the hematopoietic stem cell (HSC) compartment, while signaling pathway mutations, including KRAS activating mutations, are late events acquired during transformation of leukemic progenitor cells and are rarely detectable in HSC. This raises the possibility that signaling pathway mutations are detrimental to clonal expansion of pre-leukemic HSC. To address this hypothesis, we used conditional genetics to introduce Aml1-ETO and K-RasG12D into murine HSC, either individually or in combination. In the absence of activated Ras, Aml1-ETO-expressing HSC conferred a competitive advantage. However, activated K-Ras had a marked detrimental effect on Aml1-ETO-expressing HSC, leading to loss of both phenotypic and functional HSC. Cell cycle analysis revealed a loss of quiescence in HSC co-expressing Aml1-ETO and K-RasG12D, accompanied by an enrichment in E2F and Myc target gene expression and depletion of HSC self-renewal-associated gene expression. These findings provide a mechanistic basis for the observed absence of KRAS signaling mutations in the pre-malignant HSC compartment.


Figures

Figure 1.
Figure 1.
Aml1-ETO ameliorates the key features of the myeloproliferative neoplasm phenotype caused by K-RasG12D. (A) Schematic representation of in vivo competitive transplant experiment. (B-I) Analysis of recipients of Mx1-Cretg/+ controls; CON (n=13), Aml1ETO/+;Mx1-Cretg/+; AM (n=14), KrasG12D/+;Mx1-Cretg/+; KM (n=12) and Aml1ETO/+;KrasG12D/+;Mx1-Cretg/+; AKM fetal liver (FL) (n=14) for (B) peripheral blood (PB) white blood cell (WBC) count. (C) PB hemoglobin levels. (D) Bone marrow (BM) cellularity per tibia and femur. (E and F) CD45.2 Mac1+Gr1lo myeloid cells as absolute number in the PB (E) and spleen (F). (G) Representative FACS plots of Mac1+Gr1+ and Mac1+Gr1lo myeloid cells as a percentage of LiveCD19CD4CD8aNK1.1CD45.2+ cells across all experiments in the PB. (H) Spleen weight. (I) Platelet count. Results were generated in three independent experiments. The results were analyzed using multiple comparison ANOVA and are presented as mean±Standard Deviation. *P<0.05; **P<0.01; ***P<0.001; ****P<0.0001.
Figure 2.
Figure 2.
Aml1-ETO reverses some of the myeloerythroid progenitor cell phenotypes caused by K-RasG12D. (A, C, E) Absolute number of CD45.2 megakaryocyte progenitor (MkP) (A), CFU-E (C) and Pre-GM (E) in the bone marrow (BM) from recipients of CON (n=12), AM (n=14), KM (n=12) and AKM FL (n=14). Results were generated in three independent experiments. (B, D, F) Absolute numbers of CD45.2 MkP (B), colony forming unit-erythrocyte (CFU-E) (D) and pre-granulocyte-monocyte (Pre-GM). (F) in the spleen from recipients of CON (n=8), AM (n=10), KM (n=8) and AKM FL (n=10). Results were generated in two independent experiments. The results were analyzed using multiple comparison ANOVA and are presented as the mean±Standard Deviation. *P<0.05; **P<0.01; ***P<0.001; ****P<0.0001.
Figure 3.
Figure 3.
Hematopoietic stem cell (HSC) expansion caused by Aml1-ETO is reversed by K-RasG12D. (A) Absolute number of CD45.2 HSC in the bone marrow (BM) from recipients of CON (n=11), AM (n=14), KM (n=13) and AKM fetal liver (FL) cells (n=14). Results were generated in three independent experiments; (B) Representative FACS plots showing gating used to quantify HSC as a percentage of the BM mononuclear cells across all experiments. (C) Percentage reconstitution of total CD45.2 cells, CD45.2 myeloid (LiveCD19CD4CD8aNK1.1), CD45.2 B cells (LiveNK1.1-Mac1-CD19+) and CD45.2 T cell (LiveNK1.1Mac1CD4+CD8a+) compartments in primary, secondary and tertiary transplantations. (D) Absolute number of CD45.2 HSC in secondary recipients of CON (n=9 recipient mice in 2 independent experiments), AM (n=10 recipient mice in 3 independent experiments), KM (n=4 recipient mice in 2 independent experiments), and AKM FL cells (n=7 recipient mice in 2 independent experiments). (E) Replating efficiency of CD45.2 LSK BM cells. Average number of colonies is shown for 5-6 biological replicates per genotype in two independent experiments. The results were analyzed using multiple comparison ANOVA. The results are presented as the mean±Standard Error of Mean. *P<0.05; **P<0.01; ***P<0.001; ****P<0.0001.
Figure 4.
Figure 4.
Hematopoietic stem cells (HSC) co-expressing Aml1-ETO and K-RasG12D are characterized by loss of quiescence and HSC-associated gene expression. (A-C) Bulk CD45.2 LSKCD150+Flt3 cells were subjected to RNA sequencing (5-6 biological replicates per genotype in two independent experiments). Gene set enrichment analysis (GSEA) of AKM versus AM HSC for E2F targets (A), Myc targets (B), and genes associated with G2M checkpoint (C). (D) Representative FACS plots showing cell cycle analysis of CD45.2 LSKCD150+Flt3 phenotypic HSC from the bone marrow (BM) of recipients of CON (n=6 recipient mice in 2 independent experiments), AM (n=9 recipient mice in 3 independent experiments), KM (n=4 recipient mice in 2 independent experiments), and AKM FL (n=6 recipient mice in 3 independent experiments). (E) Percentage of BM CD45.2 LSKCD150+Flt3 cells at each cell cycle stage. The results were analyzed using multiple comparison ANOVA. The results are presented as mean±Standard Deviation. *P<0.05; **P<0.01; ***P<0.001. (F-H) GSEA analysis of AKM versus AM HSC for HSC gene signature (F), genes up-regulated in granulocyte-monocyte progenitor (GMP) that lack Gata1 expression compared to HSC (G), and genes down-regulated in GMP that lack Gata1 expression compared to HSC (H). NES: normalized enrichment score; FDR: false discovery rate.
Figure 5.
Figure 5.
RNA sequencing reveals distinct molecular signatures of hematopoietic stem cells (HSC) co-expressing Aml1-ETO and K-RasG12D. (A and B) Venn-diagram of significantly up-regulated (A) and down-regulated genes (B) in HSC identified by RNA sequencing. (C) Heatmap depicting the read per kilobase of transcript per million (RPKM) values of the top 30 significantly up-regulated and down-regulated genes in AKM HSC versus AM [false discovery rate (FDR) < 0.05]. (D-G) RPKM of selected genes identified from RNA sequencing, Gja1 (D), Gzmb (E), Etv4 (F), and Ccnd1 (G). RPKM and FDR were generated using edgeR package. The results are presented as mean±Standard Deviation. *P<0.05; **P<0.01; ***P<0.001; ****P<0.0001. (H-K) Gene set enrichment analysis (GSEA) of AKM versus AM HSC for oxidative phosphorylation (H), hypoxia (I), p53 pathway (J), and genes up-regulated in human HSC transduced with AML1-ETO (K). NES: normalized enrichment score.
Figure 6.
Figure 6.
Schematic summarizing the effect of K-RasG12D on pre-leukemic hematopoietic stem cells (HSC). HSC that acquire Aml1-ETO gain a competitive advantage, leading to an expansion in HSC number. Acquisition of K-RasG12D and Aml1-ETO concurrently leads to HSC depletion. It remains to be determined whether sequential acquisition of Aml1-ETO followed-by K-RasG12D might support development of leukemia. As this was not tested in the current study, this is depicted as a dotted arrow.

Comment in

References

    1. Sykes SM, Kokkaliaris KD, Milsom MD, Levine RL, Majeti R. Clonal Evolution of Preleukemic hematopoietic stem cells in acute myeloid leukemia. Exp Hematol. 2015; 43(12):989–992. - PMC - PubMed
    1. Estey E, Dohner H. Acute myeloid leukaemia. Lancet. 2006;368(9550):1894–1907. - PubMed
    1. Cancer Genome Atlas Research N. Genomic and epigenomic landscapes of adult de novo acute myeloid leukemia. N Engl J Med. 2013; 368(22):2059–2074. - PMC - PubMed
    1. Reckzeh K, Bereshchenko O, Mead A, et al. Molecular and cellular effects of oncogene cooperation in a genetically accurate AML mouse model. Leukemia. 2012;26(7):1527–1536. - PubMed
    1. Shih AH, Jiang Y, Meydan C, et al. Mutational cooperativity linked to combinatorial epigenetic gain of function in acute myeloid leukemia. Cancer Cell. 2015; 27(4):502–515. - PMC - PubMed

Publication types

MeSH terms

Substances