. 2019 May 15;132(10):jcs229526.
doi: 10.1242/jcs.229526.

The route of the visual receptor rhodopsin along the cilium

Affiliations

The route of the visual receptor rhodopsin along the cilium

Abhishek Chadha et al. J Cell Sci. .

Abstract

The photoreceptor outer segment is the most elaborate primary cilium, containing large amounts of rhodopsin (RHO) in disk membranes that grow from a connecting cilium. The movement of RHO along the connecting cilium precedes formation of the disk membranes. However, the route that RHO takes has not been clearly determined; some reports suggest that it follows an intracellular, vesicular route along the axoneme, possibly as an adaptation for the high load of delivery or the morphogenesis of the disk endomembranes. We addressed this question by studying RHO in cilia of IMCD3 cells and mouse rod photoreceptors. In IMCD3 cilia, fluorescence recovery after photobleaching (FRAP) experiments with fluorescently tagged RHO supported the idea of RHO motility in the ciliary plasma membrane and was inconsistent with the hypothesis of RHO motility within the lumen of the cilium. In rod photoreceptors, FRAP of RHO-EGFP was altered by externally applied lectin, supporting the idea of plasmalemmal RHO dynamics. Quantitative immunoelectron microscopy corroborated our live-cell conclusions, as RHO was found to be distributed along the plasma membrane of the connecting cilium, with negligible labeling within the axoneme. Taken together, the present findings demonstrate RHO trafficking entirely via the ciliary plasma membrane.This article has an associated First Person interview with the first author of the paper.

Keywords: Cilium; Photoreceptor; Rhodopsin; Trafficking.


Conflict of interest statement

Competing interestsThe authors declare no competing or financial interests.

Figures
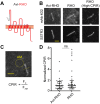
Fig. 1.
Fig. 1.
Presence of Avi-RHO and RHO in cilia of IMCD3 cells. (A) Diagram of Avi-RHO. (B) Cilia of IMCD3 cells containing Avi-RHO or native RHO. RHO was detected by labeling with RHO mAb4D2. Cilia were identified by colocalization with SSTR3–mKate2, a robust ciliary marker. In separate experiments (not shown), we found comparable results when using acetylated tubulin labeling to identify cilia, indicating that SSTR3–mKate2 does not adversely affect RHO localization. Scale bar: 3 µm. (C) Method for defining the cilium-to-plasma membrane fluorescence intensity ratio (CPIR), adopted from Madugula and Lu (2016), on a sample image of untagged bovine RHO, immunolabeled with RHO mAb4D2. The CPIR is a ratio of fluorescence specific to the cilium (Fc) relative to fluorescence from the adjacent membrane (FAM). Fc was defined as the fluorescence measured from the cilium, less the background fluorescence of the adjacent plasma membrane (AM), which, because of its proximity (the cilia imaged were essentially lying on the apical plasma membrane), is included in the measured fluorescence of the cilium. The ends of the depicted line profile could also be used to define AM; however, a circular ROI was selected to obtain a larger sampling for a more accurate measurement of AM fluorescence. (D) Comparison of the CPIR for bovine Avi-RHO and unmodified bovine RHO in IMCD3 cell cilia, quantified by using the fluorescence signal from the RHO mAb4D2 plus secondary antibody labeling of fixed cultures. To facilitate comparison of CPIR values between Avi-RHO and RHO, all CPIR values presented in Fig. 1D are normalized to the median CPIR of RHO. n=33 and 35, respectively, from three separate cultures; P=0.47, Mann–Whitney test. The CPIRs for individual cilia are plotted, and the median with interquartile range is indicated for each construct.
Fig. 2.
Fig. 2.
FRAP of Avi-RHO in the ciliary plasma membrane in IMCD3 cells. (A) Distal cilium FRAP of Avi-RHO labeled with streptavidin–Alexa Fluor 647 in IMCD3 cells. Cells were transfected with Avi-RHO and biotin ligase. Biotinylated Avi tag on the cell surface was then labeled with extracellular streptavidin-Alexa Fluor 647. Pre indicates prior to the photobleach; the time after the bleach is shown in seconds for the other panels. (B) Recovery of distal cilium fluorescence after photobleaching coincides with a decrease in fluorescence from the proximal cilium after photobleaching. (C,D) FRAP recovery images (C) and proximal and distal fluorescence (D) after treatment with 75 µg/ml WGA. (E,F) FRAP recovery images (E) and proximal and distal fluorescence (F) after treatment with 120 µg/ml ConA. (G) FRAP recovery curves from IMCD3 cells, untreated or treated with 60 µg/ml ConA. Data were fitted using a monoexponential association function. (H) FRAP half recovery times of streptavidin–Alexa Fluor 647-labeled Avi-RHO in untreated and ConA (60 µg/ml)-treated IMCD3 cells. n=11 for each, pooled from two WT and three ConA-treated experiments. *P=0.04, Mann–Whitney test. Error bars indicate s.e.m. AU, arbitrary units.
Fig. 3.
Fig. 3.
FRAP of Avi-RHO-EGFP-C8 in the ciliary plasma membrane in IMCD3 cells. (A) Schematic of the Avi-RHO-EGFP-C8 construct. (B) Example of a FRAP recovery curve for total (EGFP) or cell surface (streptavidin–Alexa Fluor 647 labeled) RHO in a single cilium. Example traces for are also shown for a cell treated with 75 µg/ml WGA (darker shaded green and red). (C,D) The fractional extent of recovery (C) and half recovery time (D) were not significantly different (ns) for the surface and total RHO; n=8 and 9, respectively, from seven separate cultures; P=0.49 for (C) and 0.38 for (D), Wilcoxon matched-pairs signed rank test. Error bars indicate s.e.m. (E) FRAP recovery images after treatment with 75 µg/ml WGA for total (EGFP) and cell surface (streptavidin–Alexa Fluor 647 labeled) pools of Avi-RHO-EGFP-C8.
Fig. 4.
Fig. 4.
RHO in the connecting cilium of rod photoreceptor cells. (A) Schematic of the inner segment, connecting cilium and proximal disks of a photoreceptor cell. FRAP was performed on the region surrounding the connecting cilium. The dashed circle represents photobleached spot, and the dashed rectangle represents the region quantified for recovery. (B) Treatment of photoreceptor cells with 120 µg/ml ConA curtailed recovery in the cilium. (C,D) Connecting cilia of rod photoreceptors in retinal explants from Rho-EGFP+/−; Rpe65−/− mice, imaged by FRAP in the presence (D) or absence (C) of 60 μg/ml ConA. Representative photoreceptors before photobleach (left), upon photobleach (middle) and after recovery (right) are shown. Note that although the fluorescence signal in the outer segment shows signs of saturation, we confirmed that pre-bleach fluorescence in the region of the connecting cilium, which was monitored for recovery, did not exceed saturation. Scale bar: 1 µm. (E) Representative FRAP traces for RHO–EGFP in control (blue) and 60 µg/ml ConA-treated (red) cells. Data were fitted using monoexponential association functions (black lines).
Fig. 5.
Fig. 5.
ImmunoEM of RHO in and around the connecting cilium of mouse photoreceptor cells. (A) Examples of immunoEM images of longitudinal sections, passing through the center of the connecting cilium of mouse photoreceptors, showing gold particle labeling of RHO [e.g. blue arrows in the left panel, indicating a gold particle on the ciliary plasma membrane (left) and another on the periciliary plasma membrane (right)]. Scale bar: 200 nm. (B) Compilation of RHO immunogold particle localization from 22 longitudinal sections from three separate mice. Shaded yellow indicates the different regions that were compared. Blue dots correspond to blue arrows in the top-left panel of A. (C) Bar graph of immunogold particles located within 30 nm of each of the following: the outer and inner plasma membranes of the connecting cilium (outer membrane is outside of the pocket, inner membrane is inside the pocket and thus adjacent to the periciliary membrane); the center of the connecting cilium (CC center), shown as a dotted line in B; the periciliary plasma membrane; and the apical inner segment (IS) plasma membrane, on the opposite side from the cilium. *P=0.013, CC center versus IS membrane; *P=0.04, CC center versus periciliary membrane; ***P<0.0001, CC center versus ciliary plasma membrane. Kruskal–Wallis test with post-hoc Mann–Whitney U-test, with P-values corrected for multiple comparisons. Error bars indicate s.e.m.

References

    1. Abd-El-Barr M. M., Sykoudis K., Andrabi S., Eichers E. R., Pennesi M. E., Tan P. L., Wilson J. H., Katsanis N., Lupski J. R. and Wu S. M. (2007). Impaired photoreceptor protein transport and synaptic transmission in a mouse model of Bardet-Biedl syndrome. Vision Res. 47, 3394-3407. 10.1016/j.visres.2007.09.016 - DOI - PMC - PubMed
    1. Arikawa K. and Williams D. S. (1989). Organization of actin filaments and immunocolocalization of alpha-actinin in the connecting cilium of rat photoreceptors. J. Comp. Neurol. 288, 640-646. 10.1002/cne.902880410 - DOI - PubMed
    1. Arikawa K., Molday L. L., Molday R. S. and Williams D. S. (1992). Localization of peripherin/rds in the disk membranes of cone and rod photoreceptors: relationship to disk membrane morphogenesis and retinal degeneration. J. Cell Biol. 116, 659-667. 10.1083/jcb.116.3.659 - DOI - PMC - PubMed
    1. Badano J. L., Teslovich T. M. and Katsanis N. (2005). The centrosome in human genetic disease. Nat. Rev. Genet. 6, 194-205. 10.1038/nrg1557 - DOI - PubMed
    1. Besharse J. C. and Wetzel M. G. (1995). Immunocytochemical localization of opsin in rod photoreceptors during periods of rapid disc assembly. J. Neurocytol. 24, 371-388. 10.1007/BF01189064 - DOI - PubMed

Publication types