. 2018 Feb 13;35(1):29-62.
doi: 10.1007/s10680-018-9467-3. eCollection 2019 Feb 15.

Age of Retirement and Human Capital in an Aging China, 2015-2050

Affiliations

Age of Retirement and Human Capital in an Aging China, 2015-2050

Qiushi Feng et al. Eur J Popul. .

Abstract

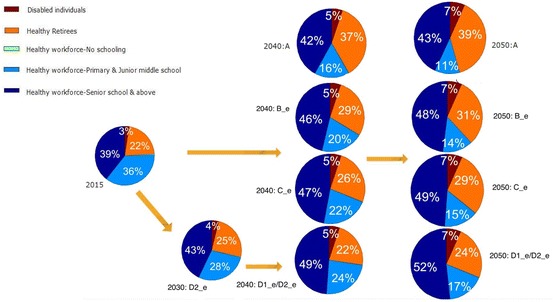
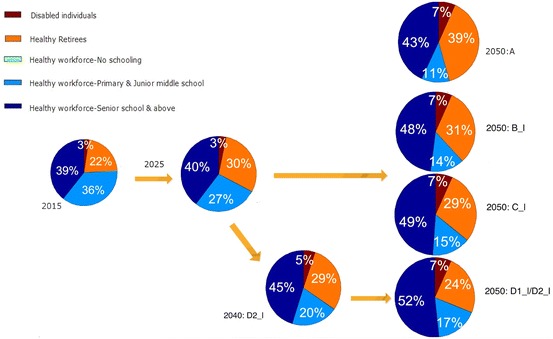
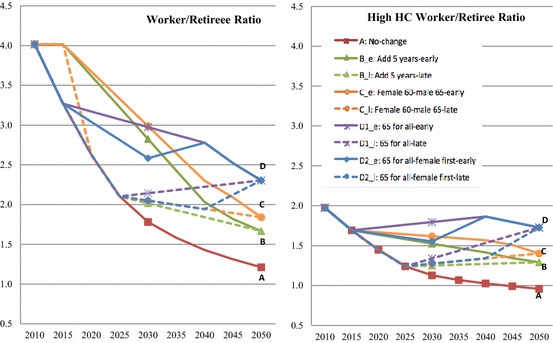
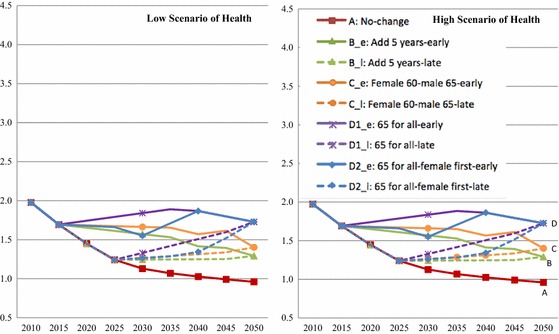
As China continues to age rapidly, whether the country should adjust the official retirement age, and if so, when and how, are currently major policy concerns. We examine the impact of postponing the retirement age on the human capital of China in the next four decades. Two critical aspects of human capital-health and education-are incorporated to account for the quality of the work force. Our projections reveal the impact of nine scenarios on the Chinese labor force in the next few decades, highlighting the changes in "the high human capital workforce"-those with good health and education. We show substantial impact with added work force ranging from 28 to 92 million per year depending on which scenarios are implemented. Furthermore, the retained workers are increasingly better educated. The gain in female workers is particularly significant, reaping the benefits of the education expansion since the 1990s.

Keywords: Aging; China; Human capital; Projection; Retirement.


Conflict of interest statement

Compliance with Ethical StandardsThe authors have no conflict of interest in this study.

Figures

Fig. 1
Fig. 1
Newly added working-age population and retirees by every 5 years in urban China if current retirement ages remain unchanged, 2015–2050
Fig. 2
Fig. 2
Rural and urban population in China, 2010–2050
Fig. 3
Fig. 3
Urban population by four age groups in China, 2010–2050
Fig. 4
Fig. 4
Relative changes of the size of workforce and retiree under nine retirement schemes with the 2010 population as baseline, 2015–2050. The nine retirement schemes are A (the current retirement ages remain unchanged), B_e (everyone will prolong retirement by 5 years from 2015 to 2040), B_l (everyone will prolong retirement by 5 years from 2025 to 2050), C_e (females will retire at 60 and male at 65 from 2015 to 2040), C_l (females will retire at 60 and male at 65 from 2025 to 2050), D1_e (everyone will retire at 65 from 2015 to 2040), D1_l (everyone will retire at 65 from 2025 to 2050), D2_e (everyone will retire at 65 from 2015 to 2040 with females adjusted first), D2_l (everyone will retire at 65 from 2025 to 2050 with females adjusted first). D1_l and D2_l are presented as one at the left panel due to the minor difference
Fig. 5
Fig. 5
Working-age population in China by education and health under early retirement schemes adjusted from 2015 to 2040. The early retirement schemes include A (the current retirement ages remain unchanged) as the reference scheme, B_e (everyone will prolong retirement by 5 years from 2015 to 2040), C_e (females will retire at 60 and male at 65 from 2015 to 2040), D1_e (everyone will retire at 65 from 2015 to 2040), D2_e (everyone will retire at 65 from 2015 to 2040 with females adjusted first). An individual is categorized as “disabled” if he or she self-reported to be “unable to carry out regular work and daily activities,” or to be “not sure about their health status.” Those who reported “not sure” were less than 2% and the majority of them are older than age 70. The “healthy” category includes those who self-reported as “healthy” or as “basically can carry out regular work and daily activities”
Fig. 6
Fig. 6
Working-age population in China by education and health under late retirement schemes adjusted from 2025 to 2050. The late retirement schemes include A (the current retirement ages remain unchanged) as the reference scheme, B_l (everyone will prolong retirement by 5 years from 2025 to 2050), C_l (females will retire at 60 and male at 65 from 2025 to 2050), D1_l (everyone will retire at 65 from 2025 to 2050), and D2_l (everyone will retire at 65 from 2025 to 2050 with females adjusted first). Note: An individual is categorized as “disabled” if he or she self-reported to be “unable to carry out regular work and daily activities,” or to be “not sure about their health status.” Those who reported “not sure” were less than 2% and the majority of them are older than age 70. The “healthy” category includes those who self-reported as “healthy” or as “basically can carry out regular work and daily activities”
Fig. 7
Fig. 7
Worker/retiree ratio under nine retirement schemes in China, 2010 to 2050. The nine retirement schemes are A (the current retirement ages remain unchanged), B_e (everyone will prolong retirement by 5 years from 2015 to 2040), B_l (everyone will prolong retirement by 5 years from 2025 to 2050), C_e (females will retire at 60 and male at 65 from 2015 to 2040), C_l (females will retire at 60 and male at 65 from 2025 to 2050), D1_e (everyone will retire at 65 from 2015 to 2040), D1_l (everyone will retire at 65 from 2025 to 2050), D2_e (everyone will retire at 65 from 2015 to 2040 with females adjusted first), D2_l (everyone will retire at 65 from 2025 to 2050 with females adjusted first). The worker/retiree ratio is calculated as the total number of the workforce divided by the total number of retirees. The high HC worker/retiree ratio (the high human capital worker/retiree ratio) is calculated as the total number of the high human capital workforce (those who are healthy, not retired, and with a high school and above education) divided by the total number of retirees
Fig. 8
Fig. 8
High HC workforce/retiree ratios of under the nine retirement schemes by low and high scenarios of health. The high HC worker/retiree ratio (the high human capital workforce/retiree ratio) is calculated as the total number of the high human capital workforce (those who are healthy, not retired, and with a high school and above education) divided by the total number of retirees. For the low scenario of health, we assume the proportion of unhealthy Chinese elderly (50 +) will decrease by 10% from 2005 to 2050. For the high scenario of health, we assume the proportion of unhealthy Chinese elderly (50 +) will gradually increase by 10% from 2005 to 2050. The nine retirement schemes are A (the current retirement ages remain unchanged), B_e (everyone will prolong retirement by 5 years from 2015 to 2040), B_l (everyone will prolong retirement by 5 years from 2025 to 2050), C_e (females will retire at 60 and male at 65 from 2015 to 2040), C_l (females will retire at 60 and male at 65 from 2025 to 2050), D1_e (everyone will retire at 65 from 2015 to 2040), D1_l (everyone will retire at 65 from 2025 to 2050), D2_e (everyone will retire at 65 from 2015 to 2040 with females adjusted first), D2_l (everyone will retire at 65 from 2025 to 2050 with females adjusted first)

References

    1. Albert M. How does education affect cognitive function? Annals of Epidemiology. 1995;5:76–78. doi: 10.1016/1047-2797(94)00044-T. - DOI - PubMed
    1. Arpaia, A., Dybczak, K., & Pierini, F. (2011). Assessing the short-term impact of pension reforms on older workers’ participation rates in the EU: A diff-in-diff approach, European Commission, Directorate-General for Economic and Financial Affairs. Economic Papers 385.
    1. Benjamin, D., Brandt, L., & Fan, J. (2003). Ceaseless toil? Health and labour supply of the elderly in rural China. Working paper, Department of Economics, University of Toronto.
    1. Bonsang E, Adamb S, Perelmanc S. Does retirement affect cognitive functioning? Journal of Health Economics. 2012;31:490–501. doi: 10.1016/j.jhealeco.2012.03.005. - DOI - PubMed
    1. Boshier R. Chinese ageism lives on: Grassroots reports on elderly learning in Shaanxi, Jiangxi, and Jiangsu. In: Boulton-Lewis G, Tam M, editors. Active ageing, active learning: Issues and challenges. Dordrecht: Springer; 2012. pp. 121–139.