

Photoacoustic imaging for the evaluation of early tumor response to antivascular treatment
- PMID: 30976540
- PMCID: PMC6414773
- DOI: 10.21037/qims.2018.11.06
Photoacoustic imaging for the evaluation of early tumor response to antivascular treatment
Abstract
Background: Photoacoustic imaging (PAI) provides real-time noninvasive and contrast agent-free monitoring of the concentrations of some endogenous compounds related to tumor vascularization and oxygenation. In this study, we used PAI to noninvasively evaluate tumor responses to antiangiogenic therapy.
Methods: In vivo studies were performed with the approval of our institutional animal ethics committee. We used a xenograft mouse model of 4T1 breast cancer treated with different doses of bevacizumab or vehicle. Seven days after implantation, tumor-bearing mice (with tumors ~5-8 mm diameter) were randomly divided into low-dose (10 mg/kg), high-dose (20 mg/kg) and vehicle groups (same dose of saline). Each experimental group was administered bevacizumab intraperitoneally only once. Before and after treatment, acoustic resolution-photoacoustic microscopy (AR-PAM), a type of PAI, was conducted in vivo consecutively from day 1 to day 5. PAI-derived quantitative parameters were calculated at each time point. Additional cohorts of mice were used to quantify CD31 and hypoxia by immunohistochemical assays.
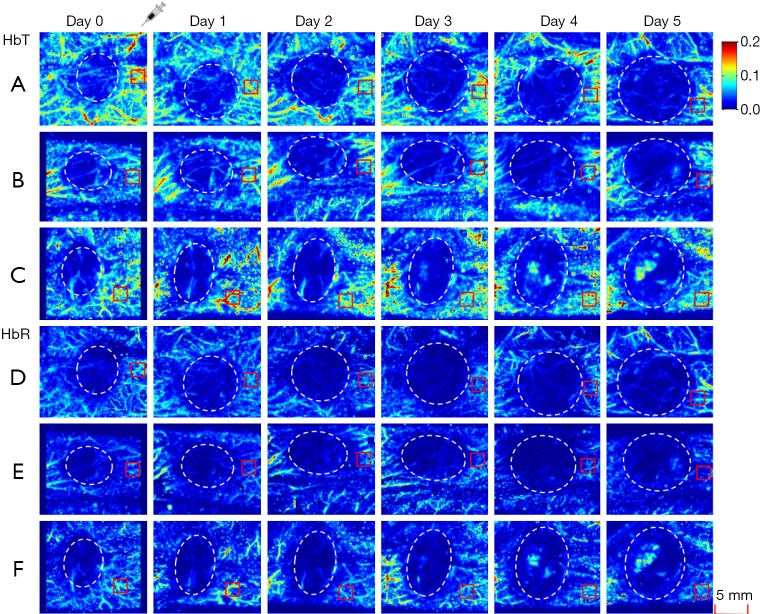
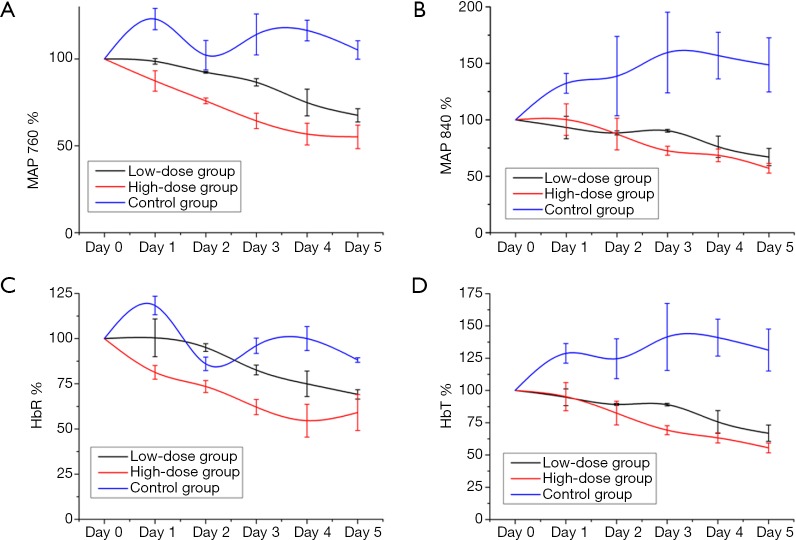
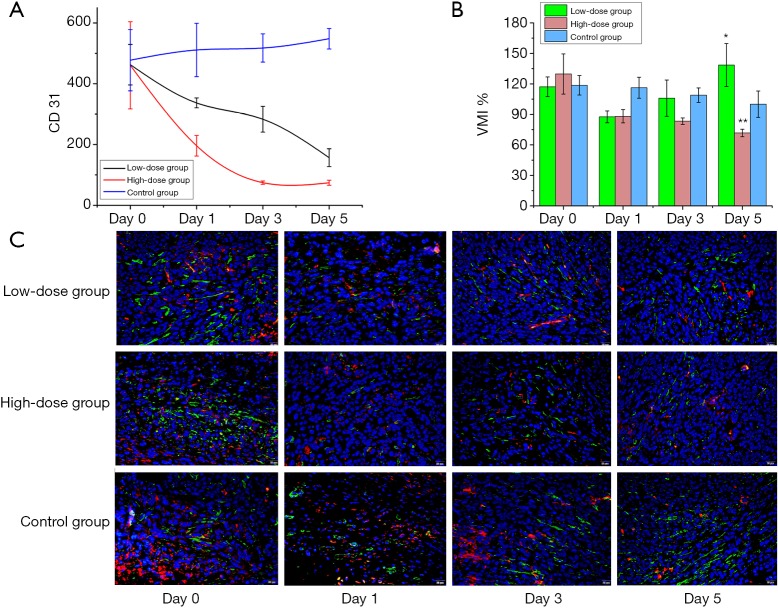
Results: The values of the PAI parameters were not significantly different among the experimental and control groups at the same time point before treatment (all P>0.05). The total hemoglobin (HbT) levels in the treatment group gradually decreased from day 1 to day 2 (relative to those in the control group, P>0.05) and decreased significantly relative to those in the control group from day 3 to day 5 (P<0.05). The deoxyhemoglobin (HbR) levels in the treatment group decreased from day 1 to 5 after treatment. The high-dose group had significantly decreased HbR levels relative to the control group from day 1 to 5 (P<0.05). The low-dose group also showed a gradual and significant decrease in HbR levels on day 3 (P<0.05). CD31 was decreased in the low-dose group relative to the control group on day 1 (decreased by 34.05%, P=0.067) and day 3 (decreased by 45.27%, P=0.180), and the decrease in CD31 persisted on day 5 (decreased by 71.41%, P=0.000). CD31 decreased to a greater extent in the high-dose group than in the low-dose group. Tumor hypoxia was significantly increased on day 1 from day 0 in the treatment groups (P<0.05), especially in the high-dose group. Hypoxia was decreased on days 3 and 5 in the low-dose group (10.92±0.92 and 8.17±1.9, P=0.317) but continuously increased over time in the high-dose group. Significantly greater hypoxia was observed in the high-dose group than in the low-dose group (17.60±1.20 and 20.33±0.47, P<0.05).
Conclusions: PAI can be used to evaluate both vessel regression and hypoxia in response to anti-vascular treatment.
Keywords: Photoacoustic imaging; antiangiogenic; hypoxia; vascular normalization; vessel regression.
Conflict of interest statement
Conflicts of Interest: The authors have no conflicts of interest to declare.
Figures

References
LinkOut - more resources
Full Text Sources
Research Materials
Miscellaneous